
Sources of Income for Older Households Have Changed Dramatically

Alicia H. Munnell is a columnist for MarketWatch and senior advisor of the Center for Retirement Research at Boston College.
Earnings are much more important, but 401(k) withdrawals have yet to make their mark.
For many reasons, we have been looking at the sources of income for households ages 62-75 – a group eligible for Social Security, many of whom could be presumed to be retired. Three patterns emerged when comparing data from the Federal Reserve’s 2019 Survey of Consumer Finances (SCF) with the 1995 SCF. Earnings have become increasingly important, income from defined benefit plans remains much larger than withdrawals from 401(k)s, and the distribution of income has become more unequal.
Here are the numbers for all households in which the head is 62-75, grouped by income level. While earnings as a percentage of total income stayed virtually constant for low-income households, earnings increased by 10 percentage points for those in the middle group and by 13 percentage points for high-income households (see Table 1). In the case of the high-income group, earnings now account for more than half of all income.
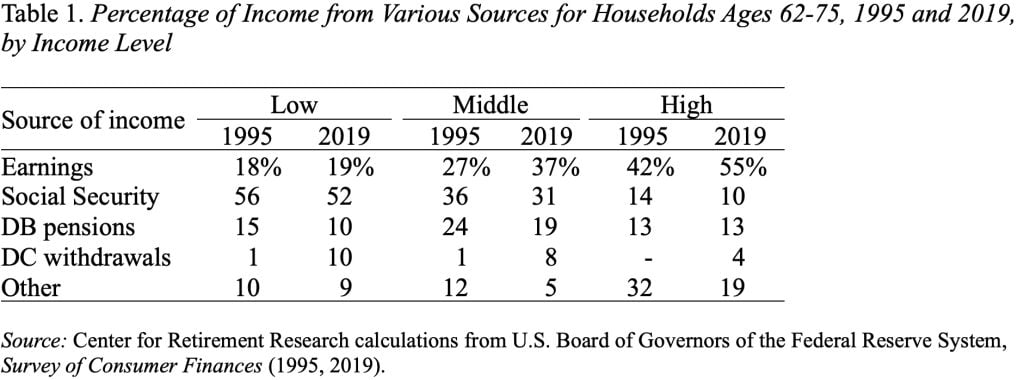
The other interesting thing in Table 1 is the composition of income from employer-sponsored retirement plans. We have all become accustomed to saying that it’s a 401(k) world. Indeed, that’s true for today’s private sector workers. But it is not true yet for retirees. Except for the low-income households, those of retirement age continue to get significantly more from defined benefit pensions than from 401(k) withdrawals. Perhaps, this pattern should not be so surprising, given that: 1) 401(k)s only started in the 1980s; 2) only recent retirees will have been able to spend their whole career covered by a 401(k) plan; and 3) participants are not required to start drawing down their accumulated balances until their early 70s. Moreover, defined benefit plans remain the major source of retirement income for state and local government employees, who comprise about 13 percent of the workforce.
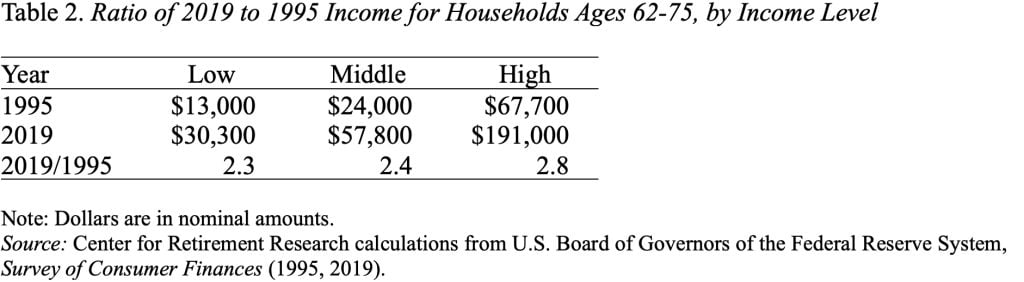
The third point that emerges from these data is that the income distribution for these older households has gotten more unequal (see Table 2). High-income households’ average income in 2019 was 2.8 times the 1995 level, whereas the ratios for low- and middle-income households were 2.3 and 2.4, respectively. The big difference is earnings. The word has gotten out that working longer is the key to a secure retirement, and those with the most education and resources have changed their behavior.
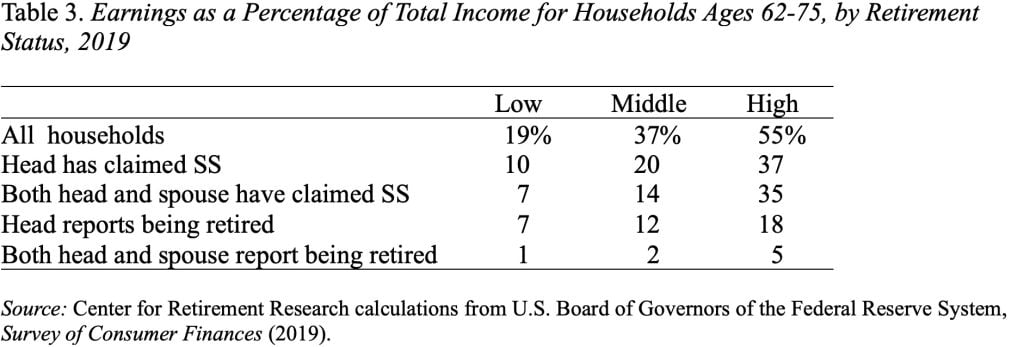
One final issue is that, with the upsurge in earnings, it has gotten increasingly hard to define “retirement” – particularly for high-income households. Receipt of Social Security (SS) benefits used to seem like a surefire way to classify a household as retired, but high-income households – even when both spouses have claimed Social Security – receive more than a third of their income from earnings (see Table 3). The only criterion that seems to work – in the sense that earnings are no longer important – is when both the head and the spouse report being retired.
The main conclusion that emerges from all this is that I am really eager to see the results from the 2022 Survey of Consumer Finances, which should come out sometime this month.