
Wealth-to-Income Ratios Have Not Returned to Pre–Great Recession Levels

Alicia H. Munnell is a columnist for MarketWatch and senior advisor of the Center for Retirement Research at Boston College.
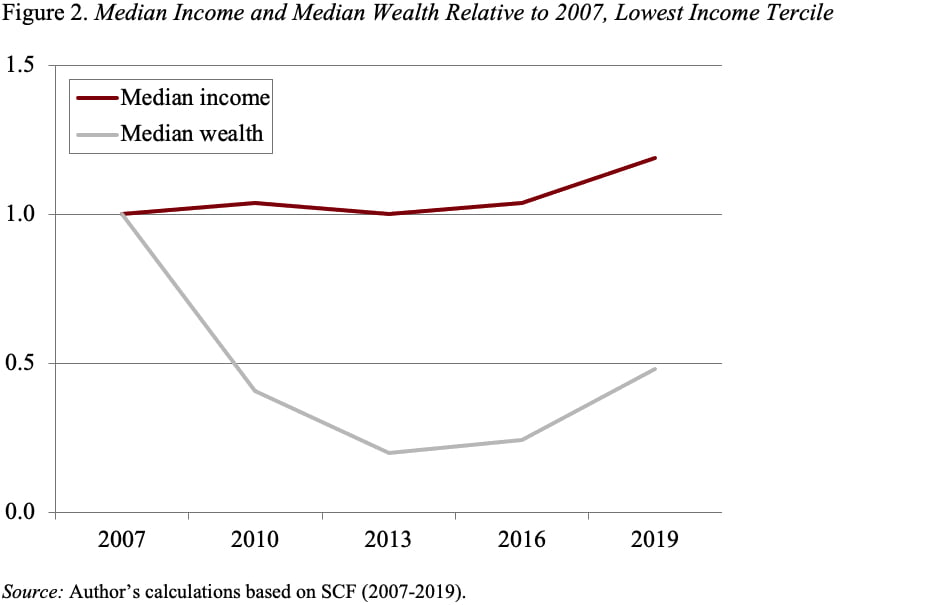
Households in the bottom third have been truly devastated.
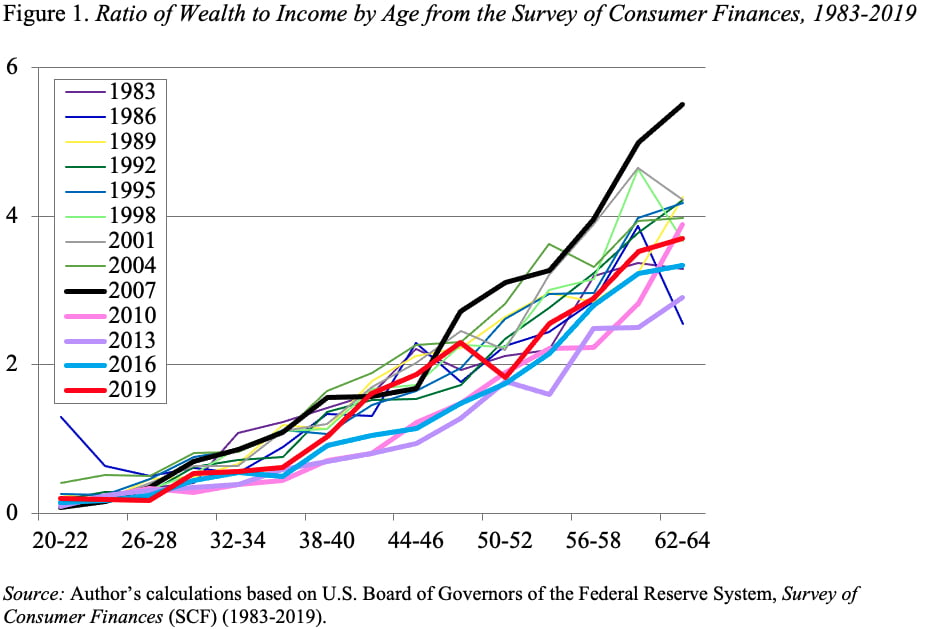
We have been trying to figure out what happened to households’ financial well-being between 2007 and 2019. This exercise led us back to data on the ratio of wealth to income by age from the Federal Reserve’s triennial Survey of Consumer Finances (SCF). In these ratios, wealth includes all financial assets, 401(k) accumulations, and real estate – less any outstanding debt; and income includes earnings and returns on financial assets. Importantly, wealth excludes the expected present value of income that the household will eventually receive from defined benefit pension plans and Social Security.
While historically the ratios at each age for each survey have overlapped substantially, they do shift with major economic developments (see Figure 1). Specifically, the ratios are very high for the boom year 2007, and then drop noticeably in 2010 and 2013, reflecting the damage done by the collapse of the equity and housing markets and the Great Recession. Wealth-to-income ratios for 2019 fall in between these two extremes. (The 2022 SCF will be available next year.)
Let me say something first about the relative stability of these wealth-to-income ratios over time, because five major developments should have led to higher ratios of wealth to income.
- First, between 1983 and 2019, life expectancy at age 65 rose by 3.7 years for men and 2.6 years for women, so one would have expected workers to accumulate more wealth in order to support themselves over their longer period in retirement.
- Second, Social Security replacement rates declined as the Full Retirement Age moved from 65 to 67, and the growing prevalence of two-earner couples means that fewer households receive the spousal benefit.
- Third, the shift from defined benefit plans, where promised benefits are not included in SCF wealth, to 401(k)s, where the assets are included, would have been expected to increase the wealth-to-income ratio.
- Fourth, rising health care costs should have led people to save more.
- Finally, the significant decline in interest rates would have been expected to boost wealth accumulations.
The stability of wealth-to-income ratios over the 13 SCF surveys between 1983 and 2019 – in the face of these five significant developments – indicates that people are less well prepared than in the past. If they were over-prepared in the past, they could be fine today. But if they were not over-prepared in 1983, then they are falling short today.
But, I digress. Our issue is what happened between 2007 and 2019. The short story is that wealth-to-income ratios in 2019 are now in the middle of the pack, and have not returned to the boom levels of 2007 even though the housing and equity markets have reached new peaks. Is the problem that wealth has not been growing or that income has been growing “too fast”?
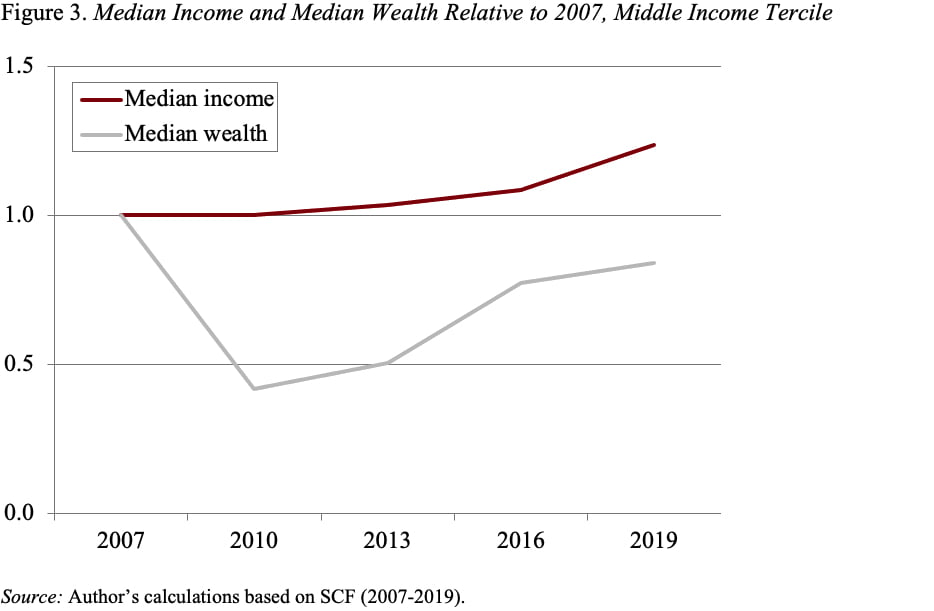
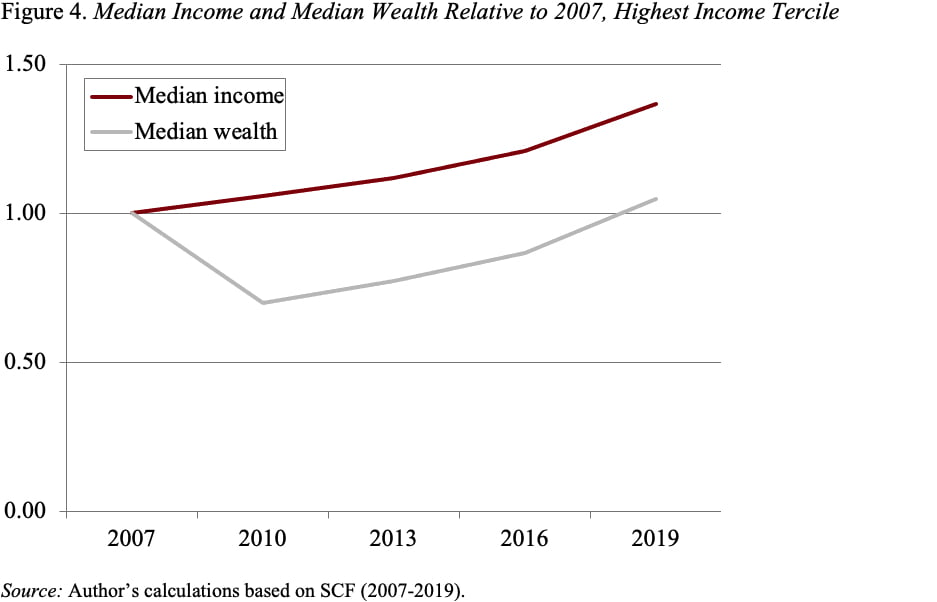
The story varies significantly across the income spectrum (see Figures 2-4). For the bottom third, wealth holdings were devastated by the collapse in housing and still remain far below 2007 levels. For the middle third, wealth did not drop as precipitously and has recovered more. But wealth still remains below 2007 levels, while incomes have risen – depressing wealth-to income-levels. For the top third, wealth has more than fully recovered, but incomes have risen faster – also holding wealth-to-income ratios in check.
I think the bottom line is twofold. First, 2007 was a banner year and probably should not serve as the standard for recovery. Second, the collapse of the housing and equity markets did an enormous amount of damage from which it takes a really long time to recover.