
Poverty for All Age Groups Has Declined from Prepandemic Levels

Alicia H. Munnell is a columnist for MarketWatch and senior advisor of the Center for Retirement Research at Boston College.
While those under 18 gained the most, older people also were also buoyed by stimulus payments.
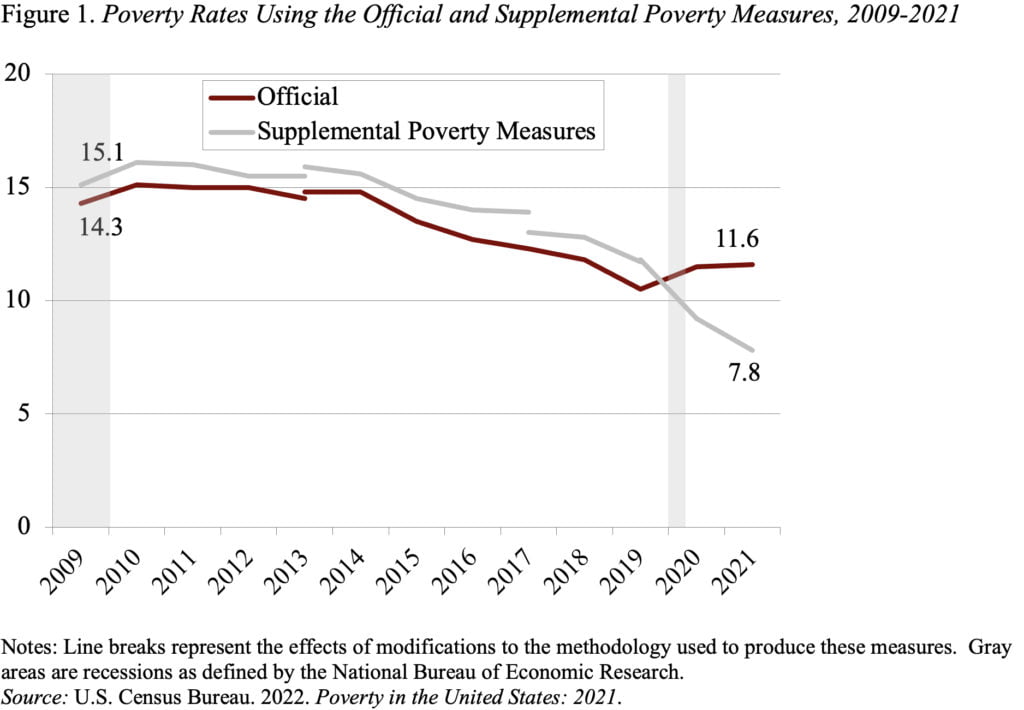
For the first time, the Census Bureau’s annual poverty report included information regarding both the Official Poverty Rate and the Supplemental Poverty Measure, which was first introduced in 2011.
As a reminder, the official measure compares a family’s pretax money to a threshold based on the number of people. The thresholds, which were established in the 1960s, were set at three times the cost of a minimum food diet. These thresholds have been increased annually over the past six decades to reflect changes in the cost-of-living, as measured by the CPI-U.
The Official measure does not reflect:
- Government tax and in-kind benefit programs: Taxes reduce disposable income, and in- kind programs, such as food stamps, free up money for other things.
- Rising standards of living: In the 1960s, the poverty threshold equaled about one half of median income; today it is about one third.
- Costs associated with earning a living: Child care and transportation reduce the amount available for spending.
- Variation in medical costs: Medical costs vary by health and insurance status.
- Geographic differences in prices: Housing costs more in Manhattan than in Mississippi.
The Supplemental Poverty Measure addresses these issues. It establishes a poverty threshold for a basic set of goods based on data from the Consumer Expenditure Survey and then compares these thresholds with family resources. These resources include the value of all cash income plus in-kind benefits minus necessary expenses.
- In-kind income includes nutritional assistance, subsidized housing, and home energy assistance.
- Necessary expenses include taxes, childcare, and other work-related expenses, and medical out-of-pocket costs.
Looking at both measures is particularly important in 2021, because the effect of the American Rescue Plan, enacted in March 2021, are represented differently in the two measures, and resources stemming from stimulus payments, expansions of refundable tax credits, and pandemic-expanded school lunch programs are included in the Supplemental but not in the Official measure. While historically, the Supplemental poverty rate has been higher than the Official, that relationship reversed in 2020 and 2021 in the wake of the antipoverty measures adopted during the pandemic (see Figure 1).
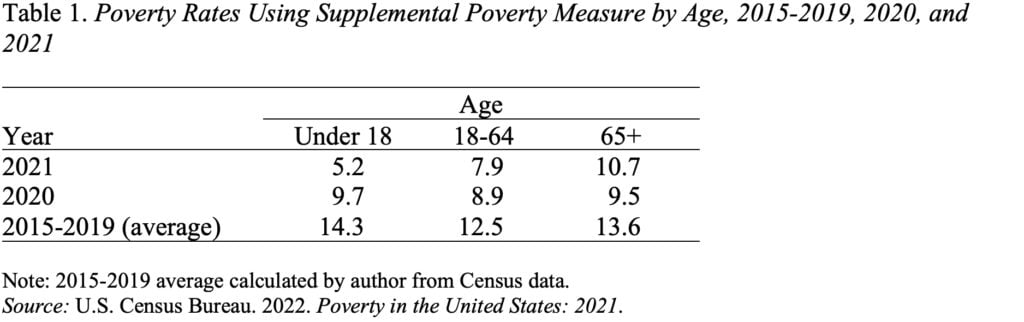
All the action shows up only in the Supplemental measure; the Official poverty rates change very little over the period. As shown in Table 1, children saw the largest decline in poverty driven by the stimulus payments and making the Child Tax Credit fully refundable. Their parents also gained as these provisions increased family resources. The elderly too saw their poverty rate drop in 2020 and 2021 as a result of stimulus payments, but their experience was a lot less dramatic.
Given the recent concern about the uptick in poverty rates for those 65+ – an uptick that occurred under both poverty measures, the fact that recent rates for the elderly are below the pre-pandemic levels should offer some comfort. But the future does not look bright, given that the wealth holdings of those approaching retirement have been declining with each cohort.