
Where Does the $250,000 Income Divide Come From?

Alicia H. Munnell is a columnist for MarketWatch and senior advisor of the Center for Retirement Research at Boston College.
No one must read the Census annual publication Income, Poverty, and Health Insurance Coverage in the United States for anything but the number of people in poverty. The parts I find most interesting are those pertaining to the level and distribution of income. The numbers go to the heart of conversations about the “middle class” and the “rich.”
Both President Obama and Governor Romney have adopted household income of $250,000 as a meaningful demarcation point for defining the middle class. In the case of the President, he proposes to retain the Bush tax cuts for households with less than $250,000 and eliminate the tax cuts for those above that threshold. Governor Romney in a recent ABC interview offered the same definition of the middle class: “Middle income is $200,000 to $250,000 and less.”
Where does this concept of $250,000 as the appropriate cutoff come from? According to the data in the Census report shown in Table 1 below, which presents the thresholds for being in different parts of the income distribution, the middle household in 2011 had an income of $50,054. A household with an income of $143,611 was at the 90th percentile point, or in the top 10th of the income distribution. A household with an income of $186,000 was at the 95th percentile, or in the top 5 percent. The table does not even show households with $250,000, but they must be in the top 97th or 98th percentile.
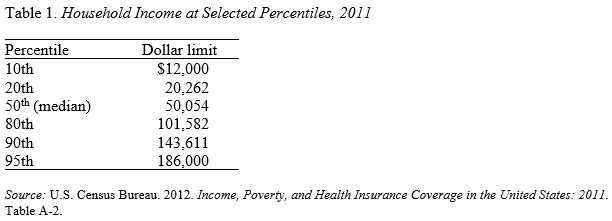
The thresholds must be interpreted with caution because households include old and young, urban and rural, coastal and midland, and small and large. But it is very hard to understand how anyone could think of $250,000 as the middle. It seems like both candidates have a mental picture of the very rich and everyone else.
The “very-rich-versus-everyone-else” framework may come from data on the share of income earned by various households. Here the Census data show that those in the top quintile – the highest-earning 20 percent – earn more than the bottom four quintiles combined (see Table 2). That is, the top 20 percent receives more income than the bottom 80 percent.
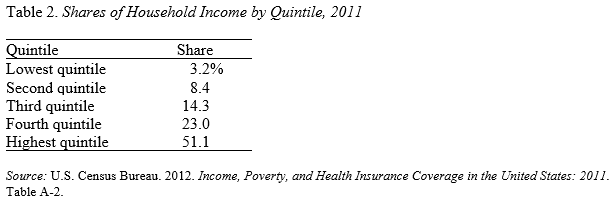
And a recent study by Emmanuel Saez shows that within the top quintile the distribution is also very skewed, so that the top one percent receives about 20 percent of total income.
Thus, while the $250,000 threshold makes no sense in describing the middle class, it seems like a relevant divide for defining where the money is. Nevertheless, dividing the nation’s households into the “wealthy” and “the middle class” doesn’t seem like a useful exercise. It pits the majority of Americans against the top 1 or 2 percent. It suggests that the majority of Americans should not be called upon to solve the nation’s fiscal problems. It violates the notion that we are all in this together. Yes, the rich can contribute more, but we can all contribute something.