Your 401(k) Balances Aren’t All Yours!
Alicia H. Munnell is a columnist for MarketWatch and senior advisor of the Center for Retirement Research at Boston College.
The IRS has a claim on a chunk.
A paper that my colleague Anqi Chen and I wrote last year – “How Much Taxes Will Retirees Owe on Their Retirement Income?” – keeps hitting the “top 10” list on a major listserv for social sciences research. So let me share our findings.
As people approach retirement, they tend to add up their financial resources – Social Security benefits, defined benefit pensions, defined contribution balances, and other assets. However, many may forget that not all of these resources belong to them; they will need to pay some portion to the federal and state governments in taxes. The question we look at is just how large the tax burden is for the typical retired household and for households at different income levels.
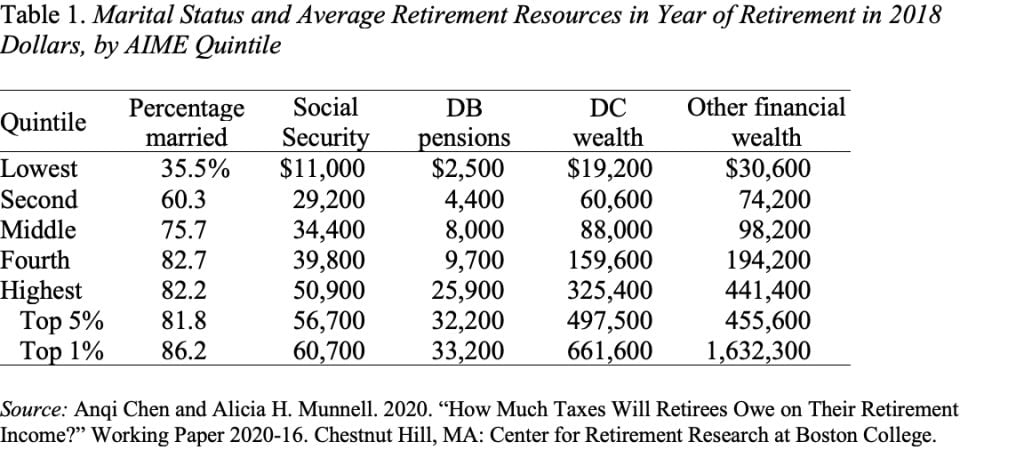
The analysis is based on income data from the Health and Retirement Study (HRS), a nationally representative longitudinal survey of older Americans. The project focuses on recently retired households where at least one earner claimed Social Security between 2010 and 2018. The characteristics of the sample are shown in Table 1. Note that the HRS excludes the extremely wealthy, so the top 1 percent looks more like a well-heeled academic than Bill Gates!

For each household in our sample, we project its income over the expected retirement span from Social Security, employer-sponsored plans, and other financial wealth. Once these income streams are identified, we use the TAXSIM 32 program, developed by the National Bureau of Economic Research, to derive federal and state taxes. The results relate the present discounted value of lifetime taxes at retirement to the present value of retirement resources.
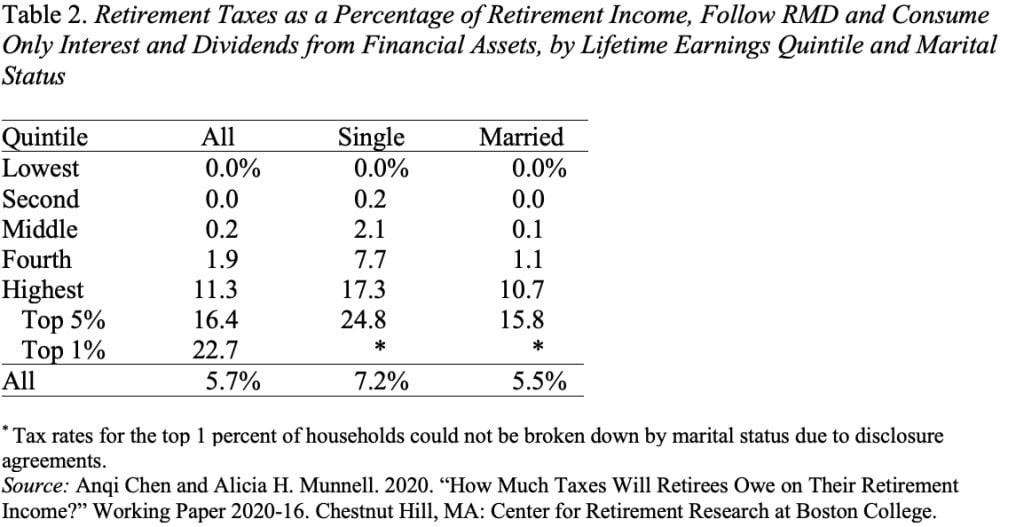
The tax rate varies sharply by lifetime earnings quintile. Those in the bottom three quintiles pay close to zero, but the rate rises to 1.9 percent for the fourth quintile and 11.3 percent for the top quintile, 16.4 percent for the top 5 percent, and 22.7 percent for the top 1 percent. Moreover, as noted, the asset levels for the top 1 percent look very similar to what academics hold in their TIAA accounts; the taxes on the wealthier households – not included in the HRS – would exceed the 22.7 percent.

In short, all the money in our 401(k)s does not belong to us!


