
Are We Undercounting or Overcounting COVID-19 Deaths?

Alicia H. Munnell is a columnist for MarketWatch and senior advisor of the Center for Retirement Research at Boston College.
Historically, death rates suggest undercounting more likely.
I was curious about whether we were overcounting or undercounting the number of deaths from COVID-19. At an early news conference, Deborah Birx, MD – the response coordinator for the White House coronavirus task force – indicated that the United States was more likely to attribute a death to COVID-19 than other countries. In some countries, if the virus forced an individual with a pre-existing heart or kidney problem to go to the ICU, his death would be recorded as due to a heart issue or a kidney issue. But in the United States, that death would be recorded as a COVID-19 death.
One might think that such an approach, by ignoring the pre-existing conditions, would skew the count of COVID deaths to the high side. On the other hand, stories in the New York Times and Washington Post concluded that deaths were undercounted due to lack of testing and inconsistent protocols.
A simple approach to addressing this question is to look at the total number of “excess” deaths in 2020 compared to earlier years, with excess deaths defined simply as the change in deaths over the previous year. To get a sense of normal fluctuations in deaths, Figure 1 shows this change for the period from late March to mid-August for 2016 through 2020. Clearly something unusual happened in 2020.
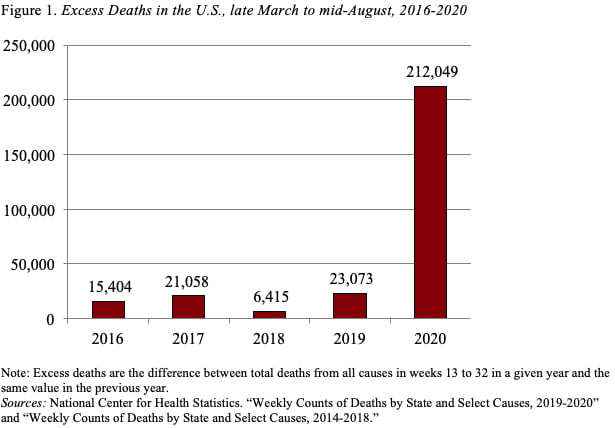
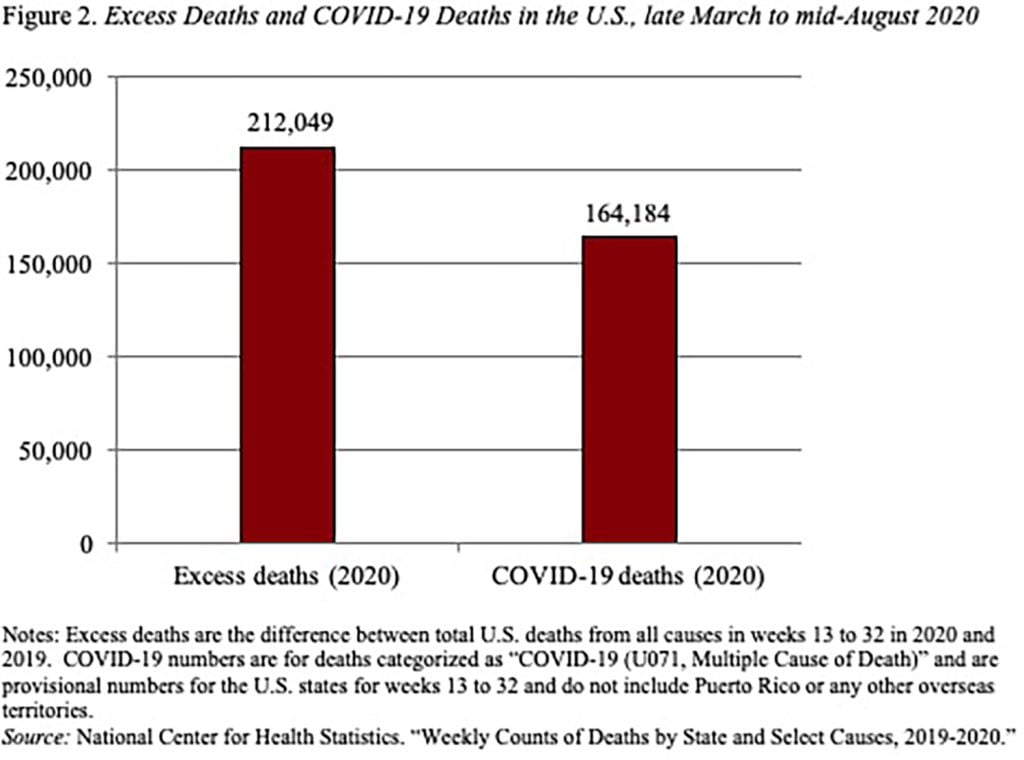
Figure 2 compares the numbers of deaths attributed to COVID-19 for the late March to mid-August period to the total number of excess deaths. The COVID deaths account for only 77 percent of the total excess deaths over the period. Not all of the difference, however, need be COVID underreporting, since the normal year-to-year increase in deaths from other causes appears to be roughly 20,000. Still even accounting for this normal fluctuation, about 28,000 deaths seem unexplained (212,049 – 164,184 – 20,000).
To see where underreporting might be coming from, we repeated the same exercise for each state. Figure 3 shows the states with an average ratio (72-82 percent) of COVID deaths to total excess deaths, those with a higher ratio (greater than 82 percent), and those with a lower ratio (less than 72 percent). The only thing that’s clear is that those states hard hit by the virus – that is, more than 100 COVID deaths per 100,000 – seem to have high ratios of COVID to total excess deaths – Connecticut (115 percent), Rhode Island (110 percent), Massachusetts (101 percent), New Jersey (80 percent), New York (81 percent), and Louisiana (77 percent). (Data on each state are available on the interactive map in Figure 3.)
Maybe you can see more of a pattern. I’m a little out of my lane here!!