
New Census Data Suggest that Retirement Savers Face a Daunting Challenge

Alicia H. Munnell is a columnist for MarketWatch and senior advisor of the Center for Retirement Research at Boston College.
Most families have relatively little money and median income has been stagnant.
If you hang out in the Northeast and talk to financial types and academics who worry about pensions and retirement income, it is easy to get lulled into the notion that the mass affluent – the upper middle of the income distribution – have incomes of about $250,000. That’s why I welcome every year the Census Bureau’s publication Income and Poverty in the United States. The 2017 data in the most recent release show once again how little income most American families have and how little these amounts have grown over time.
Table 1 presents the thresholds for being in different parts of the income distribution. For example, a household with income of $61,372 is at the 50th percentile mark – right in the middle of the income distribution. A household with an income of $179,077 is at the 90th percentile point, or in the top tenth of the income distribution. Even more amazing, a household with an income of $237,034 is at the 95th percentile, or in the top 5 percent.
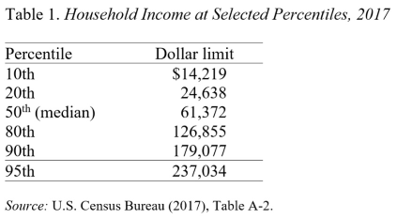
The thresholds must be interpreted with caution because households include old and young, urban and rural, coastal and midland, and small and large. Yet, the data clearly show that those households with incomes of $250,000 are in the top five percent of households.
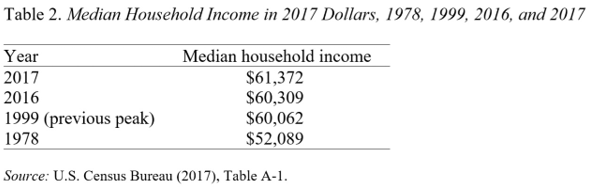
In addition to most families having relatively little money, median household income in constant 2017 dollars has changed very little since 1978 and is only slightly above its peak in 1999 (see Table 2).
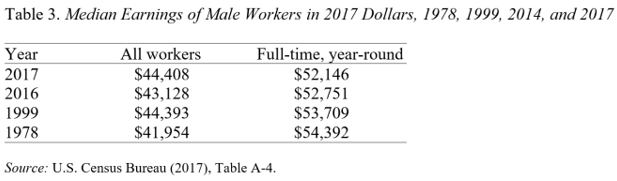
The reason that household income has not gone up very much is that earnings have been stagnant. While real earnings for all male workers in 2017 were above what they were in 1978, for full-time, year-round workers they were lower (see Table 3).
For those of us interested in retirement security, these numbers create an enormous challenge. How can people put aside enough during their working lives to finance retirements that will last on average 20 years?