Dispersion in Death Rates has Huge Implications for Social Security
Alicia H. Munnell is a columnist for MarketWatch and senior advisor of the Center for Retirement Research at Boston College.
But the Titanic shows that the pattern favoring the wealthy is not new.
Rich people live long lives, and poor people die early. This pattern has major implications for the costs and progressivity of the Social Security program. Even if both high and low earners claim at the same age, low earners receive their relatively small benefits for only a few years, while high earners will get large checks for an extended period of time. This pattern undermines much of the progressivity in the Social Security benefit formula, which was designed to provide higher levels of earnings replacement for low earners than high earners.
The situation is further complicated by problems with the actuarial adjustments for early and late claiming and by the claiming patterns of high- and low-wage individuals.
The ability of workers to claim their Social Security benefits at any age between 62 and 70 has evolved over decades. The goal has always been to ensure that the costs to the system, for the worker with average life expectancy, were not affected by the age at which workers claimed. To keep the costs equal, benefits claimed early are reduced to reflect the increase in years of benefit receipt, and benefits claimed later are increased to reflect the fewer years. Our ongoing work suggests that these adjustments, which were enacted decades ago, are no longer correct. The penalty for early claiming is too punitive and the reward for late claiming is too generous.
Combine this finding with claiming patterns and the system becomes extremely unfair. Low-wage workers, who tend to claim early, are unduly punished, while high-wage workers, who claim later, are unduly rewarded.
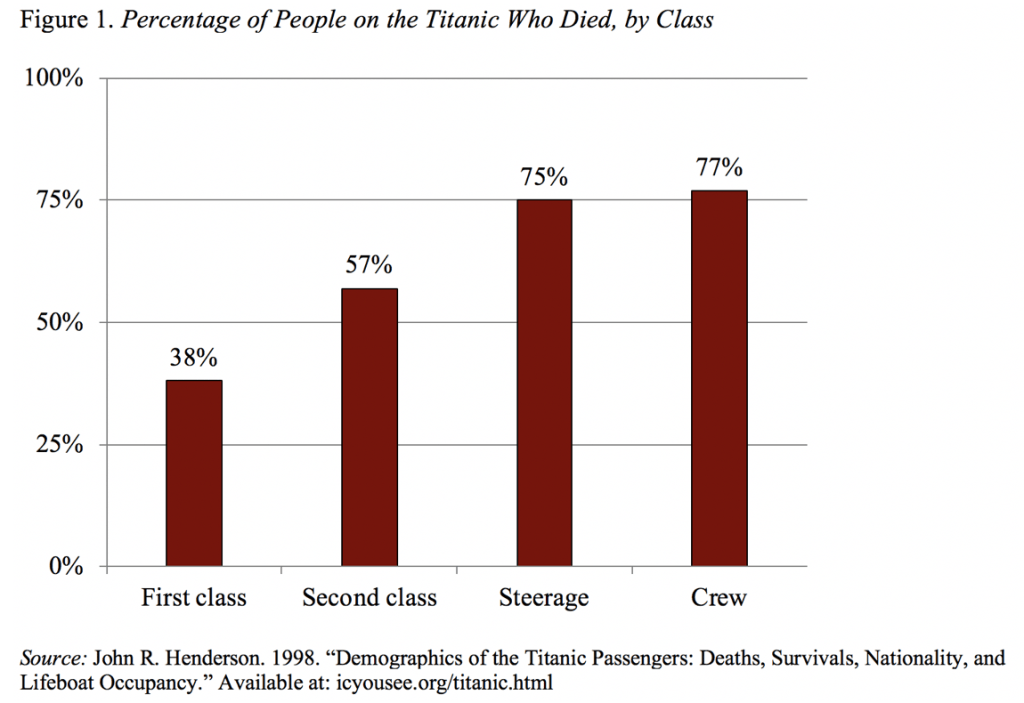
While all this stuff is interesting and important, I bring it up again only as an excuse to share data about death rates on the Titanic. I had been looking for something to document that the dispersion in life expectancy is not new, and came across a trove of really interesting statistics showing death rates by class. The ship carried an estimated 2,218 people, 1,300 passengers and 918 crew. Overall, 68 percent of the people on board perished, but the death rate varied substantially. Of those in First Class, 38 percent died, in Second Class 57 percent, in Steerage 75 percent, and among the crew 77 percent (see Figure 1). So the relationship between money and life expectancy has been with us for a long time.

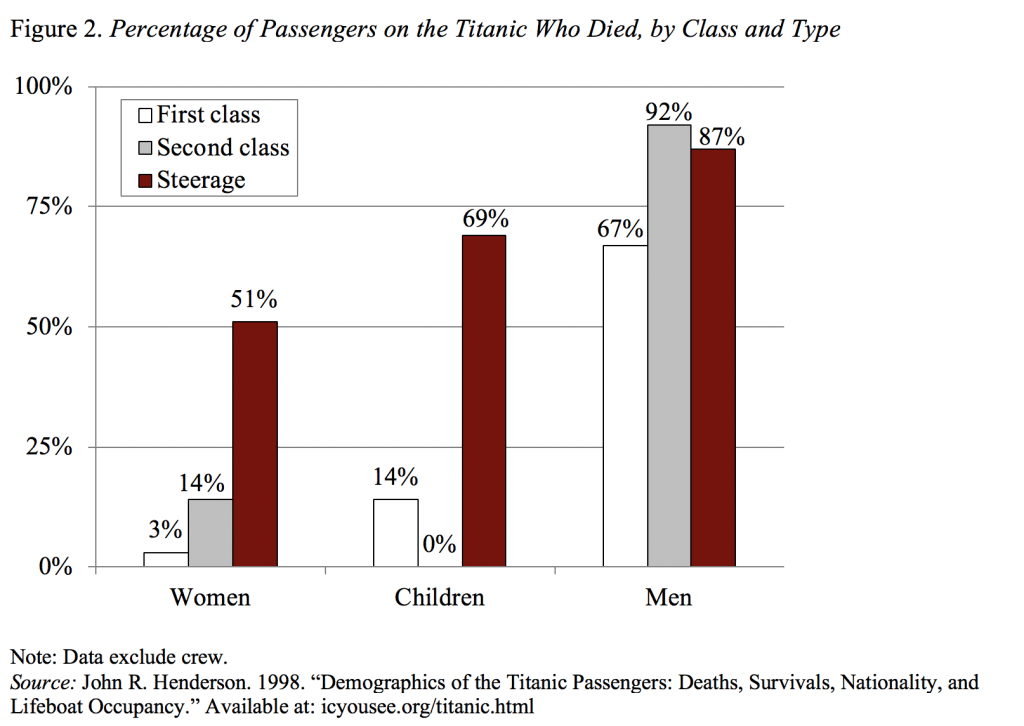
In addition to the overall statistics, a breakdown by gender got my attention. As shown in Figure 2, women and children fared much better than men. In fact, only 3 percent of First Class women died. Nowadays, can we both have careers and take advantage of “women and children first”?


