
Do Higher Fees Help State and Local Pension Plans Hit their Benchmarks?

Alicia H. Munnell is a columnist for MarketWatch and senior advisor of the Center for Retirement Research at Boston College.
The answer appears to be “no.”
State and local government pension plans review their investment performance in two main ways. At a broad level, they compare their overall portfolio returns to their peers or to a simplified portfolio (such as a 60/40 stock/bond index). At a narrower level, plans compare their returns by asset class to selected benchmarks that reflect their investment goals for the asset class. Plans pay fees to external asset managers with the expectation that managers will meet or exceed these benchmarks. The question addressed in a recent study by Jean-Pierre Aubry and Caroline Crawford is whether higher fees help or hurt a plan’s ability to outperform its chosen benchmarks.
For traditional asset classes such as equity or fixed income, most plans use established indices, such as the Russell 3000 for domestic equities, MSCI ACWI for international equities, and Barclays U.S. Aggregate Bond Index for fixed income. For private equity or hedge funds, the benchmarks fall into one of two categories: 1) an existing index of publicly traded assets plus a premium; or 2) a third-party index such as the Cambridge Associates Private Equity Index or the HFRI index for hedge funds. To benchmark the whole portfolio, state and local plans use either a weighted average of asset class benchmarks, the average performance of a selected peer universe, the expected rate of return on investments, or a public index (often, plus a premium).
The study was based on newly collected data on public pension fees and portfolio performance. To measure performance and isolate the impact of fees, the analysis focused on each plan’s ability to execute its own strategy by measuring the plan’s net-of-fee portfolio returns relative to a blend of the plan’s stated asset-class benchmarks.
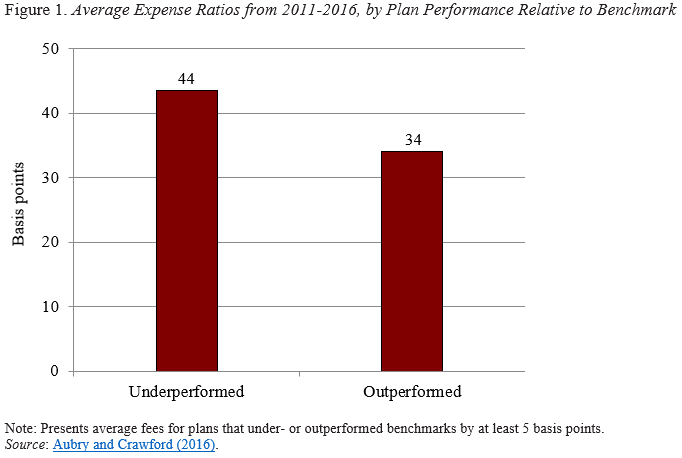
In terms of total portfolios, on average, plans that reported better net-of-fee performance relative to their blended benchmarks from 2011-2016 also paid lower fees (see Figure 1).
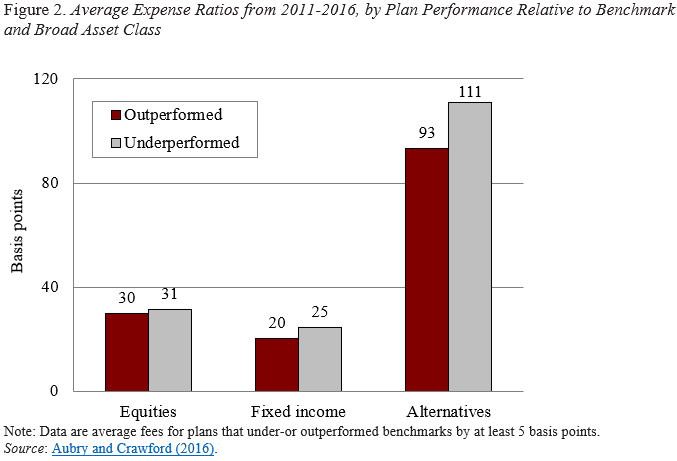
In terms of individual asset cases, it is best if the asset is held consistently over the entire period. Because plans move in and out of smaller asset classes, the analysis focused on three broad asset classes – equities, fixed income, and alternatives. For these three asset classes, Figure 2 shows the average expense ratio – defined as the dollar amount of fees paid divided by the dollar amount invested in the asset class – for plans that outperformed and underperformed. For all asset classes, plans that outperformed their benchmarks had lower expense ratios than those that underperformed.
These initial findings suggest that investment fees – in particular, outsized fees on alternatives – may play a meaningful role in plan underperformance. Future research on the impact of fees would benefit from a longer timeframe that incorporates a full market cycle – which will be increasingly possible as the trend toward improved fee disclosure continues.