
Has COVID-19 Really Affected Life Expectancy?

Alicia H. Munnell is a columnist for MarketWatch and senior advisor of the Center for Retirement Research at Boston College.
Yes, many died in 2020-21, but hopefully it is a one-shot event.
The Centers for Disease Control and Prevention (CDC) recently reported that life expectancy had dropped sharply in the wake of COVID-19, and the story was picked up by every media outlet. But it’s not clear to me what this really means.
Period life expectancy at birth, the concept used in the CDC release, is the average number of years that newborns, say, in 2019 would live if they experienced at each age the death rates observed in 2019. According to the CDC, life expectancy at birth in 2019 for Americans was 78.8 years.
Then COVID hit, and more than 500,000 people died. As a result, death rates observed in 2020 and 2021 will be higher than in 2019, and the calculated life expectancy for newborns shorter. Using the data for the first six months of 2020, the CDC estimates that life expectancy at birth will decline by one year to 77.8 in 2020.
But my question is about 2022. Assuming masks, social distancing, and vaccines defeat COVID in 2021, why should the death rates be any different in 2022 than in 2019? If nothing else were going on, the death rates – and therefore life expectancy – for the two crops of newborns – 2019 and 2022 – should be the same. (Ignore for this discussion that other things are going on. Most importantly, “deaths of despair” – deaths from opioids, alcohol, and suicides have been putting downward pressure on life expectancy since 2014.)
Thus, while period life expectancy incorporates the effects of COVID for 2020 and 2021, the exercise doesn’t really provide any insights about long run trends or the severity of the COVID-pandemic.
Two Berkeley demographers also conclude that life expectancy overstates the impact of a one-shot event. Not only is the effect temporary, as noted above, but also the magnitude of the change reflects the implicit assumption that the pandemic will occur every year in a person’s life. Instead, they suggest that a more useful way to measure the severity of an epidemic is “life years lost.” The authors proceed with three figures.
Figure 1 shows the number of deaths from COVID-19 compared to the Spanish Flu, HIV, and Opioids. The HIV epidemic, which peaked in the 1990s, and opioid deaths, which continue today, are relatively small on a per-year basis but occur for decades and therefore accumulate to large losses. In terms of absolute numbers, COVID deaths fall short of previous epidemics.
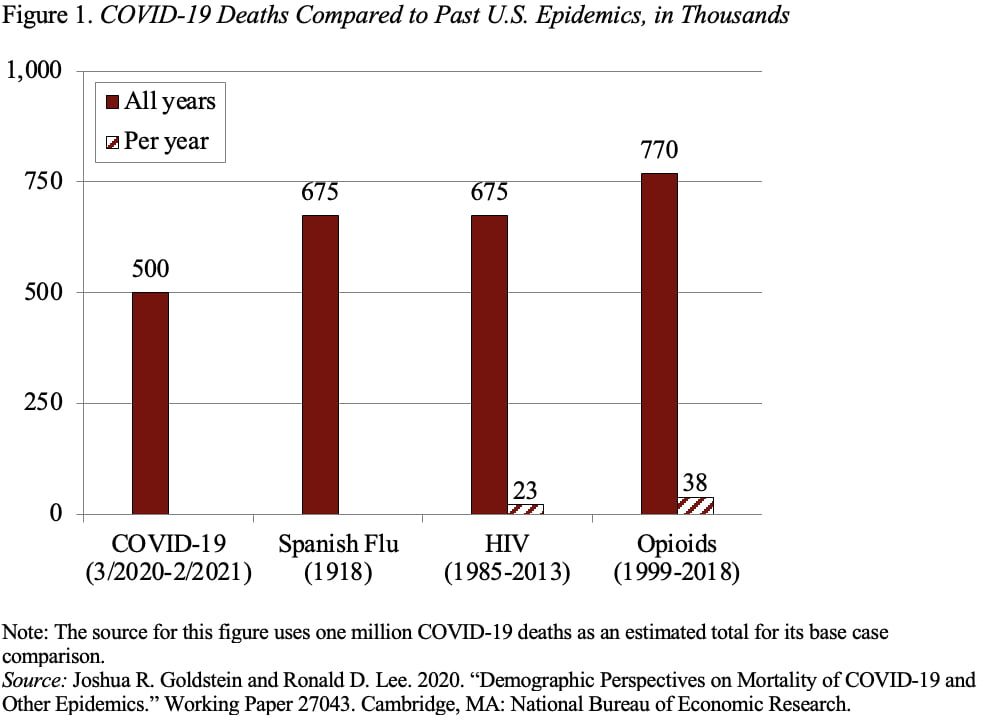
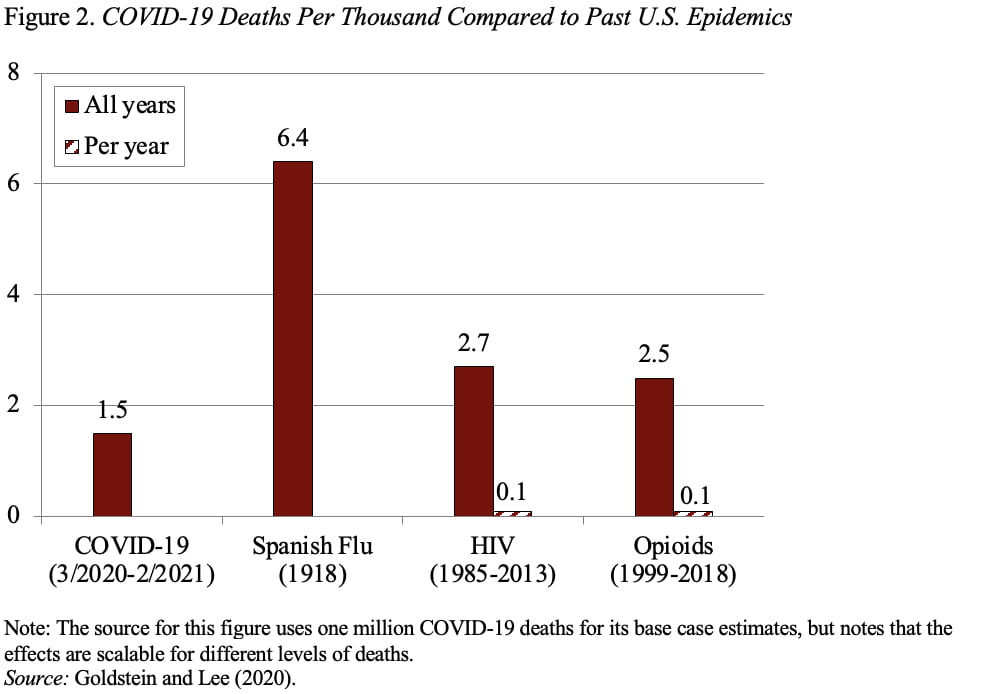
Figure 2 takes account of the size of the population at the time and reports the deaths per thousand people. This measure shows that the Spanish flu produced the highest death rate.
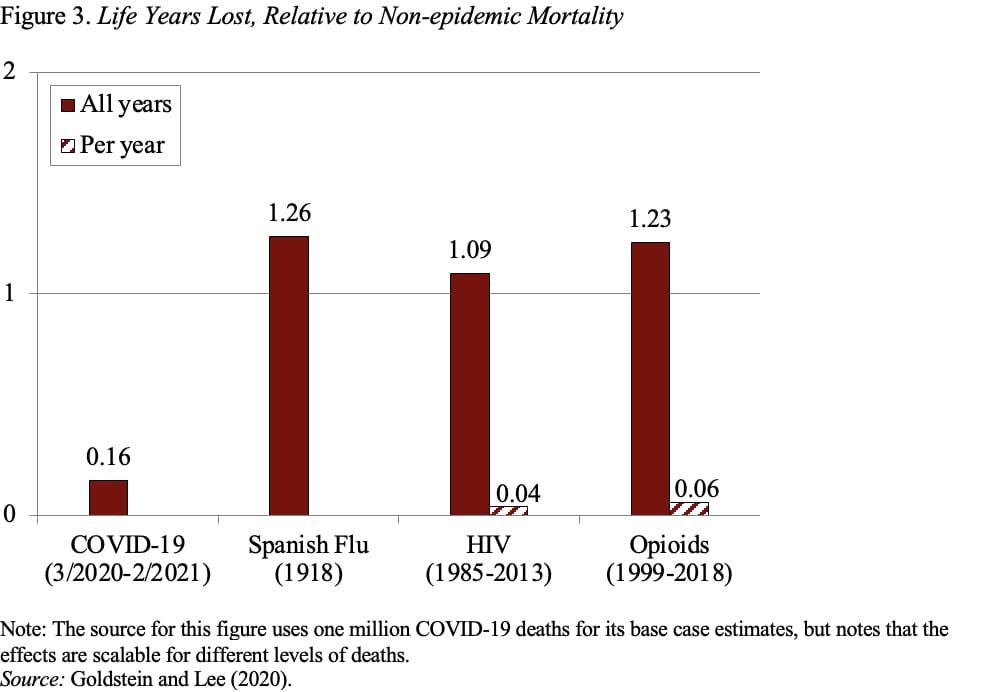
Finally, Figure 3 incorporates in the comparison the age at which individuals died. Basically, COVID-19 affected older individuals, while the Spanish flu devasted those in their 20s. HIV and the opioid epidemic also affected the young. Thus, in life years lost, the other epidemics dramatically outpaced COVID-19.
The point of this discussion is not to minimize the tragedy caused by COVID-19, but rather to measure its impact in a sensible way. Changes in life expectancy don’t make any sense as a metric for measuring the effect of COVID-19 because they will only affect the estimates in 2020 and 2021, and the calculation implicitly assumes that the epidemic occurs over and over as the person ages.