
How Much Are Emergency Expenses for Retirees and Are They Prepared?

The brief’s key findings are:
- People of all ages need emergency savings, but researchers tend to focus on the working-age population.
- In contrast, this study explores the needs of retired households.
- The results show that the typical retired household spends 10 percent of income on unexpected expenses in a normal year.
- Strikingly, two in five households lack the cash to cover such expenses for just one year. And one in five falls short even after including retirement savings.
- In short, unexpected expenses could be a source of financial stress for which many retirees are unprepared, especially those with lower incomes.
Introduction
Emergency savings are a key component of financial security for households of all ages. To decide how much cash savings to have on hand and how to balance this need with other financial priorities, households need good information on the spending shocks they may face. Research to date focuses mainly on working-age households, but the needs of retirees may differ. Thus, it is useful to explore the unexpected expenses that older households face to answer two questions: 1) how much do they need? and 2) how well prepared are they to handle these expenses?
This brief, based on a forthcoming paper, uses the Health and Retirement Study to explore these questions for households ages 65+, including the variation among households.1 The discussion proceeds as follows. The first section summarizes prior research. The second section describes the data and methodology. The third section presents the results, which show that annual unexpected expenses equal about 10 percent of income for the typical retired household, and about 40 percent of households do not have enough cash to cover even a single year, let alone their whole retirement. The final section concludes that unexpected expenses could be a significant source of financial stress that many retirees, particularly the most vulnerable, are unprepared to handle.
Background
Emergency savings provide a buffer to help households weather unexpected expenses and prevent them from tapping into high-cost forms of borrowing, such as credit card debt. Existing research and policy initiatives on emergency savings focus on working-age households.2 However, unexpected expenses do not go away once people retire, and retirees may face a different mix of shocks. For example, the largest financial shock for working households is job loss.3 This risk often drives rules of thumb from financial planners, such as having three to six months of income saved. But other risks – such as health or family concerns – loom larger for retirees. Understanding retirees’ specific needs for unexpected expenses is important, as it has implications for how they navigate retirement risks, such as how much to allocate for annuities, the degree of reliance on family for long-term care, and whether to tap home equity.
Determining how much emergency savings people should have requires knowing how often they face expense shocks, the size of these shocks, and how well prepared they are currently. However, the literature is not clear on these questions, particularly for retirees.
Previous research on unexpected expenses among retirees focuses almost exclusively on healthcare shocks and finds they are a big risk.4 One of the few studies that looked at a broader set of unexpected expenses for retirees found that the incidence of more general needs, such as major home or car repairs, is similar to working-age households.5 A 2017 survey of households of all ages showed broad similarity across age groups in the prevalence of various types of non-job-related shocks.6
One challenge in determining how much to set aside for unexpected expenses is that the costs can vary dramatically. In the 2017 survey, a quarter of respondents reported spending less than $800 on unexpected expenses while another quarter reported spending at least $6,000, with a median expense of $2,000.7 One reason for the large variation is that households have a degree of flexibility when deciding how to address expense shocks. For example, if a household needs a new refrigerator or new tires, there are different tiers of refrigerators or tires to choose from. Not surprisingly, then, the 2017 survey also found that the cost of shocks increases for those with higher socioeconomic status, as they are less likely to defer or forgo home maintenance expenses and more likely to pick higher-end replacements.
This study builds on prior work by exploring a full set of unexpected expenses that retirees face and comparing these expenses with their liquid assets to assess preparedness. The analysis also examines variations by socioeconomic characteristics.
Data and Methodology
This section describes the data and methods for estimating what expenses are “unexpected,” and for predicting these expenses and the ability to handle them.
Data
The data come from the 2000-2020 Health and Retirement Study (HRS) and the accompanying 2001-2019 Consumption and Activities Mail Survey (CAMS).8 The HRS is a biennial panel survey of households, in which the head is ages 51+, that collects information on income, balance sheets, pensions, and health. About a fifth of HRS households are also given the CAMS, a consumption survey that can be linked to the HRS.9 Our sample consists of CAMS households in which at least one spouse is 65+ and self-reports being retired, defined for simplicity as claiming Social Security benefits.10 The sample consists of 3,427 households and 15,804 household wave observations.
Methodology
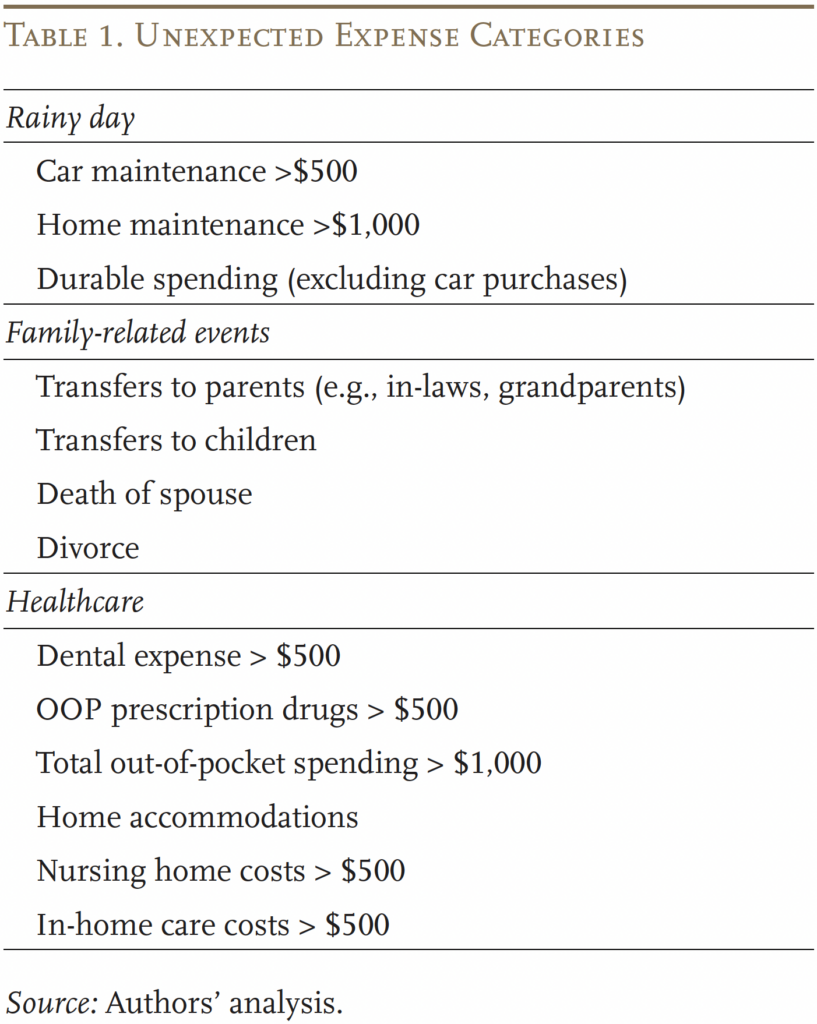
The analysis begins by calculating how much households spend annually on various unexpected expenses in retirement using three broad categories: 1) “rainy day” expenses; 2) family-related events; and 3) healthcare costs. See Table 1 for a description of what falls in each category. Once we document the typical expenses retirees face as a whole, we examine the variation by different groups, with an emphasis on measures of socioeconomic status. For information on how we classify expenses as unexpected, see the Box.
Box. Estimating Unexpected Expenses
One limitation of expenditure data, including the CAMS, is that it is not always easy to distinguish between anticipated maintenance and an unexpected expenditure. For example, a car owner expects to regularly spend money on oil changes but not on a new exhaust system. However, both expenses would be categorized as a car maintenance expense. Similarly, most dental and prescription drug insurance have co-pays, and costs such as regular dental cleanings or heart medication would not be unexpected. To roughly distinguish between maintenance costs versus an unexpected expense, we set dollar limits on certain expense categories. For general car or home maintenance, we categorize expenses that are over $500 and $1,000 (in $2019), respectively, as unexpected. Similarly, for medical spending, we categorize dental expenses over $500, out-of-pocket prescription drugs over $500, and total out-of-pocket medical costs over $1,000 as unexpected. Long-term care expenses are trickier because care needs may come on suddenly or may just gradually increase with age. In the latter case, it may not be “unexpected.” However, once again, for simplicity we also consider nursing home or in-home care costs over $500 as unexpected.
Using the incidence and average cost of each shock for households with various characteristics, we can calculate: 1) the predicted cost of annual unexpected expenses that different types of retirees will face over their lifetime; 2) the size of these expenses relative to their income; and 3) whether they have enough liquidity to cover them. Together, these measures can help retirees assess the risks of expense shocks and determine if they have sufficient emergency savings to weather these expenses without having to liquidate investments or borrow.11
Results
This discussion begins with the prevalence of unexpected expenses, followed by predicted annual unexpected expenses, and household preparedness.
Probability of Unexpected Expenses
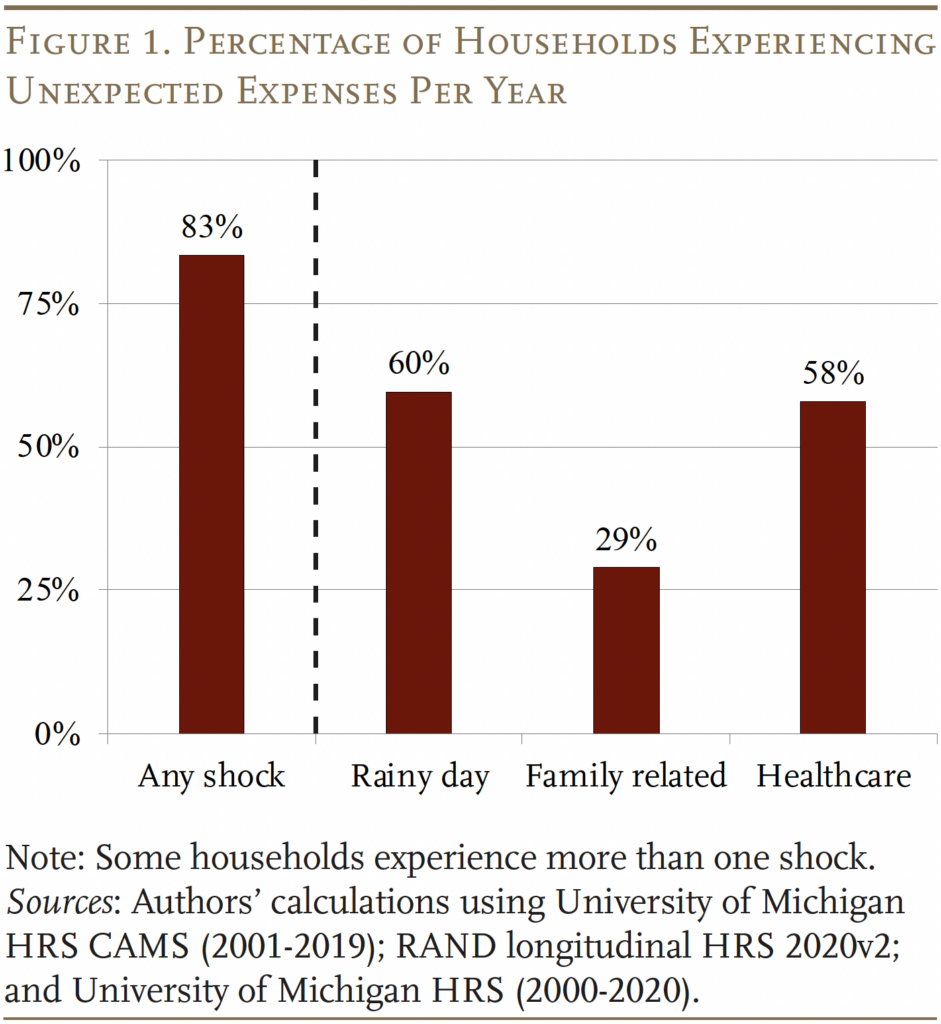
In any given year, 83 percent of all households will experience some unexpected expense. In terms of the type of expense, 60 percent of all households will face a rainy day shock; 29 percent will have an unexpected family-related expense; and 58 percent will confront an unexpected healthcare expense (see Figure 1).
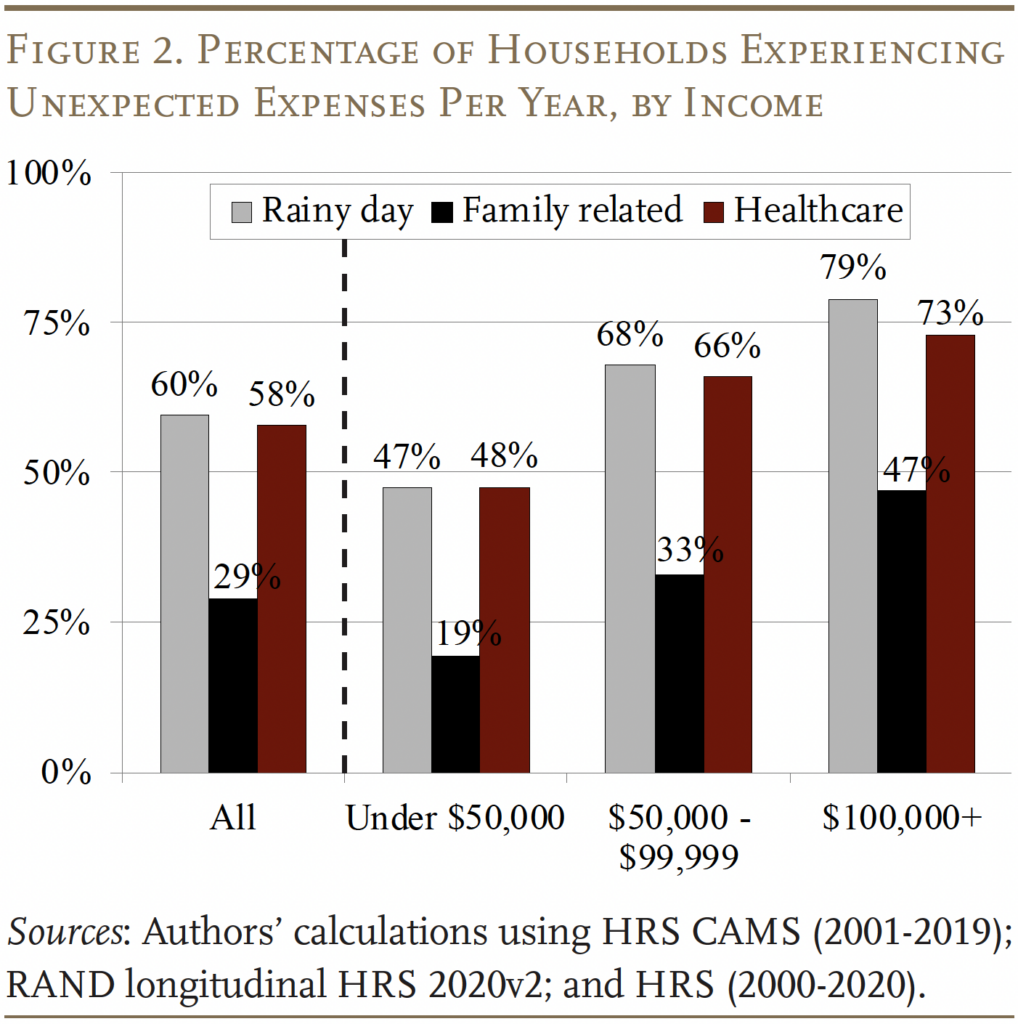
The most striking differences by household type are by socioeconomic status (SES), particularly income. As income rises, the prevalence of each type of shock also rises (see Figure 2). For example, roughly 45 percent of the lowest-income households (less than $50,000) face a rainy day or healthcare shock in a given year compared to roughly 80 percent of the highest earners ($100,000+). This finding highlights the fact that households have some control over when and how much they spend. As noted above, those with higher incomes are more likely to incur unexpected expenses on, say, home or car maintenance when these needs arise, and they have the resources to buy higher-end options.12
Other SES measures, such as race/ethnicity and marital status, show a similar pattern as income. Specifically, White households and married households – who tend to have higher incomes – are more likely to experience unexpected expenses relative to non-White, divorced, or widowed households.13 Beyond the SES measures, we also considered variation in spending by age among the 65+ population. Interestingly, this analysis did not find substantial variation in the likelihood of experiencing shocks.
For those households that do experience an unexpected expense, average annual costs for all shocks for the typical household are $7,100 per year. Broken down by expense type, rainy day costs are $3,300 a year; family-related expenses are $5,700, and health-related costs are $4,100. While these numbers provide some indication of typical costs when shocks occur, they are less helpful for planning purposes because not all households experience these expenses every year. To obtain this more comprehensive measure, we calculate predicted expenses that households would face over their full retirement.
Predicted Unexpected Expenses
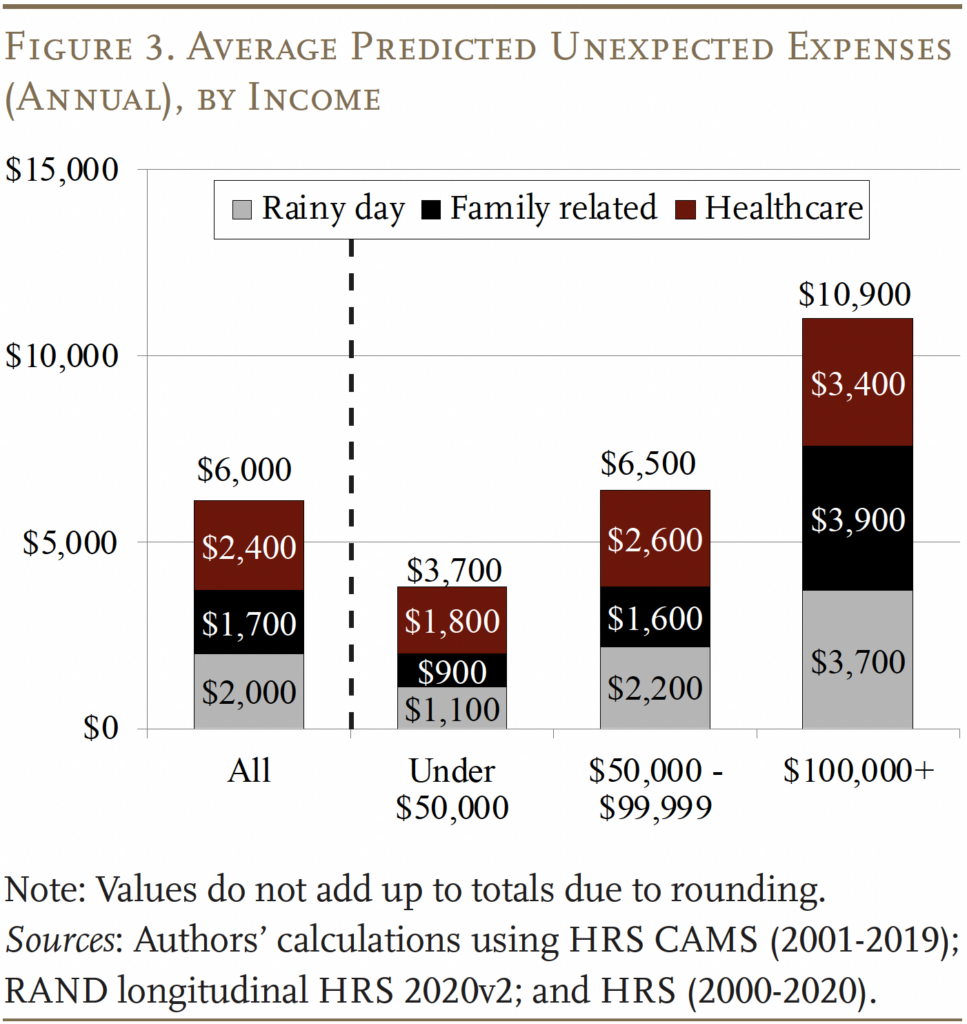
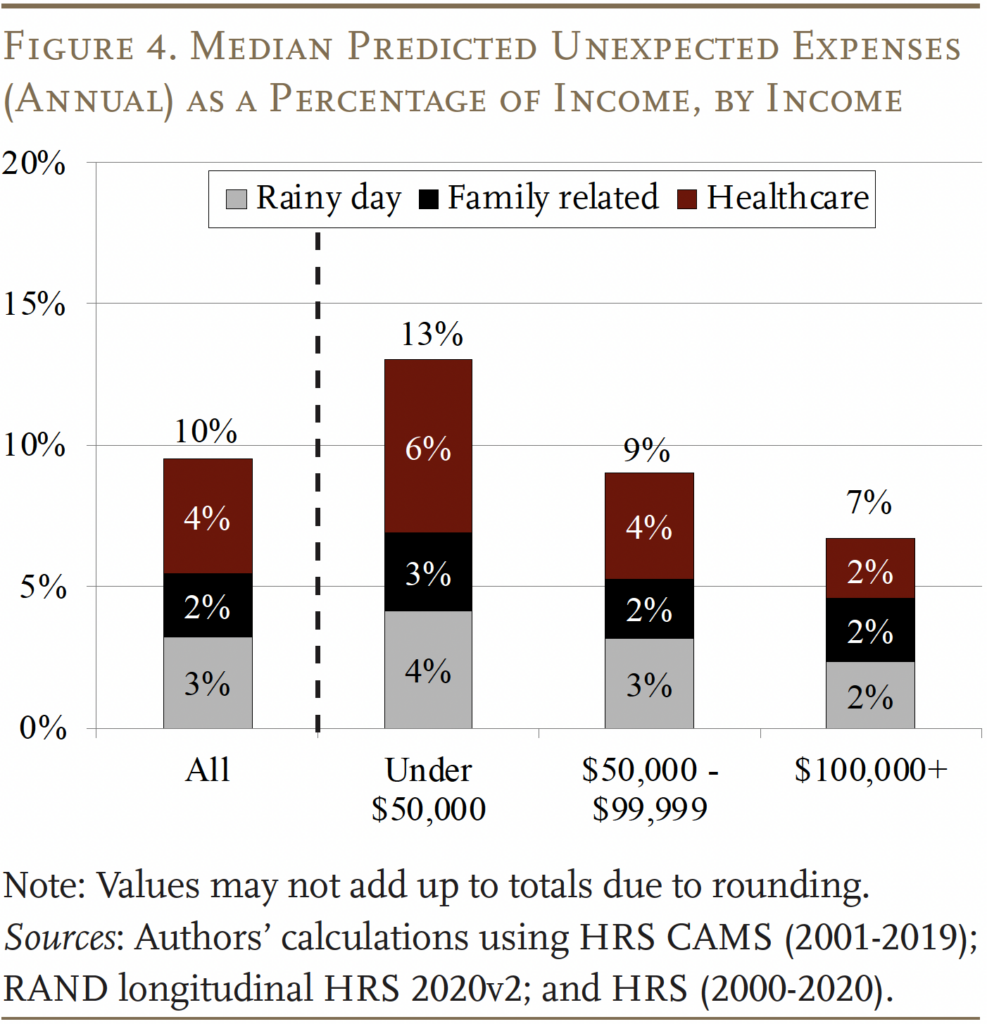
Predicted unexpected expenses can be interpreted as the average annual smoothed expense across all years in retirement. The average for all households is $6,000 (see Figure 3). Healthcare is the largest expense category for the average retired household, and it also varies less by income, likely because households are least likely to defer these costs.14
Although unexpected expenses tend to increase with income, the share of these expenses relative to income tends to decrease for those with higher income. The typical retired household is predicted to spend 10 percent of annual income on unexpected expenses (see Figure 4). These results suggest that retirees should set aside at least 10 percent of their annual income as emergency savings.15 The median older household would therefore need 2.5 years’ worth of retirement income to cover all the unexpected expenses over a 25-year retirement (.10 x 25 = 2.5), although the full amount would not need to be in a liquid account. These estimates are for average unexpected expenses; for an assessment of how often households might face expense shocks that are larger than average, see the full paper.16
Can Households Cover Unexpected Expenses?
The results so far clearly show that unexpected expenses are a real risk for retired households. The key question is whether they are prepared to handle these expenses. We compare our predicted unexpected expenses for a typical year with how much cash and retirement assets older households have on hand. The results are discouraging; only 58 percent of all older households have enough cash to cover their unexpected expenses for just a single year (see Figure 5). An additional 16 percent of households could cover their expense shocks for a year if they also tapped their 401(k)/IRA assets. However, that leaves 27 percent of households unable to cover just one year of unexpected expenses, even after spending all their cash and retirement assets.
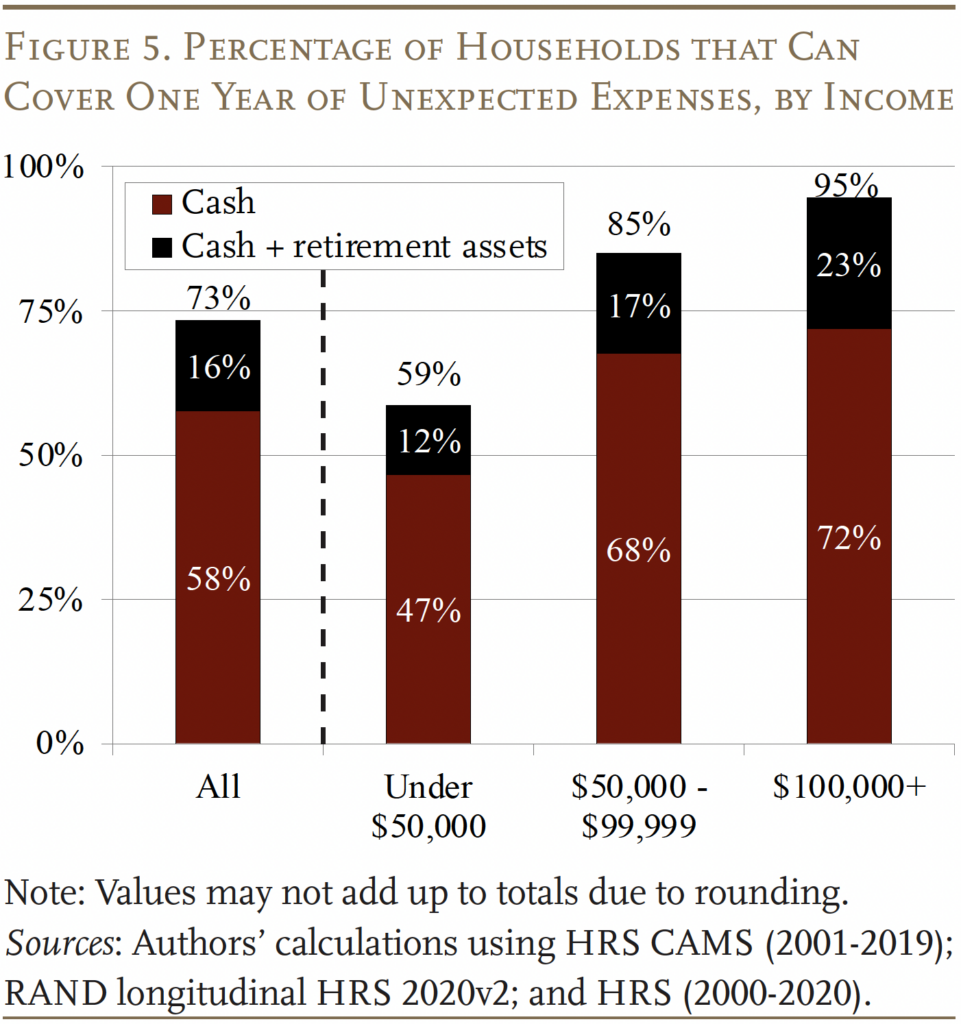
Predictably, the results are more dire for vulnerable SES groups. Only about a third of the lowest-income households have enough cash for unexpected expenses in a given year. The share is similar among Black and Hispanic households and only about half of single female and widowed households have enough cash to cover one year of expense shocks. These households also have limited non-cash assets.
Finally, covering expenses in a single average year is a very low bar for gauging the ability to weather emergency expenses. As shown earlier, households face some unexpected spending in every year. Since retirees have a limited ability to replenish their savings through additional years of working, having as much of these resources as possible at the beginning of retirement is important for their financial security.17
Conclusion
This brief summarizes a comprehensive analysis of emergency spending needs, risks, and preparedness for retired households. The results show that the prevalence of unexpected expenses is widespread for retirees. In a given year, 83 percent of all households will face at least one type of spending shock. And these costs are significant. In an average year, total unexpected expenses equal about 10 percent of annual income for a typical retired household. For planning purposes, then, households should consider having at least 10 percent of their annual income in a relatively liquid emergency savings account. Currently, only 60 percent of households have enough cash to cover this level of unexpected expenses in a typical year, which means they might have to liquidate other assets when shocks occur. The share with enough cash drops to about 33 percent for Black and Hispanic households and 50 percent for single female and widowed households.
Overall, these findings suggest that unexpected expenses could present a significant source of financial stress that many older households may be unprepared to handle. Programs that help delay Social Security claiming, offer access to affordable long-term care insurance and financial advice on draw-down strategies, and increase use of Health Savings Accounts are some of the policies and programs that can help older adults manage unexpected expenses while also ensuring income sufficiency in retirement.
References
De Nardi, Mariacristina, Eric French, and John Bailey Jones. 2010. “Why Do the Elderly Save? The Role of Medical Expenses.” Journal of Political Economy 118(1): 39-75.
De Nardi, Mariacristina, Eric French, and John Bailey Jones. 2016. “Savings after Retirement: A Survey.” Annual Review of Economics 8(1): 177-204.
Fahle, Sean, Kathleen McGarry, and Jonathan Skinner. 2016. “Out-of-Pocket Medical Expenditures in the United States: Evidence from the Health and Retirement Study.” Fiscal Studies 37(3-4): 785-819.
Farrell, Diana, Fiona Greig, and Chenxi Yu. 2019. “Weathering Volatility 2.0: A Monthly Stress Test to Guide Savings.” New York, NY: JP Morgan Chase & Co. Institute.
French, Eric, John Bailey Jones, and Rory McGee. 2023. “Why Do Retired Households Draw down Their Wealth so Slowly?” Journal of Economic Perspectives 37(4): 91-113.
Grinstein-Weiss, Michal and Sam Bufe. 2020. “Financial Shocks and Financial Well-Being: Which Factors Help Build Financial Resiliency in Lower-Income Households?” St. Louis, MO: Washington University in St. Louis.
Health and Retirement Study. 2024. “RAND HRS Longitudinal File 2020 V2 Public Use Dataset.” Produced and Distributed by the University of Michigan with funding from the National Institute on Aging (Grant Number NIA U01AG009740). Ann Arbor, MI.
Hurd and Rohwedder. 2006. “Some Answers to the Retirement-Consumption Puzzle.” Working Paper 12057. Cambridge, MA: National Bureau of Economic Research.
John, David, Mark Iwry, and William G. Gale. 2023. “Enhancing Retirement Wealth and Reducing Retiree Inequality: Emergency Savings Accounts and Other Policy Options.” Social Science Research Network. Rochester, NY. September 1, 2023.
Rao, Manita and Anqi Chen. 2026 (forthcoming). “Impact of Age, Income, and Life Circumstances on Unexpected Expenses in Retirement.” Washington, DC: AARP.
Rappaport, Anna M. 2016. “Retirement Survey Report Key Findings and Issues: 2015 Risks and Process of Retirement Survey.” Schaumburg, IL: Society of Actuaries.
Scott, John. 2017. “Financial Shocks Put Retirement Security at Risk.” Washington, DC: The Pew Charitable Trusts.
The Pew Charitable Trusts. 2017. “Are American Families Becoming More Financially Resilient?” Washington, DC.
University of Michigan. Health and Retirement Study, 2000-2020. Ann Arbor, MI.
University of Michigan. Health and Retirement Study, Consumption and Activities Mail Survey (HRS CAMS), 2001-2019. Ann Arbor, MI.
Endnotes
- Rao and Chen (2026 forthcoming). ↩︎
- See John, Iwry, and Gale (2023) for an overview. ↩︎
- Grinstein-Weiss and Bufe (2020); Scott (2017); and The Pew Charitable Trusts (2017). ↩︎
- See De Nardi, French, and Jones (2010, 2016); Fahle, McGarry, and Skinner (2016); and French, Jones, and McGee (2023). ↩︎
- Rappaport (2016). ↩︎
- The Pew Charitable Trusts (2017). ↩︎
- The Pew Charitable Trusts (2017). See also Rappaport (2016) for findings by socioeconomic group. ↩︎
- While the CAMS was first administered in 2001, consumption categories were not consistent until 2005. ↩︎
- Hurd and Rohwedder (2006) show that the consumption levels are roughly comparable in the CAMS and the U.S. Bureau of Labor Statistics’ Consumer Expenditure Survey. ↩︎
- While some workers continue working after claiming Social Security, earnings typically decline fairly rapidly after claiming. ↩︎
- For more details on the methodology, see Rao and Chen (2026 forthcoming). ↩︎
- Another reason is that income or liquidity constrained households may not simply defer such spending – they may delay or forgo purchases altogether. ↩︎
- Married households are more likely to experience various forms of expense shocks largely because they have a larger household size. Another SES metric – education, which is strongly correlated with income – also shows similar patterns as the others. ↩︎
- The predicted expense for married households is double that for other households simply because married households have more people. By age, predicted expenses are relatively stable, but healthcare spending takes up a slightly larger share of total unexpected expenses as households get older. ↩︎
- These results are consistent with Farrell, Grieg, and Yi (2019). ↩︎
- Rao and Chen (2026 forthcoming). ↩︎
- For details on the more comprehensive analysis of risk and preparedness, see Rao and Chen (2026 forthcoming). ↩︎


Rao, Manita and Anqi Chen. 2026. "How Much Are Emergency Expenses for Retirees and Are They Prepared?" Issue in Brief 26-1. Chestnut Hill, MA: Center for Retirement Research at Boston College.