
How Well Do Household Surveys Measure Retirement Income?

Alicia H. Munnell is a columnist for MarketWatch and senior advisor of the Center for Retirement Research at Boston College.
Pretty well, actually – with the exception of the Current Population Survey (CPS).
A 2017 paper by Adam Bee and Joshua Mitchell re-documented that the Census Bureau’s Current Population Survey (CPS) understates retirement income, renewing concern around the accuracy of income measurements in the CPS. Some have wondered if this problem applies to retirement income estimates in other survey datasets as well – calling into question decades of research that suggest many are ill-prepared for retirement. To assess the quality of retirement income in other surveys, a new study compares estimates from five commonly used national surveys to administrative data from the IRS and the Social Security Administration.
For aficionados, in addition to the CPS, the four other datasets examined are: 1) the Survey of Consumer Finances (SCF); 2) the Health and Retirement Study (HRS); 3) the Panel Survey of Income Dynamics (PSID); and 4) the Survey of Income and Program Participation (SIPP).
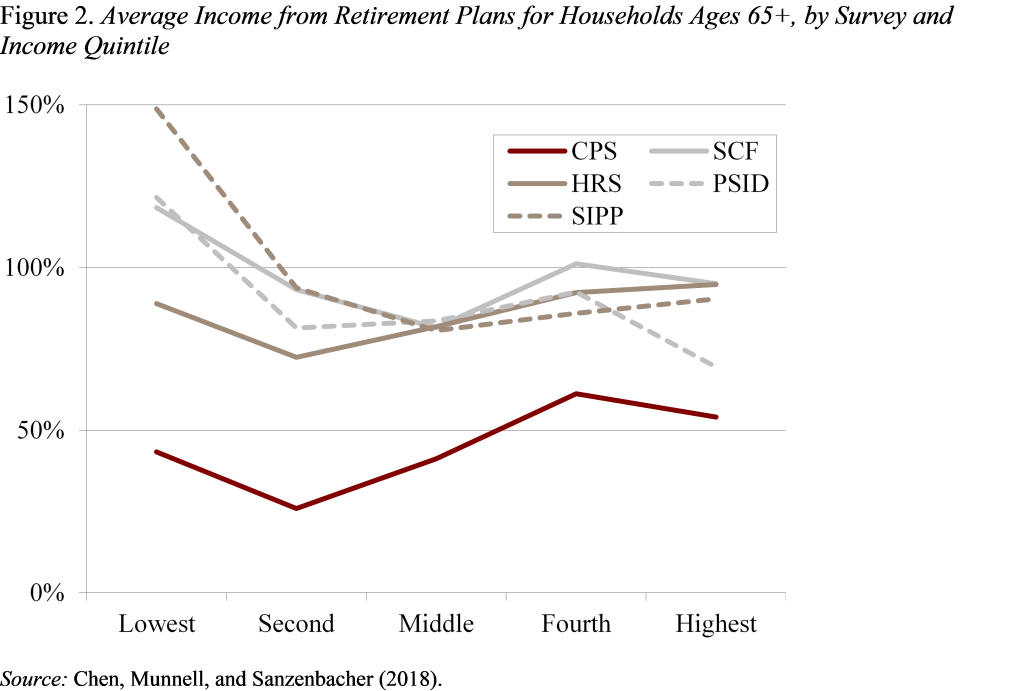
The first comparison looked at the aggregate amounts. As shown in Table 1, the SCF tracks closest to the IRS and SSA administrative data, accounting for 98 percent of retirement income reported by administrative sources. The HRS and SIPP also provide reliable estimates, accounting for 96 percent and 93 percent of administrative aggregates, respectively. The one area these two datasets underreport income is interest and dividends, but these sources represent only a small share of total retirement income. The PSID falls somewhat short of the administrative data. As expected, the CPS underreports income from all sources, especially retirement plans.
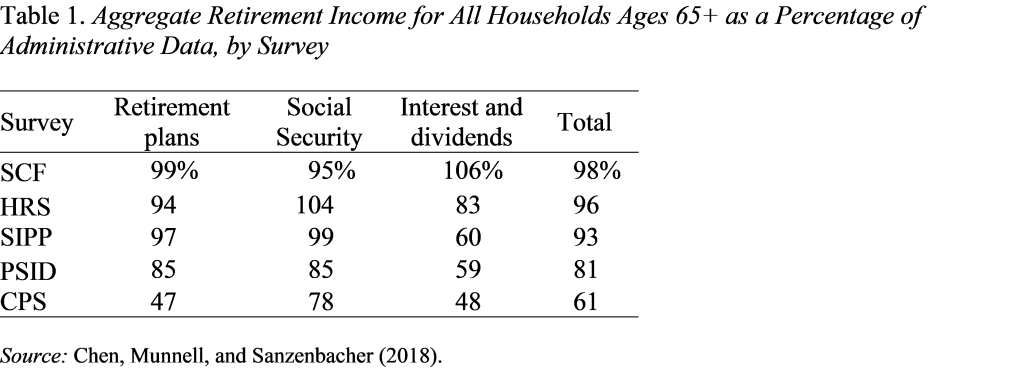
It is also important to understand where in the income distribution reporting shortfalls occur. If, for example, differences across datasets are mainly due to the fact that very high-income households are not represented, then income measurements could still be accurate for the middle and lower quintiles of the distribution. Figures 1 and 2 show survey income relative to administrative data by income group for Social Security and retirement plans. With the exception of the CPS, the surveys do a good job of reporting across the income distribution for both sources.
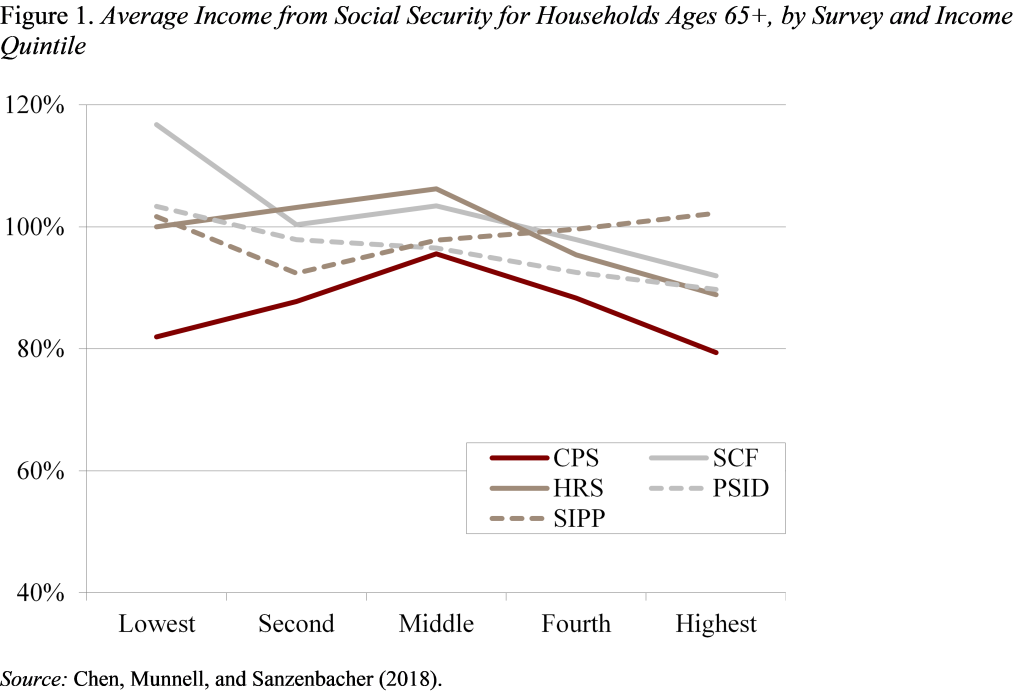
In short, the findings suggest that the most commonly used surveys – such as the SCF, HRS, PSID, and SIPP – provide measures of retirement income that track closely with administrative data, especially in the middle of the distribution. The SCF, HRS, and SIPP, in particular, tend to fit the administrative data throughout the income distribution. More broadly, this study suggests that researchers should feel comfortable using the SCF, HRS, PSID, or SIPP to draw conclusions about retirement income for the typical older household. Concerns about the CPS are well-placed, but fortunately this survey is an outlier.