
Is the Retirement Picture for Millennials Looking Better?

The brief’s key findings are:
- Millennials started their careers in weak labor markets, so initially they lagged behind Late Boomers and Gen Xers at the same ages in life events and wealth.
- Strikingly, data for 2022 show a big reversal: Millennials had caught up on most indicators, and they surpassed earlier cohorts in wealth accumulation.
- The main reason was a huge runup in housing wealth, which soared during COVID, but gains in financial wealth also boosted balance sheets.
- It’s not clear, however, what this good news means for retirement security, since house prices may reverse and few retirees tap their equity for consumption.
Introduction
The release of the Federal Reserve’s 2022 Survey of Consumer Finances offers a chance to catch up on the retirement saving of Millennials – those born during 1981-1999. This group, despite being more educated than earlier cohorts, faced early challenges, as many left school with large student loans and began their careers in the tough job market following the bursting of the dot.com bubble and the Great Recession. These factors delayed major life milestones, such as getting married and owning a home, and limited their ability to accumulate wealth. Our initial 2016 snapshot showed Millennials way behind earlier cohorts, at the same ages, on every dimension.1
Our next check-in with Millennials was 2019.2 After three years of a strong economy just prior to the pandemic, this cohort had caught up in many ways: they had similar homeownership and marriage rates, labor force participation, and earnings. However, they were still behind earlier cohorts in retirement readiness – measured by the net worth-to-income ratio – primarily due to high levels of student loans.
Since 2019, the nation has experienced a global pandemic and economic disruption. At the same time, the government provided unprecedented fiscal support, employment remained strong, home values rose substantially, and the stock market – even with the drop in 2022 – ended up significantly higher than in 2019. The question addressed in this brief is how all these factors affected the retirement preparedness of Millennials.
The discussion proceeds as follows. The first section defines Millennials and the earlier generations that are used as a basis for comparison. The second section presents wealth-to-income ratios from the Survey of Consumer Finances for Millennials, Gen-Xers, and Late Boomers, showing that by 2022 Millennials are outpacing earlier cohorts. The third section explores the reasons for this reversal – primarily the increase in house prices but also gains in financial assets due to increased saving and a strong stock market. The fourth section concludes that while Millennials’ balance sheets now look robust compared to those of earlier cohorts at the same ages, the bulk of the gain comes from housing and it is unclear the extent to which housing equity should be counted as “retirement saving.”
Defining the Exercise
Journalists and social scientists often give names to generations who grew up in similar circumstances. Those who lived through the Great Depression and fought in World War II have been characterized as the “Greatest Generation,” and those who came after – born in the 1920s to mid-1940s – the Silent Generation. With the sharp uptick in fertility rates after World War II, those born from the mid-1940s to mid-1960s were called Baby Boomers. Generation X – those born in the mid-1960s and 1970s – followed. The Millennial Generation (also called Generation Y) consists of Americans born during the 1980s and 1990s. Figure 1 shows how the current U.S. population breaks down by age cohort and birth year.
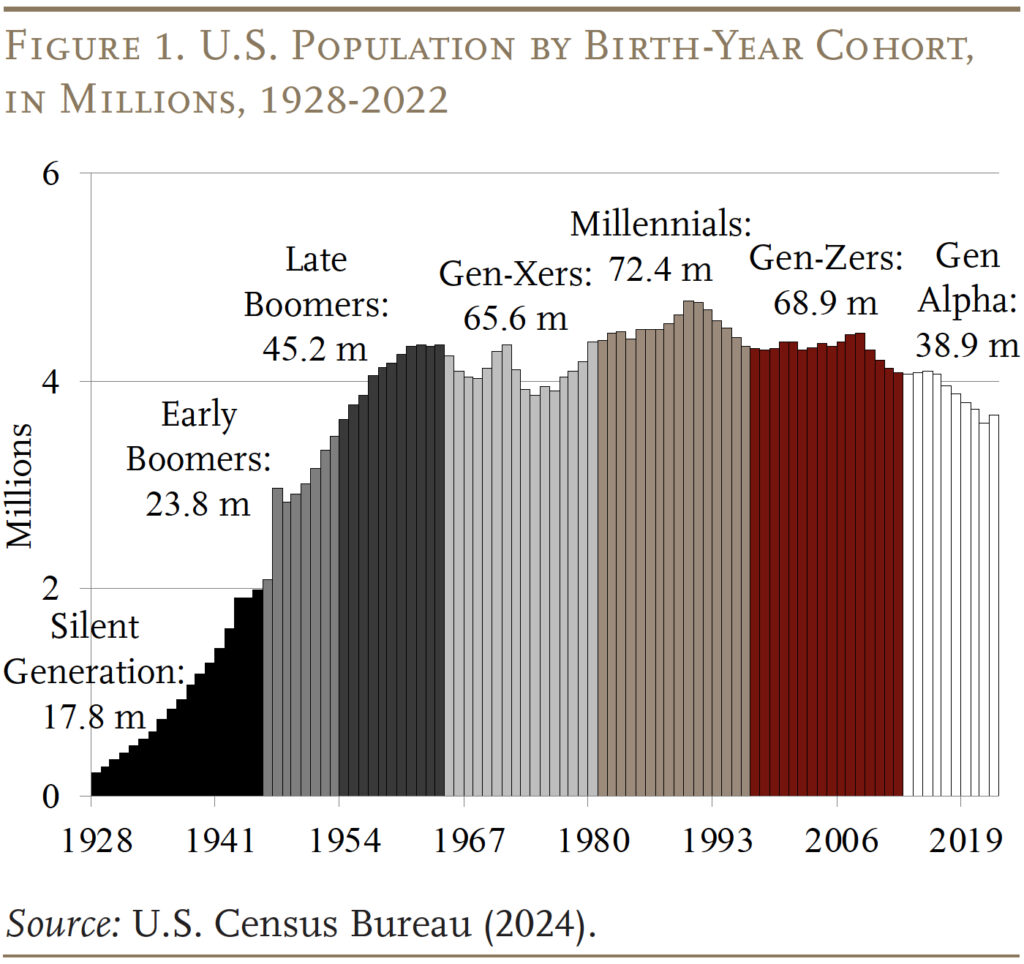
The focus here, and in our prior series, is on the segment of Millennials who were ages 31-41 in 2022, which means those born from 1981-91. These individuals are compared to Gen-Xers and Late Boomers when they were the same ages. The Gen-Xers were the same ages in 2010 (which covers those born from 1969-79), and the Late Boomers were the same ages in 1995 (which covers those born from 1954-64).
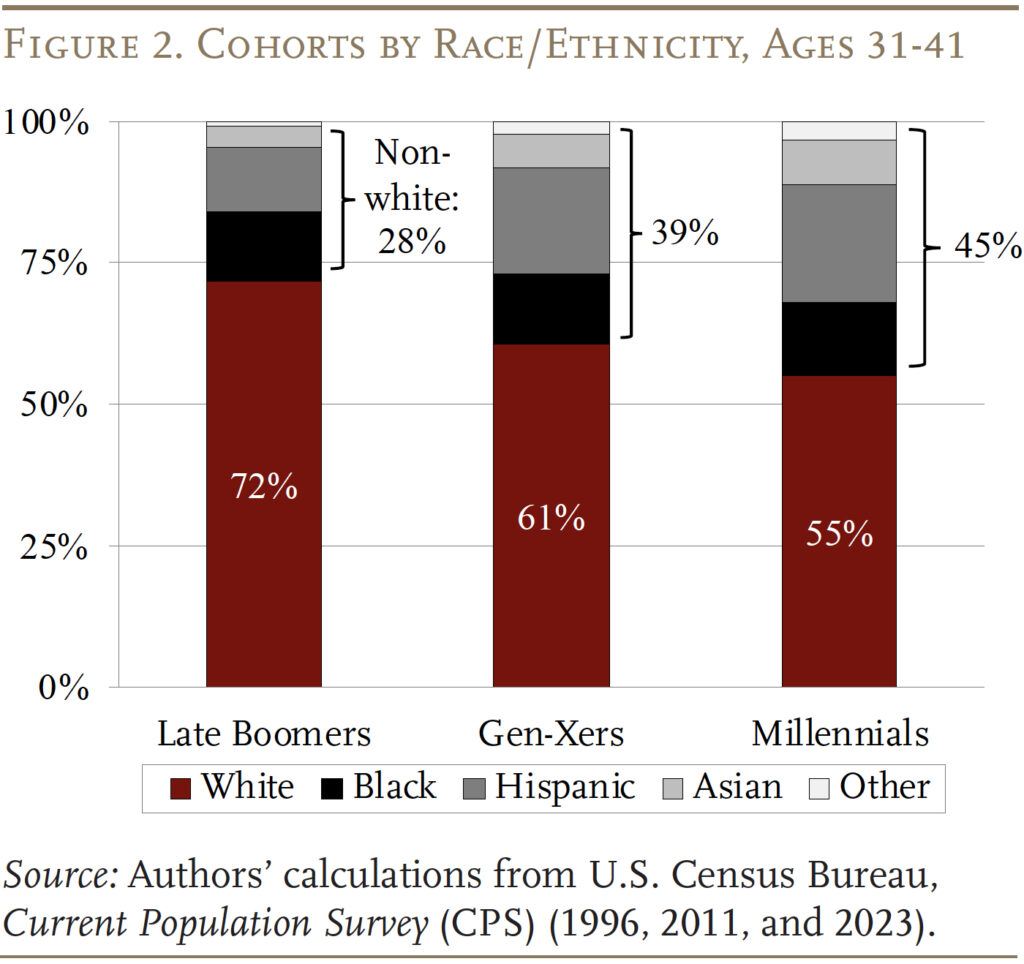
Millennials are unique in a number of ways. They were the first full generation to grow up with computers. Social scientists tend to characterize them as self-confident and optimistic since their parents tended to be attentive and supportive.3 They are also more ethnically diverse than previous cohorts; as shown in Figure 2, the share of Whites declined from 72 percent of Late Boomers to 55 percent of Millennials.
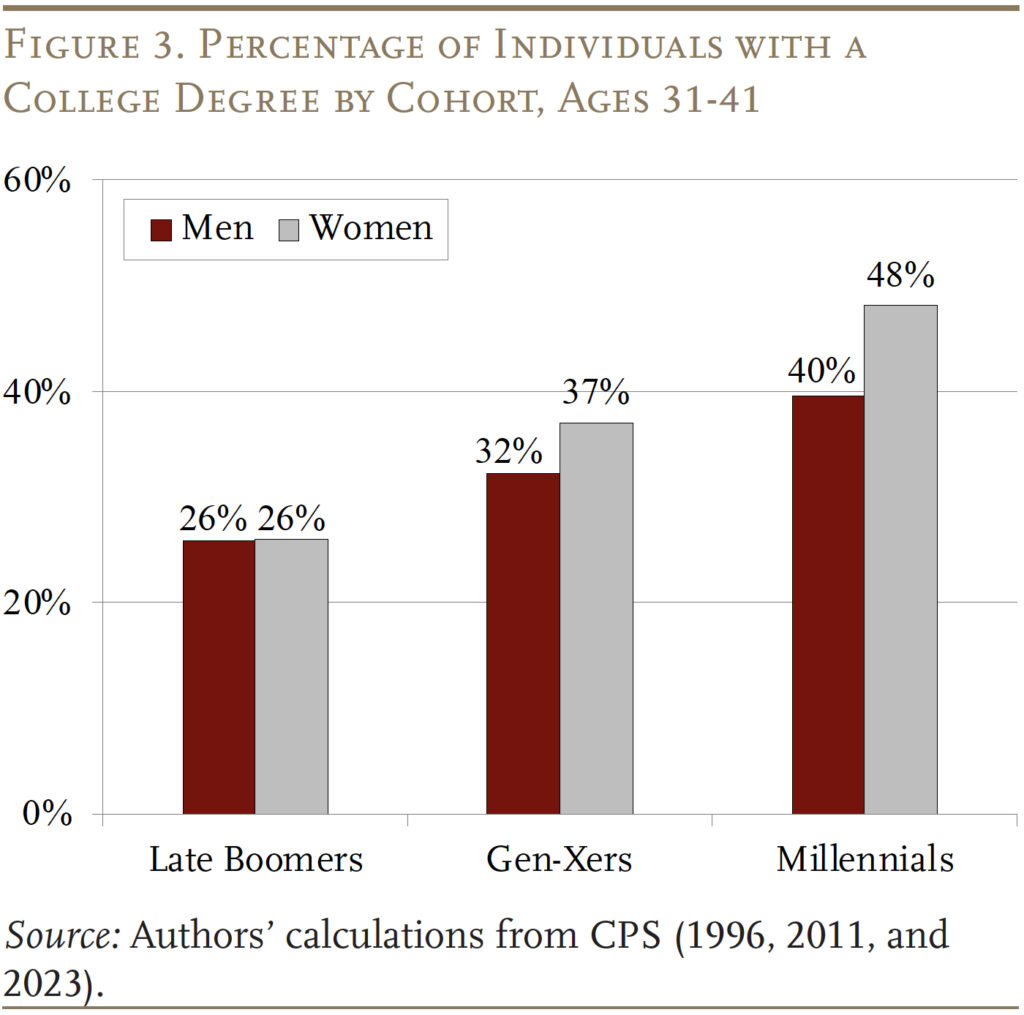
Millennials are also more educated than previous cohorts, with almost half of women and 40 percent of men having a college degree, compared to only a quarter of Late Boomers and a third of Gen-Xers (see Figure 3). One would expect that this higher level of education would bode well for work, earnings, and wealth accumulation.
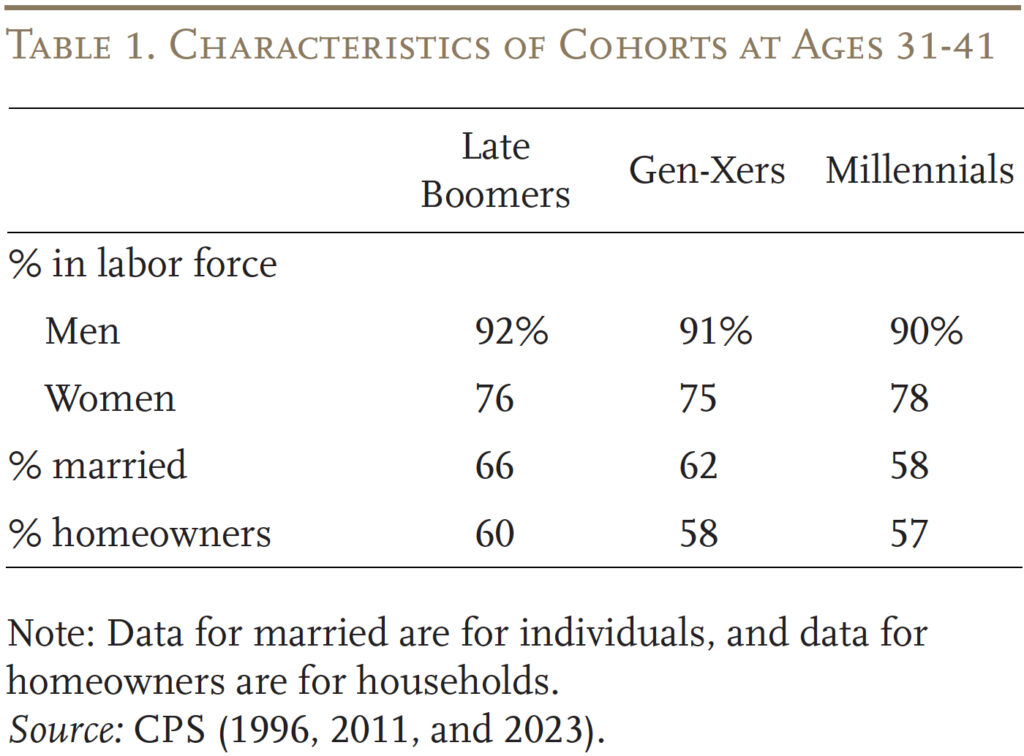
Unfortunately, as noted, Millennials entered the labor market during tough times.4 The group examined here turned 21 between 2002 and 2012, which meant that they were coming out of school during a period that included the bursting of the dot.com bubble and the Great Recession. This experience was particularly hard on Millennial men, who had labor force participation rates below those in earlier cohorts.
Consistent with the 2019 update, data for 2022 show that virtually all the earlier shortfall between Millennials and earlier cohorts in labor market activity, marriage, and homeownership has disappeared (see Table 1). Against this background, the key question is what has happened to the wealth of Millennials during and after the pandemic and how they now compare to earlier generations when they were the same age.
Wealth Holdings by Cohort
In 2019, pre-pandemic, despite the fact that Millennials had caught up on many metrics, their wealth holdings still lagged substantially behind the accumulations of earlier cohorts, largely due to their high levels of student loans. The low wealth of Millennials has been a source of serious concern given that they will live longer – and need to support more years of retirement than previous cohorts – and that, with the increase in Social Security’s Full Retirement Age to 67, they will receive lower benefits relative to pre-retirement income than earlier cohorts.
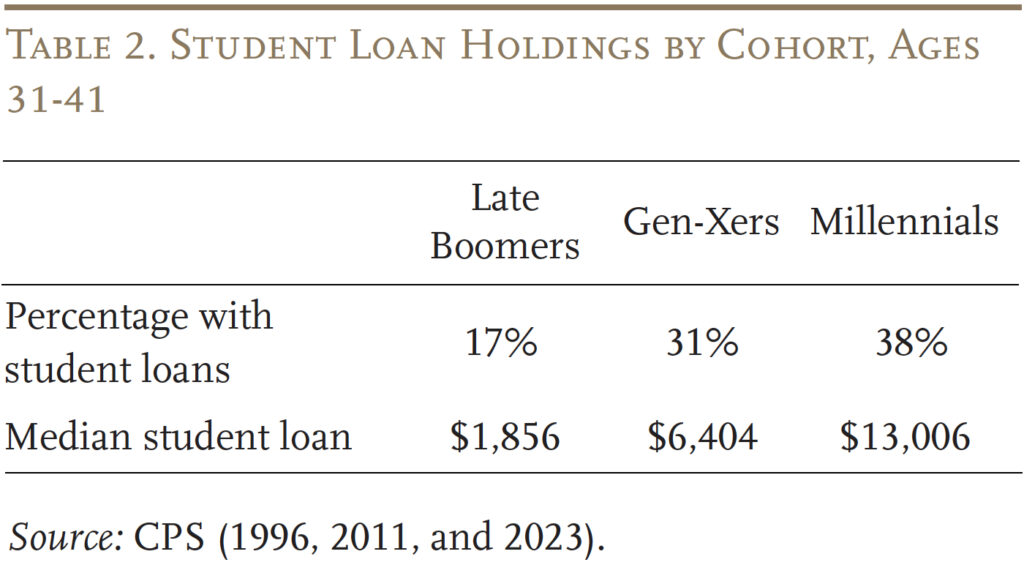
Data for 2022, however, show a dramatic reversal in the fortunes of Millennials (see Figure 4).5 The first group of bars show the wealth-to-income ratios for those ages 28-38 in each cohort, at which point Millennials were behind. Three years later, in 2022, when this group was 31-41, the pattern had dramatically reversed, with Millennials pulling way ahead of earlier cohorts. While Millennials are still more likely to have student debt and the value of their debt is higher (see Table 2), clearly other factors have more than compensated for that burden.
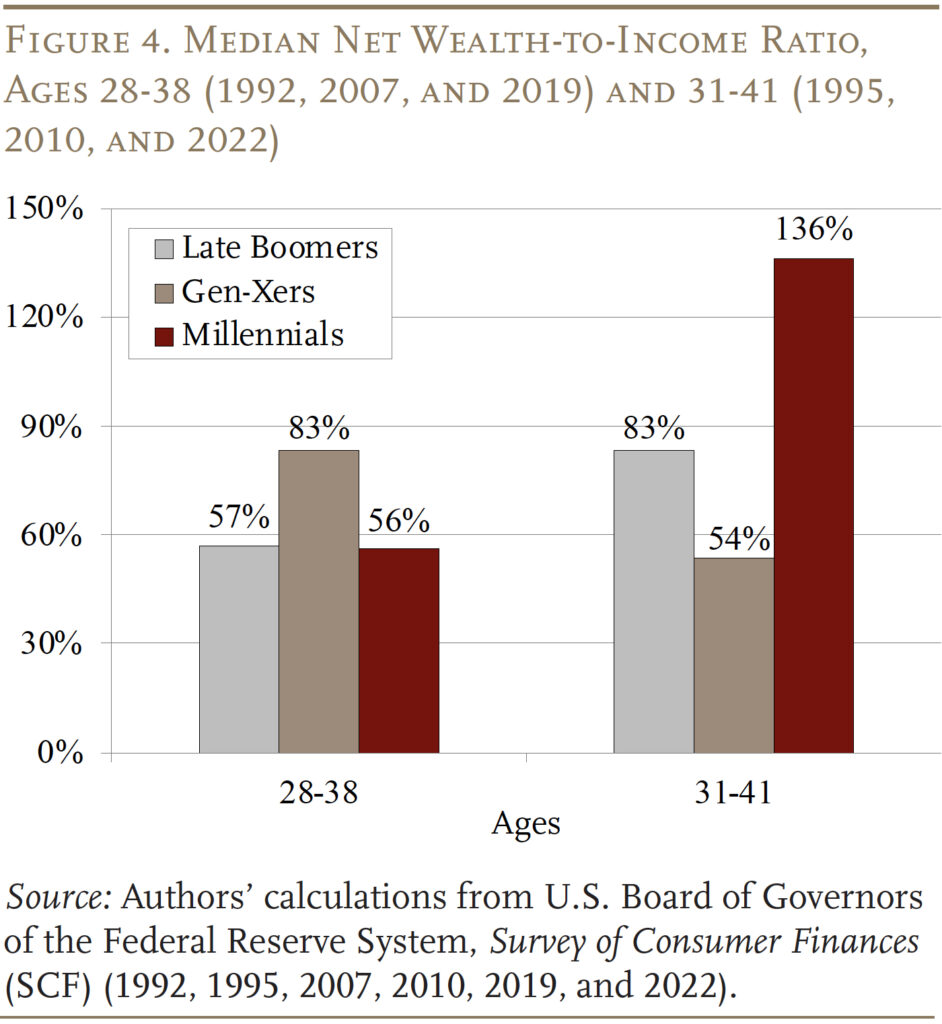
The relative gains of Millennials in wealth-to-income ratios need to be interpreted with some caution. First, the success relative to Gen-Xers is a little exaggerated because Gen-Xers were 31-41 in 2010, when equity and house prices had been battered by the Great Recession. Second, the wealth measure used in this analysis excludes two major sources of retirement wealth: Social Security and defined benefit pensions – both of which were larger for earlier cohorts.
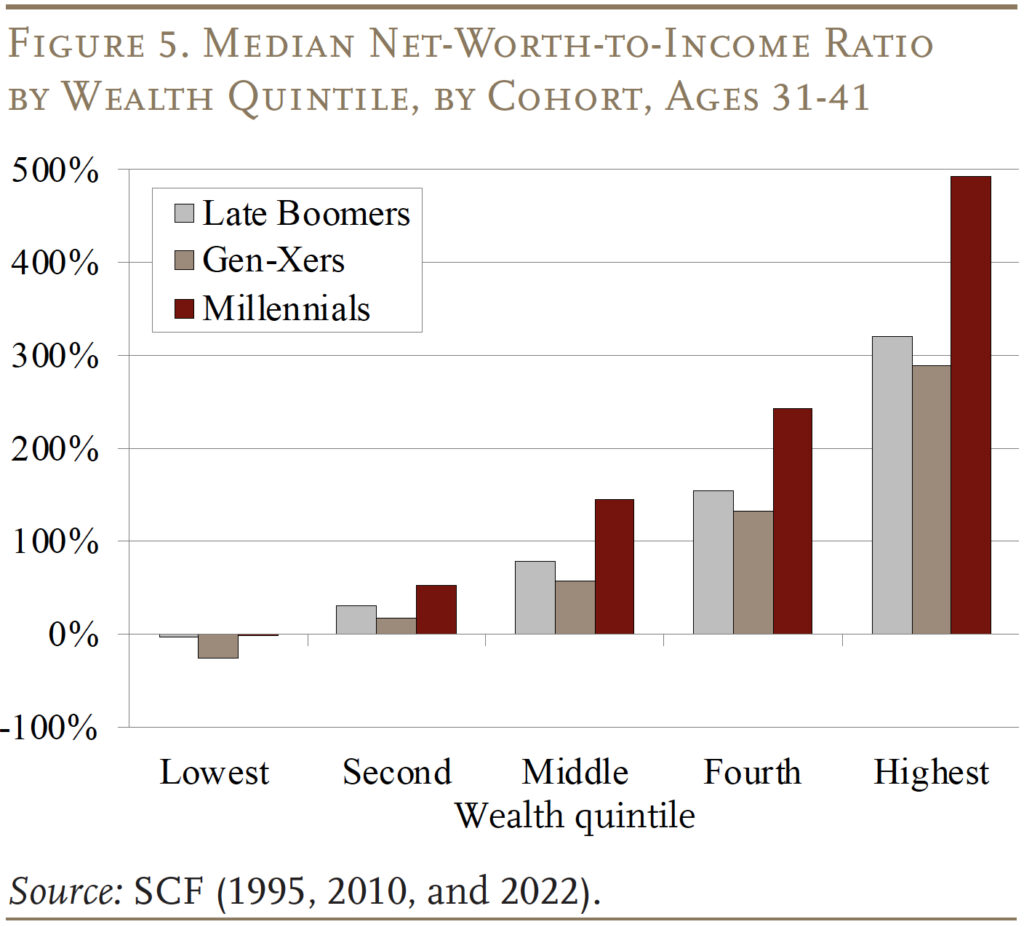
On a more positive note, the improvement in wealth holdings among Millennials was not just concentrated among the wealthy, but rather occurred across the whole wealth distribution (see Figure 5). Strikingly, Millennials in each wealth group are better off.
Source of the Improvement
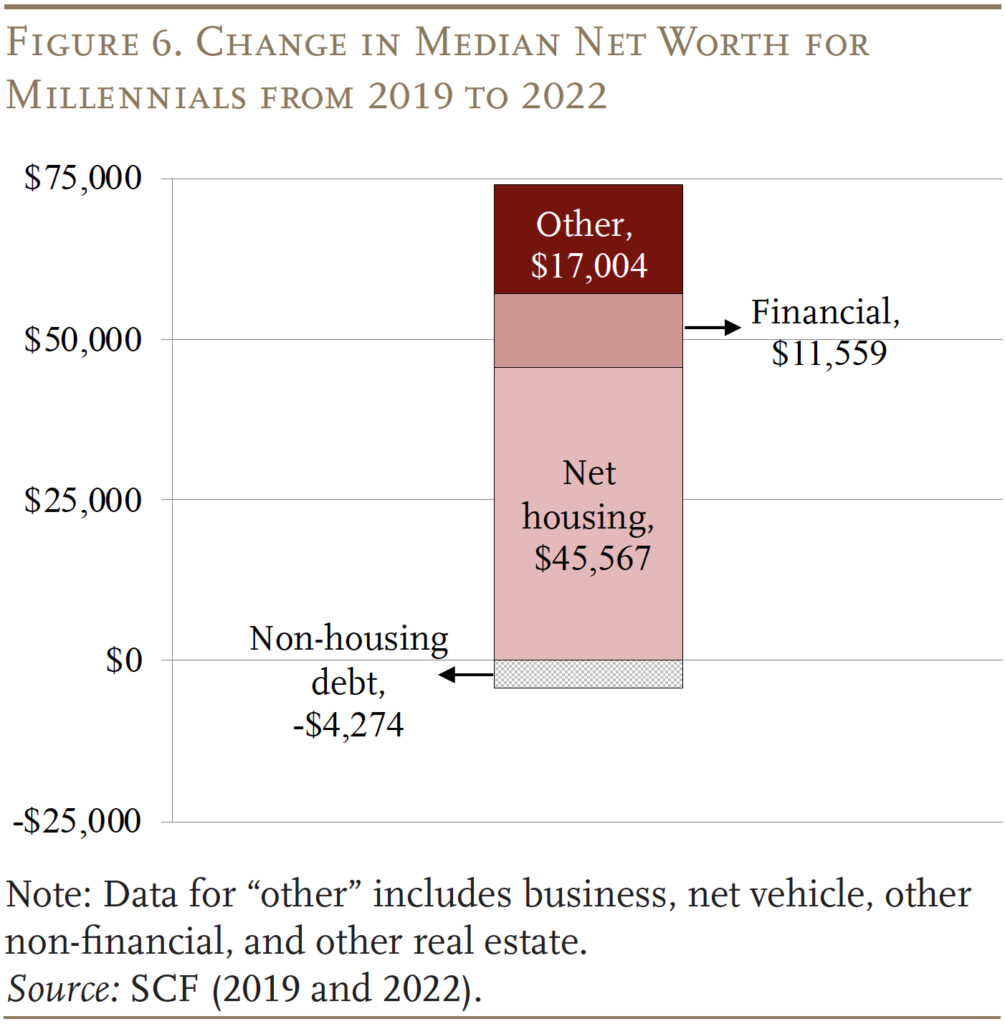
Why did Millennials pull ahead? Figure 6 breaks down the source of the increase in median net worth ($72,280) by component. Most of the wealth gain – 63 percent – has come through housing, but financial assets have also increased.
Housing Wealth
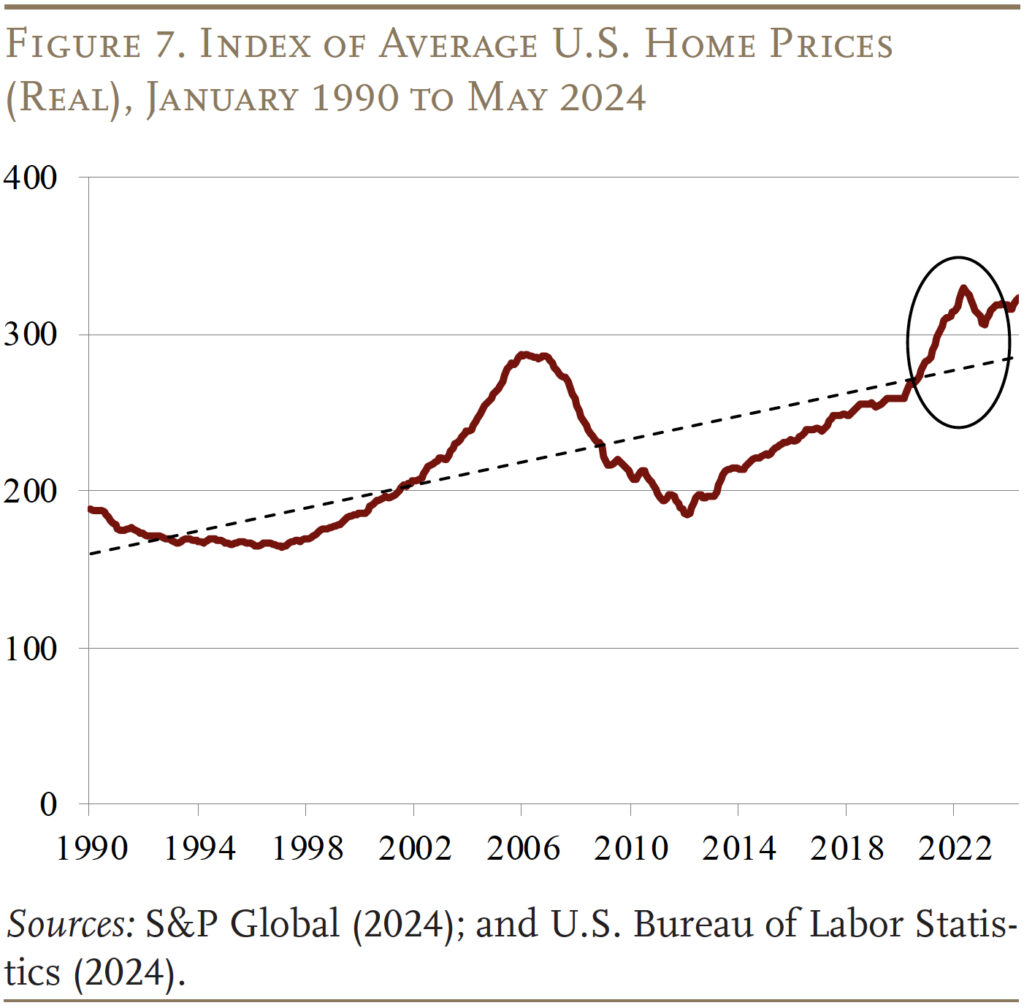
The increase in housing wealth reflects the dramatic increase in house prices that occurred during the pandemic (see Figure 7). When thinking about retirement saving, however, it is not clear how to assess housing wealth. The house is an illiquid asset, and few people take advantage of their home equity to support their consumption in retirement.6 Rather they tend to hold their housing equity in reserve to cover any long-term care needs toward the end of life or to leave as a bequest to their children. Moreover, current home prices are about 16 percent above their trend over the last 30 years and may well revert back to the trend over time.
Not all Millennials have enjoyed the pandemic housing market boom. Millennial renters pay a higher share of income for housing costs than prior generations, and the expensive housing market may mean they will have a harder time becoming homeowners and enjoying future gains in the housing market.
Financial Wealth
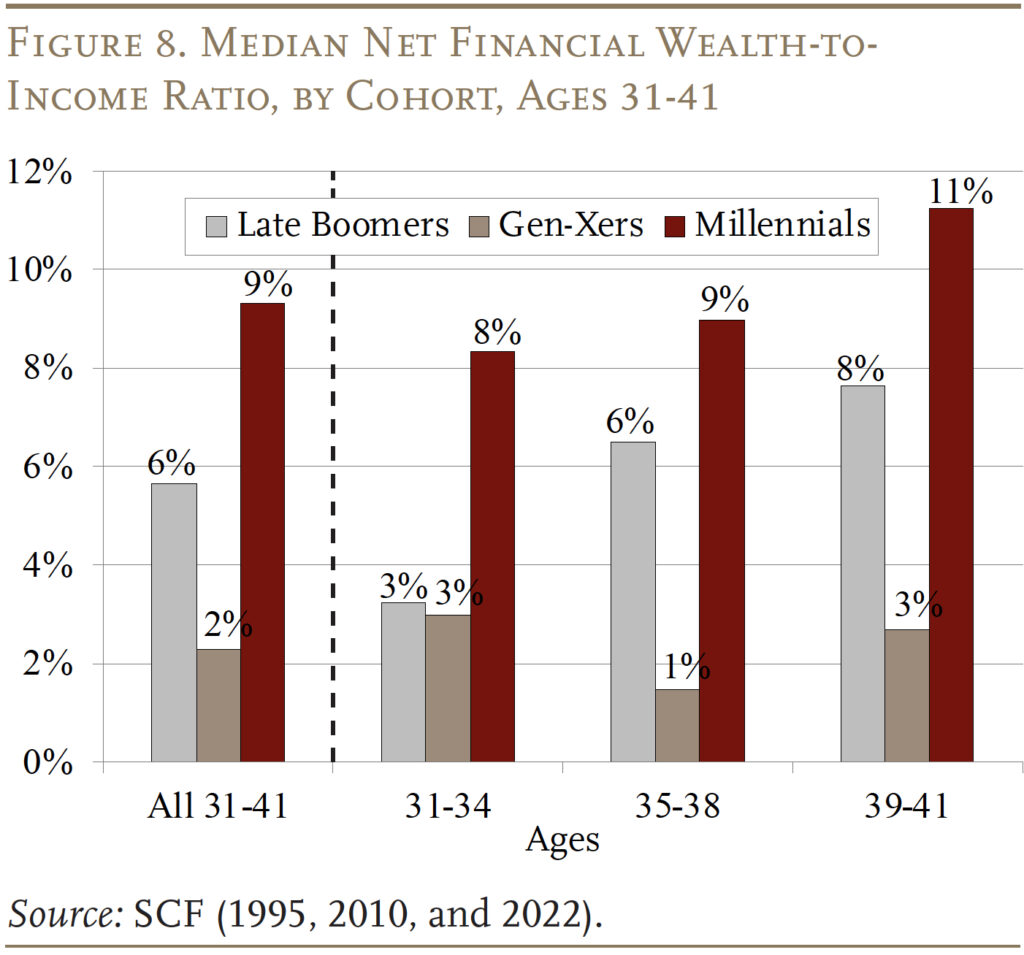
Even though housing wealth is the main reason Millennials are doing comparatively better than older cohorts, they are also ahead on financial assets (see Figure 8). This improvement reflects both increased saving and a run-up in equity prices.
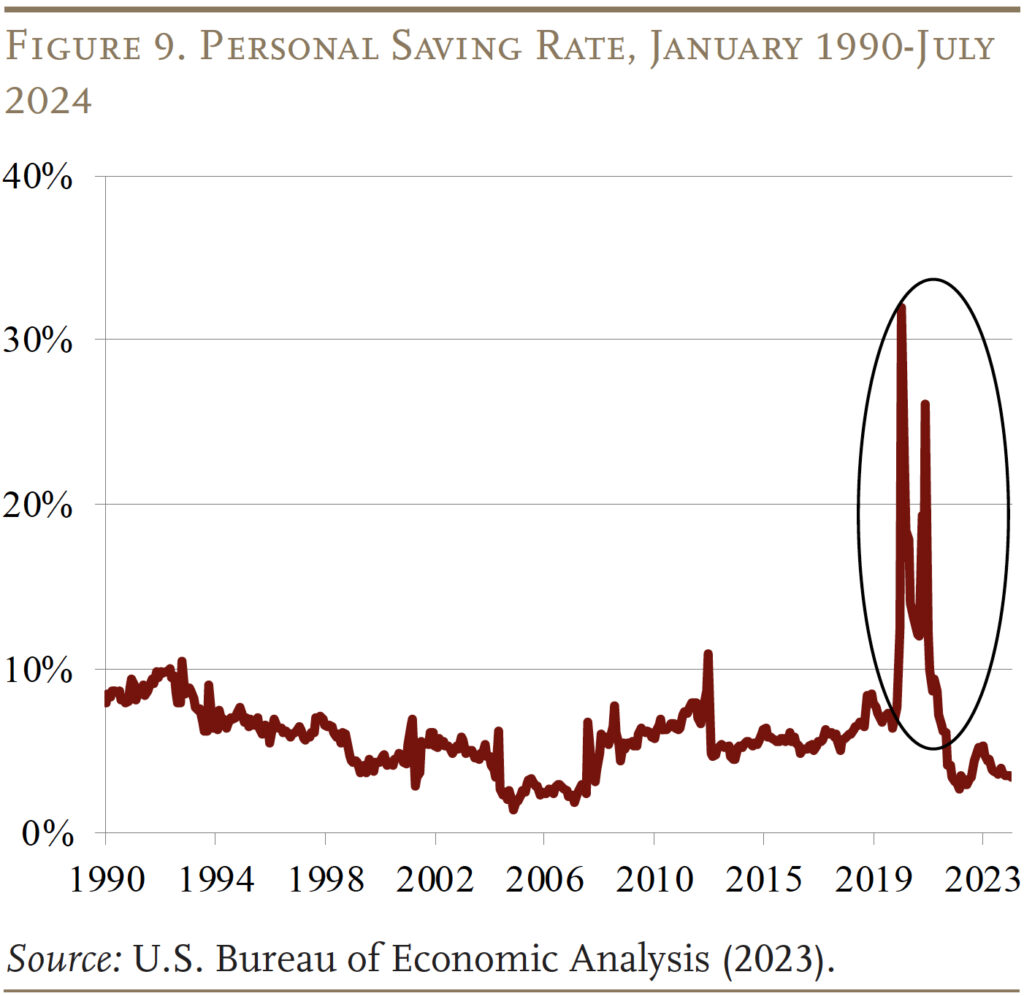
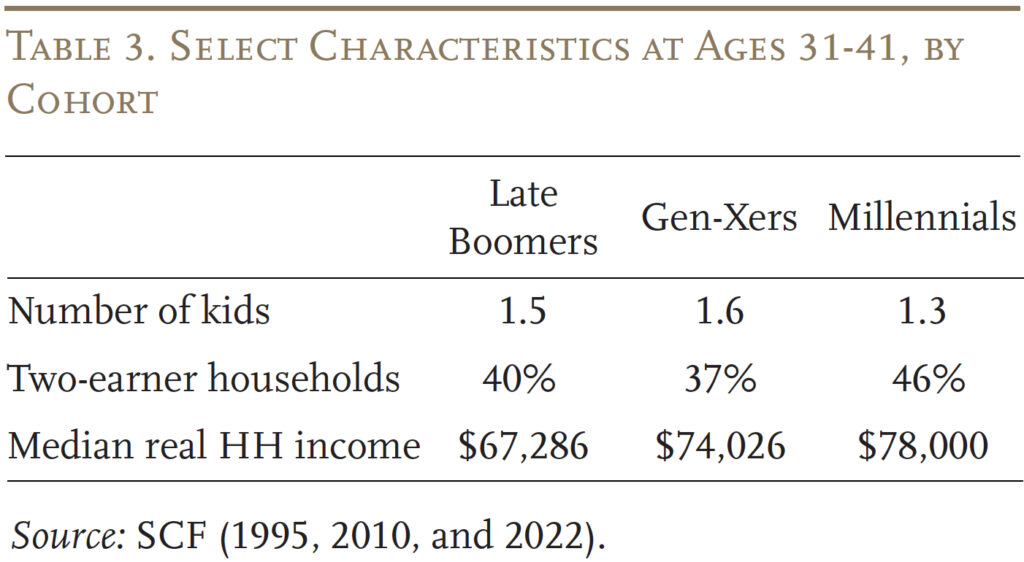
Fueled by the federal stimulus spending and student loan pause, personal savings jumped to over 30 percent during the first two years of the pandemic (see Figure 9). All households, including the Millennials, were able to build up savings and make their balance sheets stronger. Millennials, however, are more likely to be in two-earner households, have higher household incomes, and fewer kids – all of which provides more room for savings on top of stimulus checks (see Table 3).
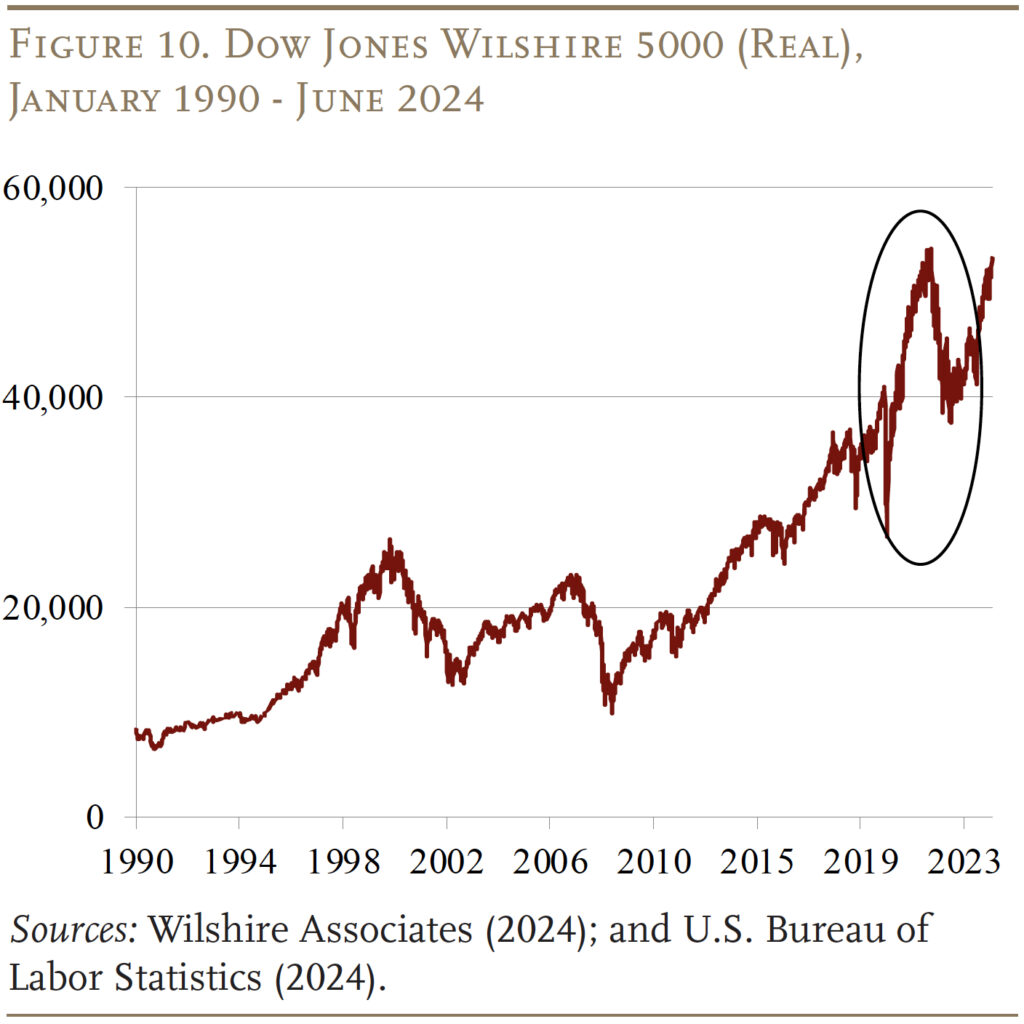
Similarly, while all cohorts benefit from a rising stock market, Millennials are also more likely to invest in stocks. Over 60 percent of Millennials hold some equities, mainly in their retirement accounts, compared to 48 percent of Gen Xers and 37 percent of Late Boomers at the same ages. Additionally, close to a quarter of Millennial households hold stocks outside of their retirement accounts – roughly twice the share of earlier cohorts.7 As a result of their broad holdings in equities, they were well-situated to benefit from a strong stock market (see Figure 10).
Conclusion
Millennials now have more net wealth relative to income in their 30s than Gen Xers and Late Boomers had, despite still having more student debt. Most of the improvement in their balance sheets is due to the rapid increase in housing prices during the pandemic. They also have higher non-housing wealth as well, thanks to increased saving and being positioned to profit from a strong stock market.
Despite all the improvements, the good fortune of the Millennials relies primarily on housing. The house is an illiquid asset, and few people take advantage of their home equity to support their consumption in retirement. Hence, it is not clear the extent to which housing equity should be counted as retirement saving.
References
Chen, Anqi and Alicia H. Munnell. 2021. “Millennials’ Readiness for Retirement.” Issue in Brief 21-3. Chestnut Hill, MA: Center for Retirement Research at Boston College.
Harris, Malcolm. 2017. Kids These Days: Human Capital and the Making of Millennials. Boston, MA: Little, Brown and Company.
Hernandez Kent, Ana and Lowell R. Ricketts. 2024. “Millennials and Older Gen Zers Made Significant Wealth Gains in 2022.” On the Economy Blog (February 24). St. Louis, MO: Federal Reserve Bank of St. Louis.
Johnson, Richard W. and Karen E. Smith. 2024. “How Gloomy is the Retirement Outlook for Millennials?” In Real-World Shocks and Retirement System Resiliency, edited by Olivia S. Mitchell, John Sabelhaus, and Stephen Utkus. New York, NY: Oxford University Press.
Howe, Neil and William Strauss. 2000. Millennials Rising: The Next Great Generation. New York, NY: Vintage Books.
Munnell, Alicia H. and Wenliang Hou. 2018. “Will Millennials Be Ready for Retirement?” Issue in Brief 18-2. Chestnut Hill, MA: Center for Retirement Research at Boston College.
Pinsker, Joe and Veronica Dagher. 2024. “The Dramatic Turnaround in Millennials’ Finances.” (August 13). New York, NY: The Wall Street Journal.
S&P Global. 2024. “S&P CoreLogic Case-Shiller U.S. National Home Price NSA Index.” New York, NY: S&P Dow Jones Indices.
Tolentino, Jia. 2017. “Where Millennials Come From.” (December 4). New York, NY: The New Yorker.
Twenge, Jean M. 2014. Generation Me-Revised and Updated: Why Today’s Young Americans Are More Confident, Assertive, Entitled – and More Miserable Than Ever Before. New York, NY: Simon and Schuster.
U.S. Board of Governors of the Federal Reserve System. Survey of Consumer Finances, 1992, 1995, 2007, 2010, 2019, and 2022. Washington, DC.
U.S. Bureau of Economic Analysis. 2024. “Personal Saving Rate Data (accessed from FRED database).” Washington, DC.
U.S. Bureau of Labor Statistics. 2024. “Consumer Price Index.” Washington, DC.
U.S. Census Bureau. Current Population Survey, 1996, 2011, and 2023. Washington, DC.
U.S. Census Bureau. 2024. “National Population by Characteristics: 2020-2023.” Washington, DC.
Wilshire Associates. 2024. “Dow Jones Wilshire 5000 (Full Cap) Price Levels Since Inception.” Santa Monica, CA. Data for Nominal Dollar Levels.
Endnotes
- Munnell and Hou (2018). ↩︎
- Chen and Munnell (2021). ↩︎
- For details on the factors shaping Millennials, see Harris (2017), Twenge (2014), and Howe and Strauss (2000). ↩︎
- See, for example, Tolentino (2017). ↩︎
- Also see Hernandez Kent and Ricketts (2024) and Pinsker and Dagher (2024). ↩︎
- Millennials also face more risks and a longer life expectancy. When excluding housing wealth, Johnson and Smith (2024) find that a higher share of Millennials are financially insecure in retirement. ↩︎
- Twenty-two percent of Millennials held equities outside of retirement accounts, compared with 11 percent of Gen-Xers and 12 percent of Late Boomers. ↩︎


Chen, Anqi, Nilufer Gok, and Alicia H. Munnell. 2024. "Is the Retirement Picture for Millennials Looking Better?" Issue in Brief 24-18. Chestnut Hill, MA: Center for Retirement Research at Boston College.