
Older Workers Have Gone Back to Work at an Amazing Pace

Alicia H. Munnell is a columnist for MarketWatch and senior advisor of the Center for Retirement Research at Boston College.
They are not the source of the labor shortage, don’t look to them to solve the problem.
I think I’ve got it at last. This whole topic drives me crazy. I think I and my colleagues have been too cute trying to follow older people in their job transitions. These exercises have led to the conclusion that older people are responsible for the labor shortage. That is simply not right.
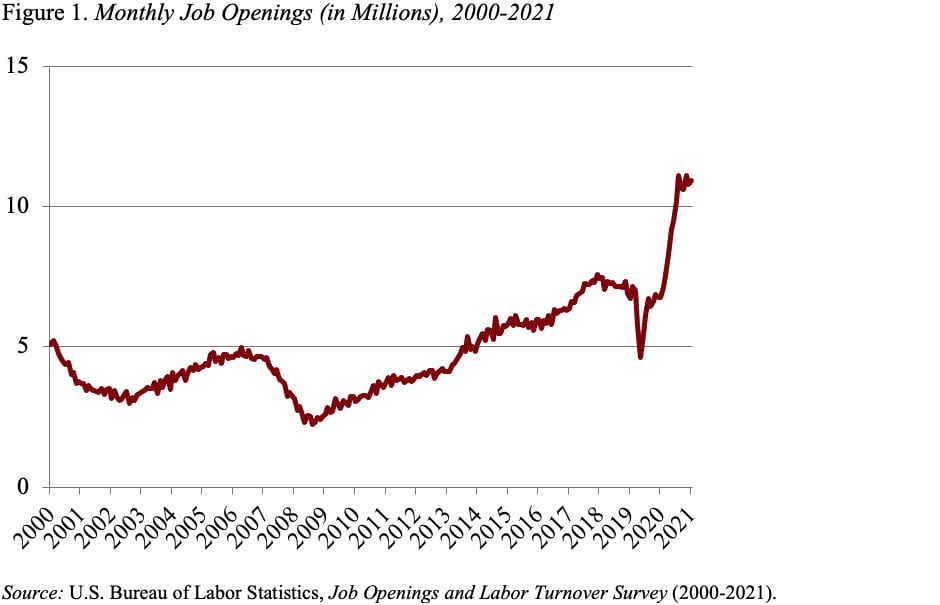
Let’s start with quantifying how many workers we are short. Usually, the number of job openings has fluctuated between 2.5 and 5 million; then they grew to 7.5 million as the economy expanded just prior to the pandemic (see Figure 1). So, I’m going to say our base level of job openings is 5 million. Today, we have 11 million jobs open each month. Therefore, we are short 6 million workers. Who’s not working?
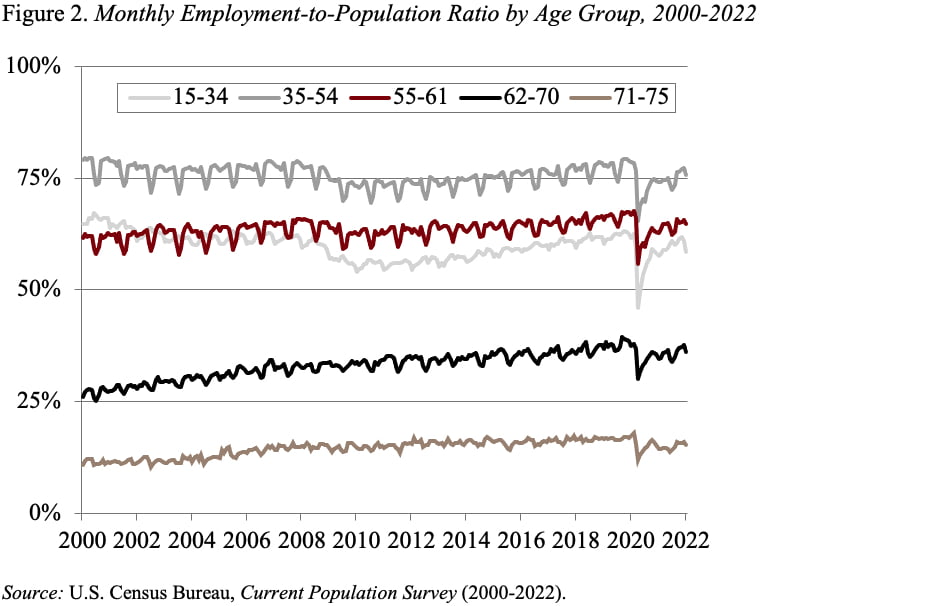
To answer that question, let’s begin with the employment-to-population ratio by age group. Nothing fancy – simply what percentage of the population of a given age is working. Basically, these numbers wiggle around a bit, plunged with COVID, and appear to have rebounded substantially (see Figure 2). For example, for those ages 62-70, 37.4 percent were employed in January 2020, that percentage dipped to 30 percent in April 2020, but rebounded to 36 percent in January 2022. The point is most have gone back to work, but yes, the percentage employed is 1.4 percentage points less than pre-COVID. Similar calculations can be done for each age group.
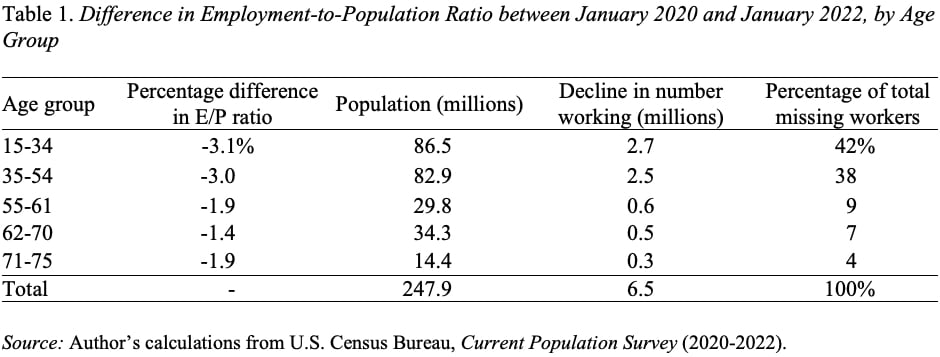
These calculations are shown in the first column of Table 1. First, note that the 1.4 percent shown for those 62-70 is the lowest for any age group. Then consider how many people are in each age group. Not very many are ages 62-70 compared to younger groups. This means that when the percentage shortfall in the employment-to-population ratio is multiplied by the population, only 0.5 million people 62-70 are not working at their pre-COVID levels. In fact, as shown in the last column of Table 1, this older group accounts for only 7 percent of the total 6 million labor shortage.
The bottom line is that older workers have gone back to work. They are not the source of the problem. It seems silly to look to them to solve it.