Public Pension Funded Levels Improve Amidst Rising Interest Rates

The brief’s key findings are:
- Since 2019, financial markets have seen unusual turmoil, most recently a sharp rise in interest rates to curb high inflation.
- Despite volatile asset values, the funded status of state and local pension plans has risen about 2 percentage points since 2023, and 5 points since 2019.
- That is, the strong performance of other asset classes has more than offset the impact of rising interest rates on fixed-income assets.
Introduction
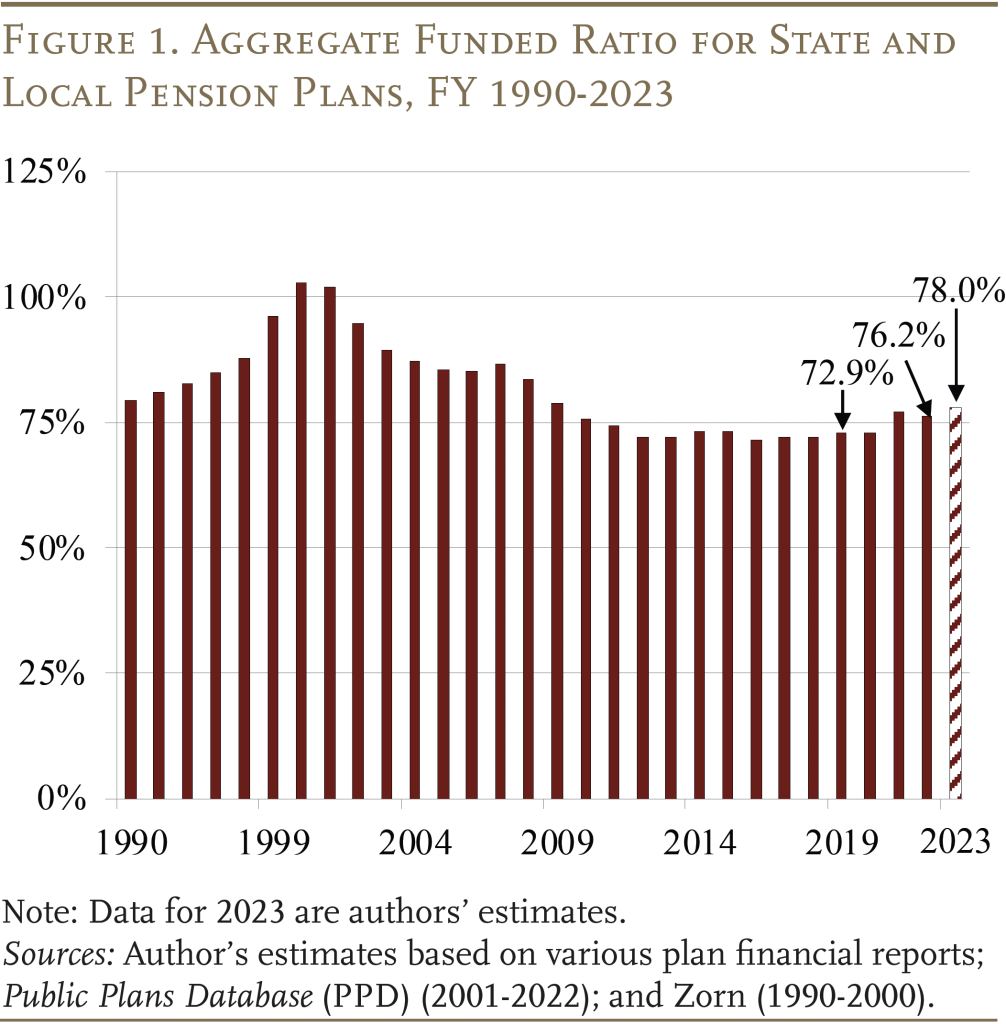
Since fiscal year 2019, financial markets have been jostled by a series of unusual events: 1) the onset of COVID; 2) the subsequent COVID stimulus; 3) declining interest rates; 4) rising inflation; and then 5) rising interest rates. Despite the volatility of asset values over this period, the 2023 funded status of state and local pension plans is about 78 percent, which is 5 percentage points higher than in 2019.
This brief reports the change in the funded status of public plans; documents that, despite the turbulence, values for most asset classes are ahead of their 2019 levels; and then looks more closely at the major exception – fixed-income assets (“bonds”).
The discussion is organized as follows. The first section shows trends in the funded status and costs of state and local pension plans. The second section documents the general performance of major asset classes since 2019 – highlighting the overall positive portfolio gains despite the relatively poor performance of bonds. The third section quantifies how much the rise in interest rates has hurt bond prices. The final section concludes that the funded status of pension plans has improved, with the recent rise in interest rates only marginally impacting their overall finances.
Finances of Public Plans
As of June 2023, roughly two-thirds of the major state and local pension plans in the Public Plans Database (PPD) had reported their 2022 funded levels.1The PPD contains financial data from 2001 to the present (based on the latest available data) for over 220 of the largest state and local pension plans in the United States. This sample covers over 95 percent of state and local pension plan members and assets. For the most recent funded ratios reported by individual plans, access the PPD’s Interactive Data Browser. None had reported 2023 levels. To describe the current status of public plans, this analysis makes plan-by-plan projections using data from each plan’s most recently released reports.2Investment performance is based on each plan’s asset allocation and the performance of selected indices – Russell 3000 for equites; S&P U.S. Aggregate Bond Index for fixed income; S&P Treasury Bill 3-6 Month Index for cash; S&P Listed Private Equity Index for private equity; HFRI 500 Fund Weighted Composite Index for hedge funds; S&P GSCI for commodities; and S&P U.S. Real Estate Index for real estate. For cash flows, contributions and benefits grow based on each plan’s annualized growth over the most recent five-year period. The change in market assets is estimated using the simplified formula: Asset(t+1) = (Asset(t) * investment return) + (½ * cash flows * investment return) + (½ * cash flows). Actuarial assets are calculated using the smoothing methods reported in each plan’s most recent actuarial valuation. Liability growth is based on interest on the prior year’s liability plus normal cost net of benefit payments. Based on the 2022 data and projections for 2023, the aggregate actuarial funded ratio rose by 1.8 percentage points in 2023 (see Figure 1). Despite the somewhat rocky path of market asset values in the wake of COVID, the 2023 funded status is 5 percentage points higher than the 2019 level. While market returns have a substantial effect on funded levels, their impact on the funded ratio in any given year is muted by the actuarial smoothing techniques used when reporting asset values. (See Appendix A for a discussion of actuarial versus market assets.)
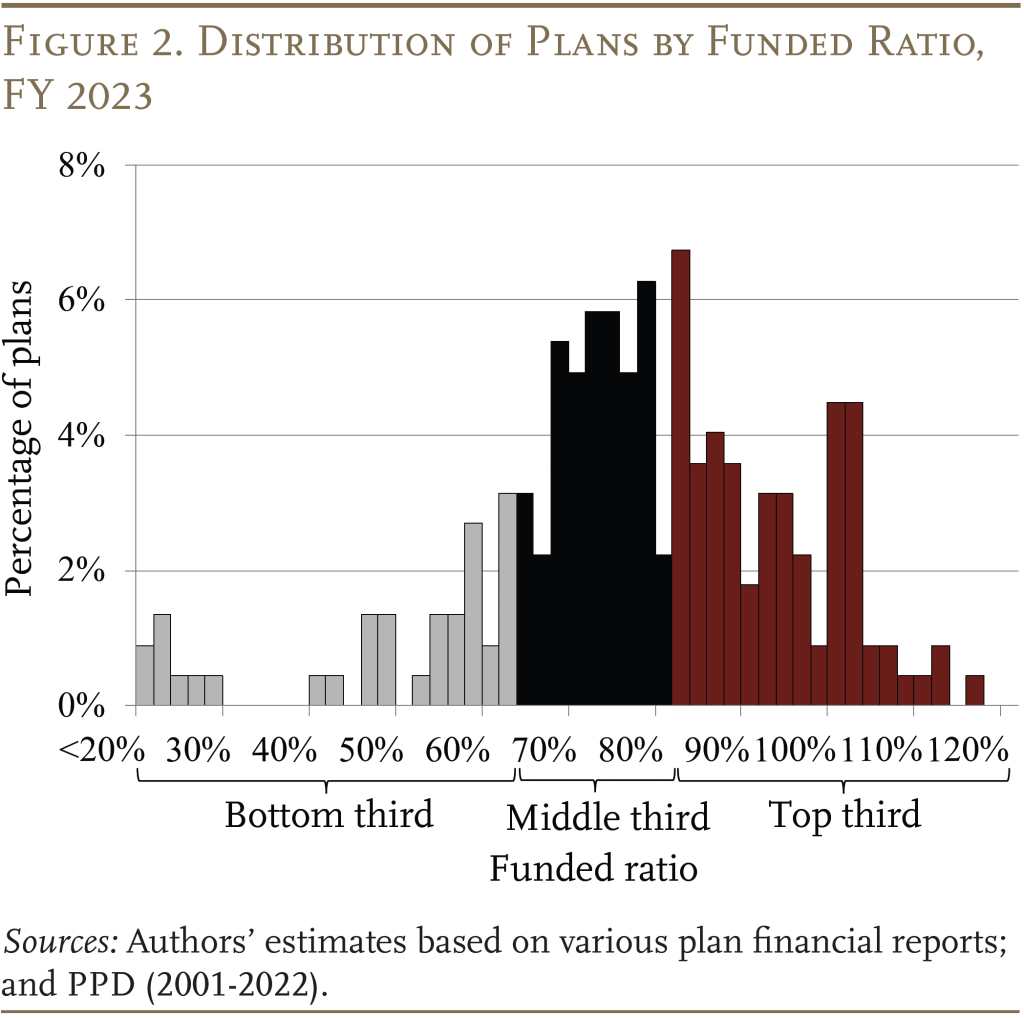
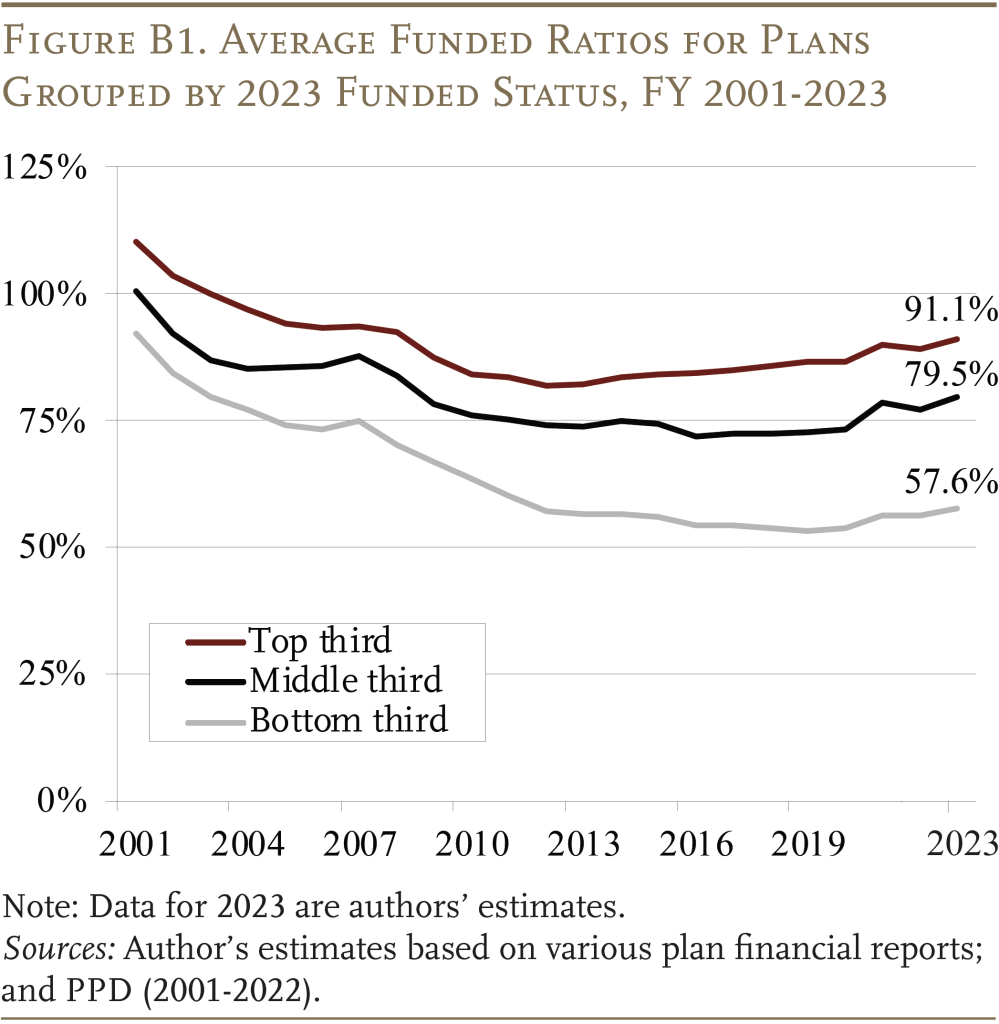
While the aggregate funded ratio provides a useful measure of the public pension landscape at large, it also can obscure variations in funding at the plan level. Figure 2 separates PPD plans into thirds based on their current actuarial funded status. The funded-ratio boundaries for the three groups were 15-70 percent for the bottom third, 70-85 percent for the middle third, and 85-120 percent for the top third. The average 2023 funded ratio for each group was 57.6 percent for the bottom third, 79.5 percent for the middle third, and 91.1 percent for the top third (see Appendix B for trends in this distribution over time).
The actuarially determined contribution rate – the rate required to keep a plan on a steady path toward full funding – is estimated to decline slightly from 2022 to 2023 (see Figure 3).3The PPD sample includes plans that are covered by Social Security and those that are not. For covered plans, the average contribution rate is estimated to be 26.0 percent of payroll in 2023, while the average rate for non-covered plans is estimated to be 28.8 percent. The contribution rate is also lower than it was in 2019. This recent pattern is contrary to that of the past two decades, during which contribution rates have increased due to a rise in the amortization payments to cover growing unfunded liabilities. Today, the portion of the required contribution dedicated to paying down unfunded liabilities is roughly half.4Some plans share rising costs with employees through some form of risk-sharing. For example, Wisconsin RS and Arizona Public Safety define employee and employer contributions as a share of the total required contribution of the plan, so employee and employer costs rise proportionally if unfunded liabilities rise.
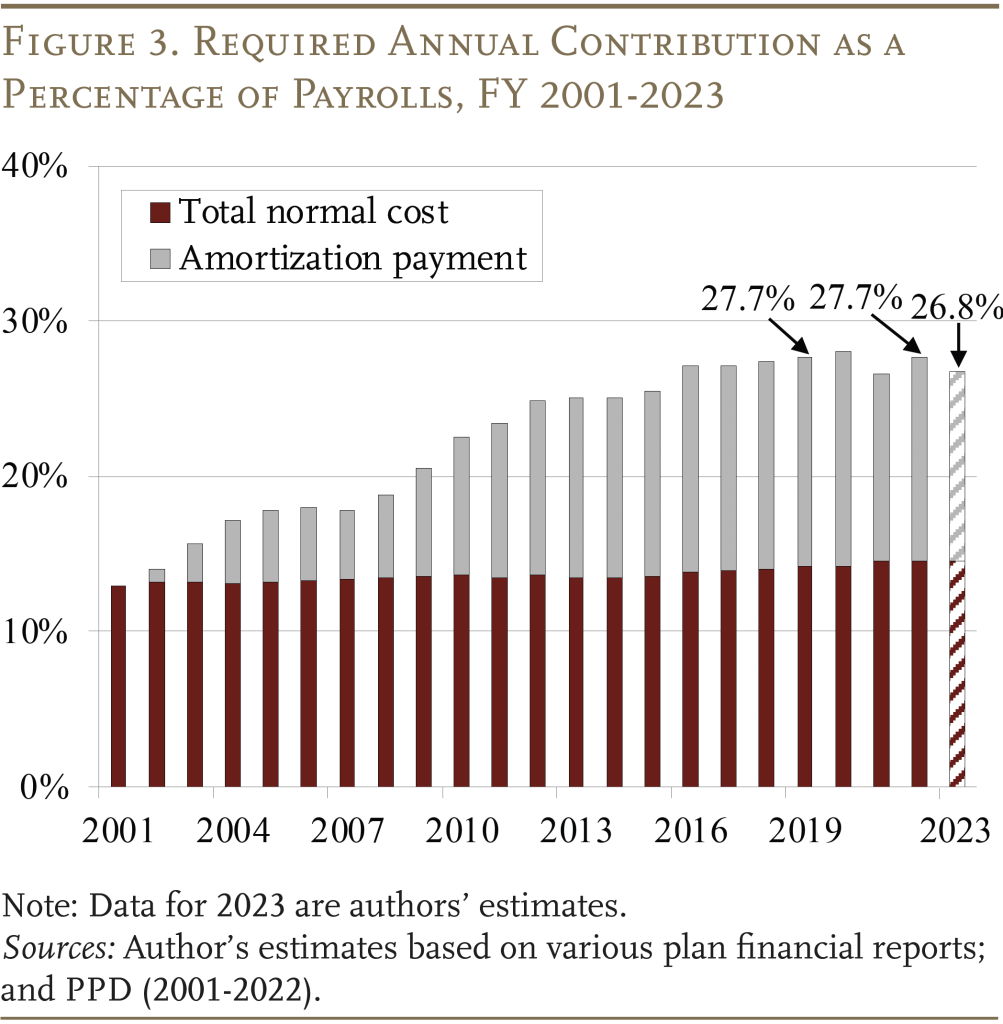
Importantly, many pension researchers (and some practitioners) question the adequacy of actuarially determined contributions as they are typically calculated – highlighting the use of overly optimistic investment return assumptions and relatively lax methods for amortizing the unfunded liability by backloading payments. If investment return assumptions more closely reflected actual performance since 2001, and plans adopted more stringent approaches to amortizing their unfunded liabilities (by using level dollar instead of level percent of pay), the average actuarial contribution in 2023 would rise from 26.8 percent to 34.6 percent of payroll.5Currently, the majority of plans use an assumed return of just over 7 percent and backload the amortization of their unfunded liabilities by using a level percent of payroll method to calculate their required contribution. However, the average investment return for public plans since 2001 has been about 6 percent.
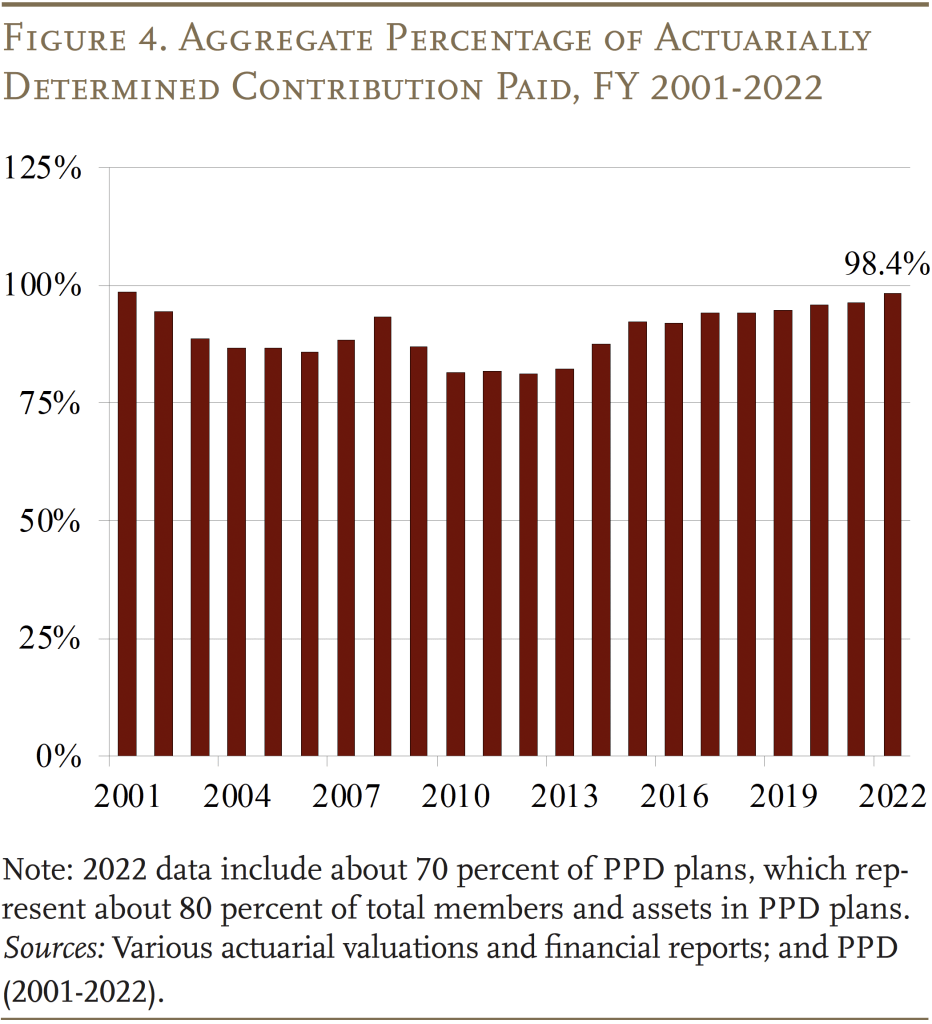
Figure 4 shows that, in aggregate, the percentage of the actuarially determined contribution paid is closing in on 100 percent. This measure is somewhat cyclical because financial and economic downturns often coincide. For example, it fell in the wake of the dot.com crash of the early 2000s and the financial crisis of 2008-2009. As budgets recovered and the funded ratios stabilized as a result of stock market gains, the required contributions also stabilized and the percentage of required contribution paid increased. (See Appendix C for data on the share of plans that receive the full required contribution from their sponsoring governments.)
Asset Class Performance Since 2019
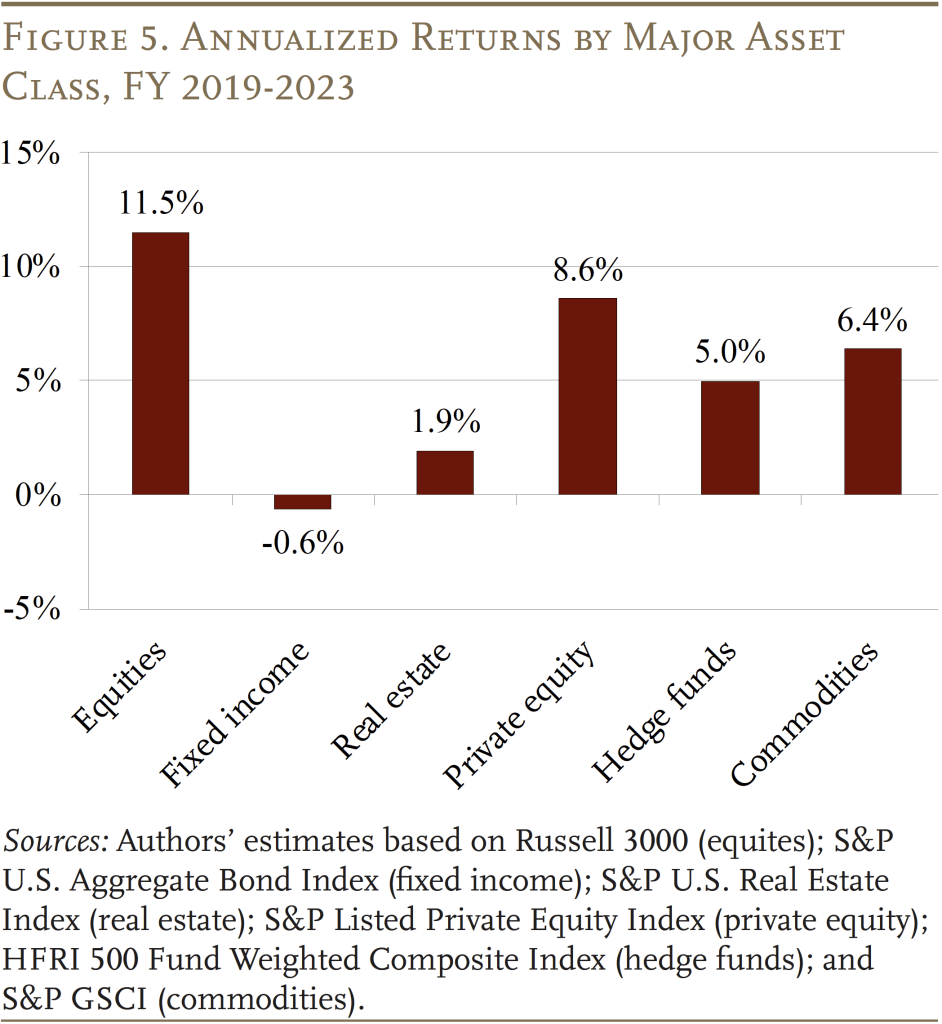
The major reason for the improvement in plans’ funded status is that, despite the turbulence in the economy, total annualized returns, which include interest and dividends, have risen noticeably for almost all major asset class indices over the 2019-2023 period (see Figure 5).6Average pension fund performance tends to closely track the indices. For more on public pension benchmarks, see Aubry and Crawford (2018). The exception over this short and volatile period is fixed income assets, which have declined in value.
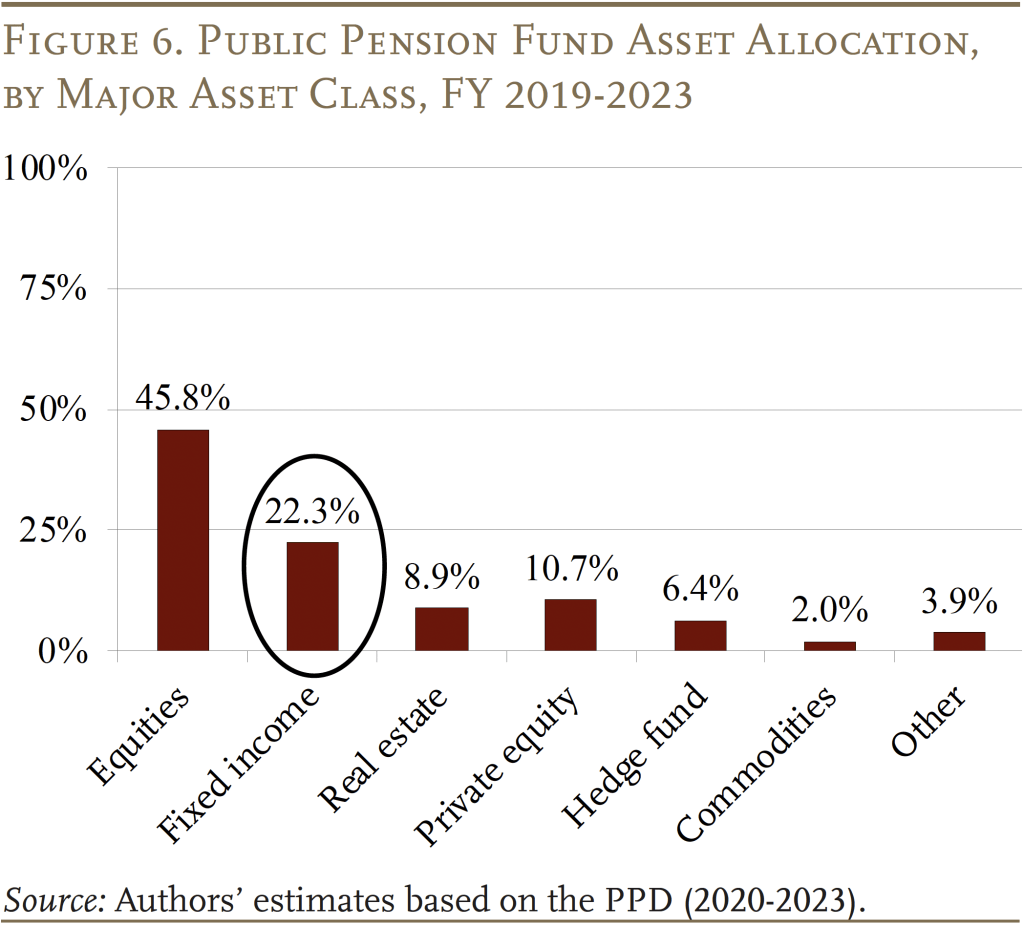
The importance of fixed income’s decline on overall portfolio performance depends on the share of the portfolio allocated to each asset class. Since 2019, as shown in Figure 6, fixed income has averaged only about 20 percent of pension fund assets (a decline from about 30 percent in 2001). As a result, the positive performance of the other major asset classes more than compensated for the decline in the value of fixed income, suggesting an average annualized return of about 6.7 percent for pension funds since 2019, still somewhat below their average assumed return of about 7.0 percent.
Rising Interest Rates and Fixed-Income Assets
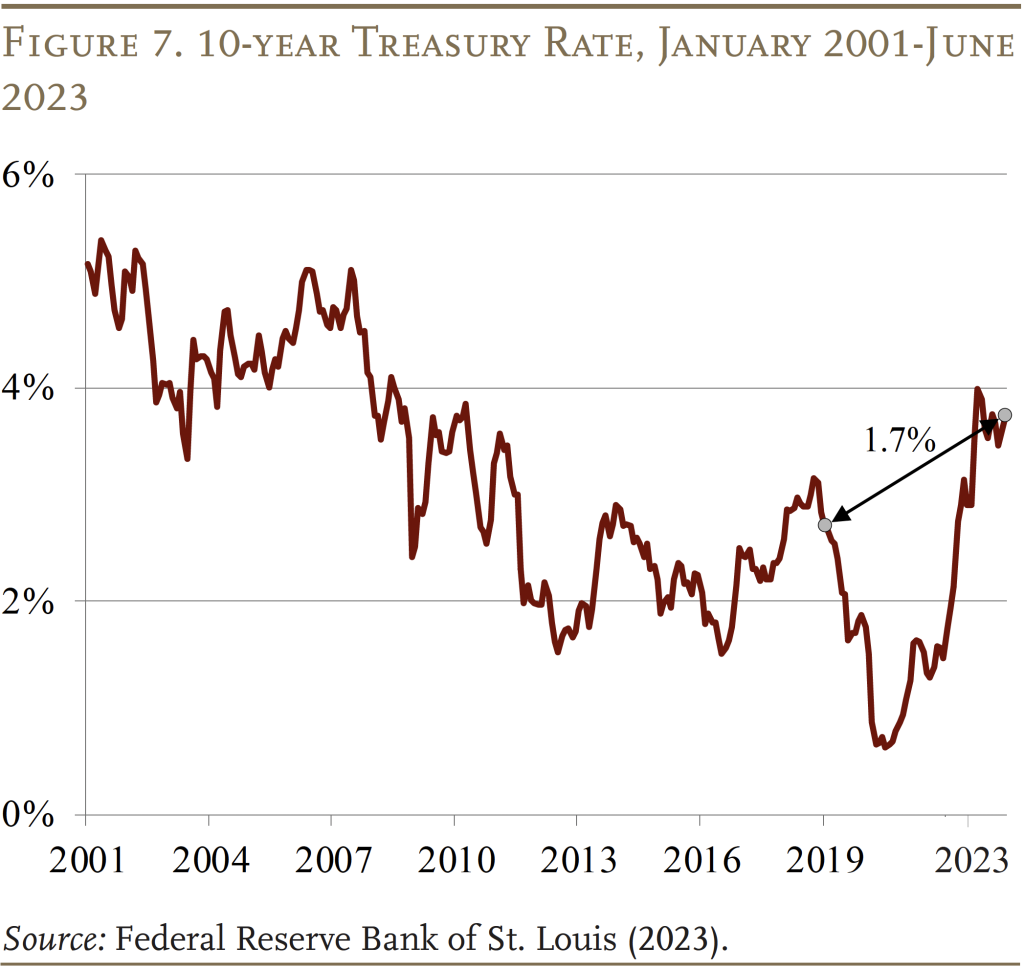
Since 2019, interest rates first fell sharply, with the onset of COVID, and then soared even more dramatically as the economy quickly recovered and inflation emerged as a serious threat. Over the full period, rates on 10-year Treasury bonds rose about 1.7 percentage points – from just over 2 percent to nearly 4 percent (see Figure 7). This increase, which marks a departure from the trend over the last decade, was the major contributor to the poor performance of fixed income. All else equal, when market interest rates rise, the market value of existing bonds declines as demand drops for assets that were issued at lower rates.
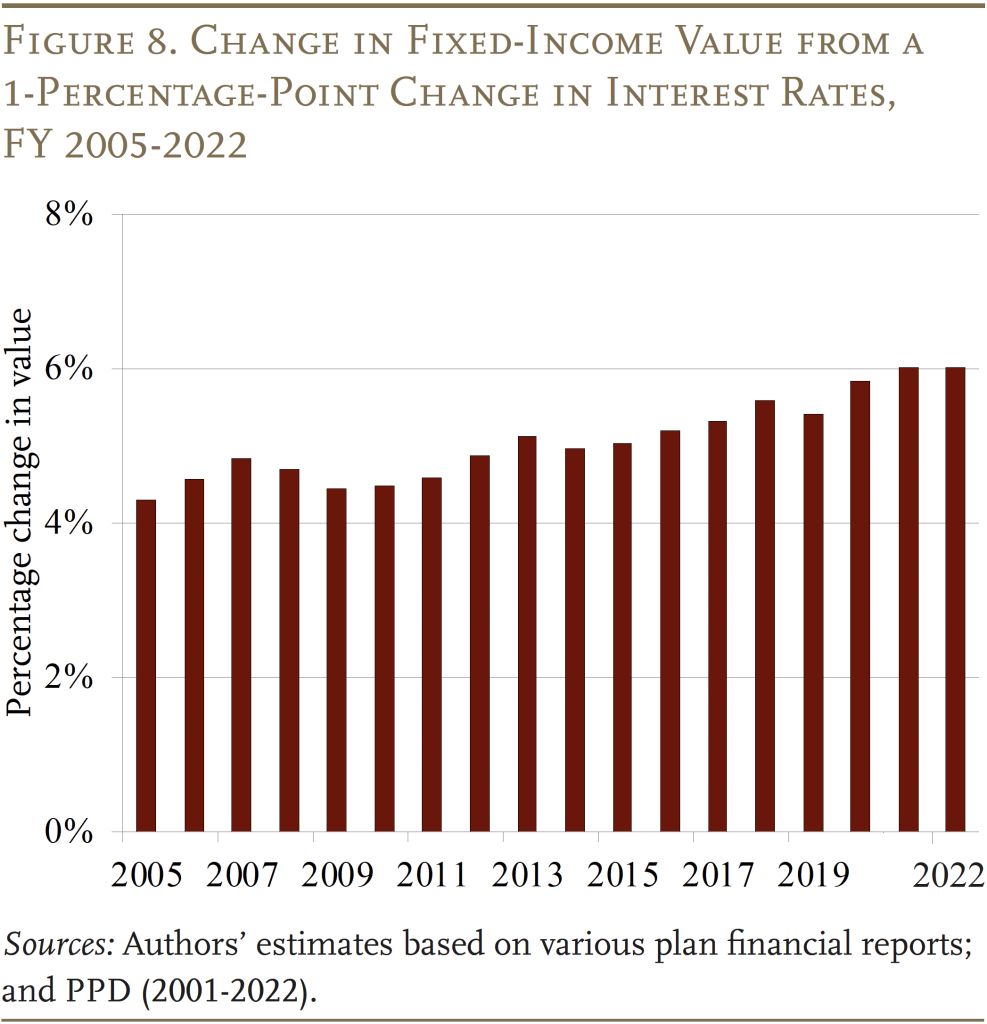
To quantify the impact of the interest rate changes, Figure 8 shows the estimated change in the value of fixed-income assets held by public pension funds due to a 1-percentage-point change in interest rates.7Since FY 2005, GASB has required public plans to report on the interest rate sensitivity of their fixed-income holdings. Since longer maturity bonds are generally more sensitive to interest rate changes, many public pension plans report on the average maturity of their holdings. But, the impact of interest rate changes cannot be estimated from these data. Fortunately, roughly 80 plans – representing 75 percent of PPD assets – directly report the percentage change in the value of their fixed income caused by a 1-percentage point change in interest rates. This measure of interest rate risk is commonly called duration and is often reported as “years.” For example, a duration of six years indicates that a 1-percentage point change in a bond’s yield-to-maturity will cause a 6-percent change in the bond’s fair market value. (See PPD for duration data.) The data show that, as of 2022, a 1-percentage-point increase in rates would lower fixed-income values by about 6 percent. Combining the interest-rate sensitivity reported by public pension funds with the changes in 10-year Treasury rates suggests that the value of pension funds’ fixed-income assets would have declined roughly 2.5 percent per year since 2019. This number is consistent with the annualized return of broad-based fixed-income indices over the same period (shown in Figure 5), once interest payments are taken into account.
Conclusion
Since FY 2019, financial markets have been jostled by the onset of COVID; the subsequent COVID stimulus; declining interest rates; rising inflation; and rising interest rates. Despite the volatile path of market asset values over this period, the FY 2023 funded status of state and local pension plans is about 78 percent – higher than in FY 2022 and about 5 percentage points above the FY 2019 level.
That said, pension funds have been navigating rising interest rates. While this increase has hurt their fixed-income holdings, the overall impact has been offset thus far by the relatively strong performance of other asset classes.
References
Aubry, Jean-Pierre and Caroline V. Crawford. 2018. “How Do Fees Affect Plans’ Ability to Beat Their Benchmarks?” State and Local Plans Issue in Brief 61. Chestnut Hill, MA: Center for Retirement Research at Boston College.
Federal Reserve Bank of St. Louis. 2023. “Federal Funds Effective Rate” and “Market Yield on U.S. Treasury Securities at 10-Year Constant Maturity.” St. Louis, MO. Available at: https://fred.stlouisfed.org/
Public Plans Database. 2001-2022. Center for Retirement Research at Boston College, MissionSquare Research Institute, National Association of State Retirement Administrators, and the Government Finance Officers Association. Available at: https://publicplansdata.org/
Zorn, Paul. 1990-2000. Survey of State and Local Government Retirement Systems: Survey Report for Members of the Public Pension Coordinating Council. Chicago, IL: Government Finance Officers Association.
Appendix A. Changes in Actuarial and Market Assets
Actuarial asset smoothing limits volatility in the funded status by incrementally recognizing – typically, over five years – market gains and losses. As a result, actuarial asset values increase much less than market values during years in which market performance is strong – for example, in 2021 (see Figure A1).
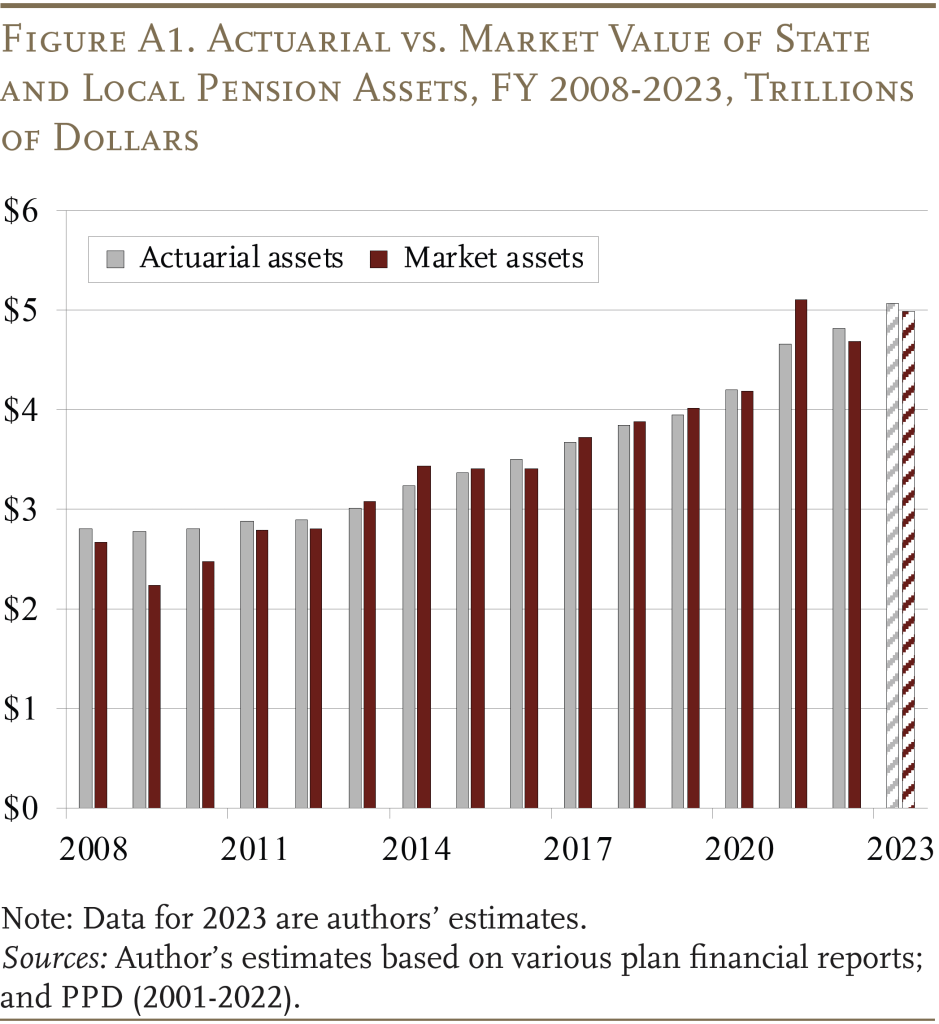
This approach limits the decline in funded levels when market performance levels are weak, such as in 2022 and during the 2008-2009 financial crisis – but it will also reduce the increase in funded status when markets soar, because portions of previous market losses experienced during the smoothing period will continue to be recognized incrementally in actuarial asset values.
Appendix B. Trends in Distribution of Plans’ Actuarial Funded Ratio
Figure B1 tracks the average funded status for each third of plans from 2001-2023. While the bottom third has been consistently less funded throughout the period, the average funded ratios for all groups were above 85 percent in 2001. However, over time, the funded status of the three groups has grown apart. Much of this divergence has occurred since the 2008-2009 financial crisis as the worst-funded group has continued to deteriorate while the other two groups have stabilized. As a result, the gap between the top and bottom groups in 2023 was 33.5 percentage points – much larger than in 2001.
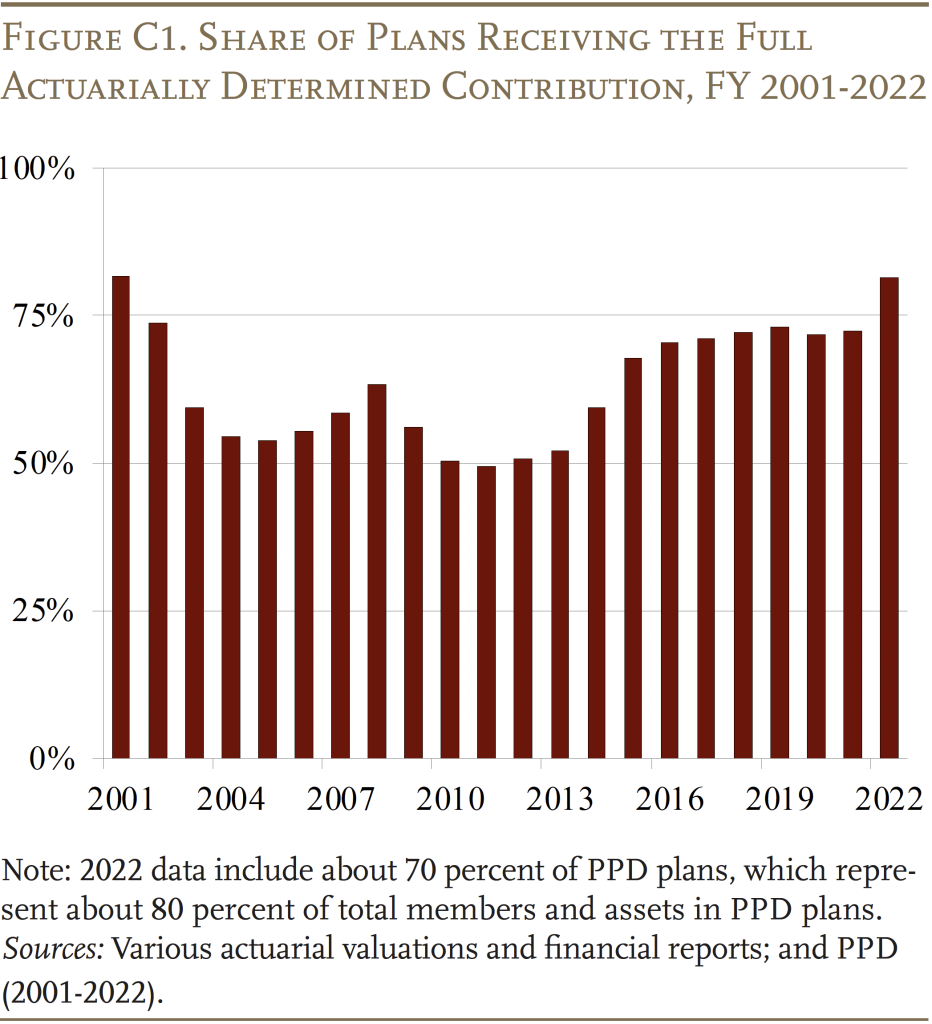
Appendix C. Plans Receiving the Full Contribution
The share of plans that receive their required contributions in full also fluctuates over time but, interestingly, never drops below 50 percent (see Figure C1). This pattern suggests two types of sponsoring governments – one that is committed to full contributions and another that rarely pays in full with fluctuating levels of underpayment dependent on fiscal circumstances.
Endnotes
- 1The PPD contains financial data from 2001 to the present (based on the latest available data) for over 220 of the largest state and local pension plans in the United States. This sample covers over 95 percent of state and local pension plan members and assets. For the most recent funded ratios reported by individual plans, access the PPD’s Interactive Data Browser.
- 2Investment performance is based on each plan’s asset allocation and the performance of selected indices – Russell 3000 for equites; S&P U.S. Aggregate Bond Index for fixed income; S&P Treasury Bill 3-6 Month Index for cash; S&P Listed Private Equity Index for private equity; HFRI 500 Fund Weighted Composite Index for hedge funds; S&P GSCI for commodities; and S&P U.S. Real Estate Index for real estate. For cash flows, contributions and benefits grow based on each plan’s annualized growth over the most recent five-year period. The change in market assets is estimated using the simplified formula: Asset(t+1) = (Asset(t) * investment return) + (½ * cash flows * investment return) + (½ * cash flows). Actuarial assets are calculated using the smoothing methods reported in each plan’s most recent actuarial valuation. Liability growth is based on interest on the prior year’s liability plus normal cost net of benefit payments.
- 3The PPD sample includes plans that are covered by Social Security and those that are not. For covered plans, the average contribution rate is estimated to be 26.0 percent of payroll in 2023, while the average rate for non-covered plans is estimated to be 28.8 percent.
- 4Some plans share rising costs with employees through some form of risk-sharing. For example, Wisconsin RS and Arizona Public Safety define employee and employer contributions as a share of the total required contribution of the plan, so employee and employer costs rise proportionally if unfunded liabilities rise.
- 5Currently, the majority of plans use an assumed return of just over 7 percent and backload the amortization of their unfunded liabilities by using a level percent of payroll method to calculate their required contribution. However, the average investment return for public plans since 2001 has been about 6 percent.
- 6Average pension fund performance tends to closely track the indices. For more on public pension benchmarks, see Aubry and Crawford (2018).
- 7Since FY 2005, GASB has required public plans to report on the interest rate sensitivity of their fixed-income holdings. Since longer maturity bonds are generally more sensitive to interest rate changes, many public pension plans report on the average maturity of their holdings. But, the impact of interest rate changes cannot be estimated from these data. Fortunately, roughly 80 plans – representing 75 percent of PPD assets – directly report the percentage change in the value of their fixed income caused by a 1-percentage point change in interest rates. This measure of interest rate risk is commonly called duration and is often reported as “years.” For example, a duration of six years indicates that a 1-percentage point change in a bond’s yield-to-maturity will cause a 6-percent change in the bond’s fair market value. (See PPD for duration data.)


Aubry, Jean-Pierre and Yimeng Yin. 2023. "Public Pension Funded Levels Improve Amidst Rising Interest Rates" Issue in Brief 23-15. Chestnut Hill, MA: Center for Retirement Research at Boston College.