Social Security’s 75-year Deficit Is Not Surprising

Alicia H. Munnell is a columnist for MarketWatch and senior advisor of the Center for Retirement Research at Boston College.
Most is due to change in the program’s 75-year horizon.
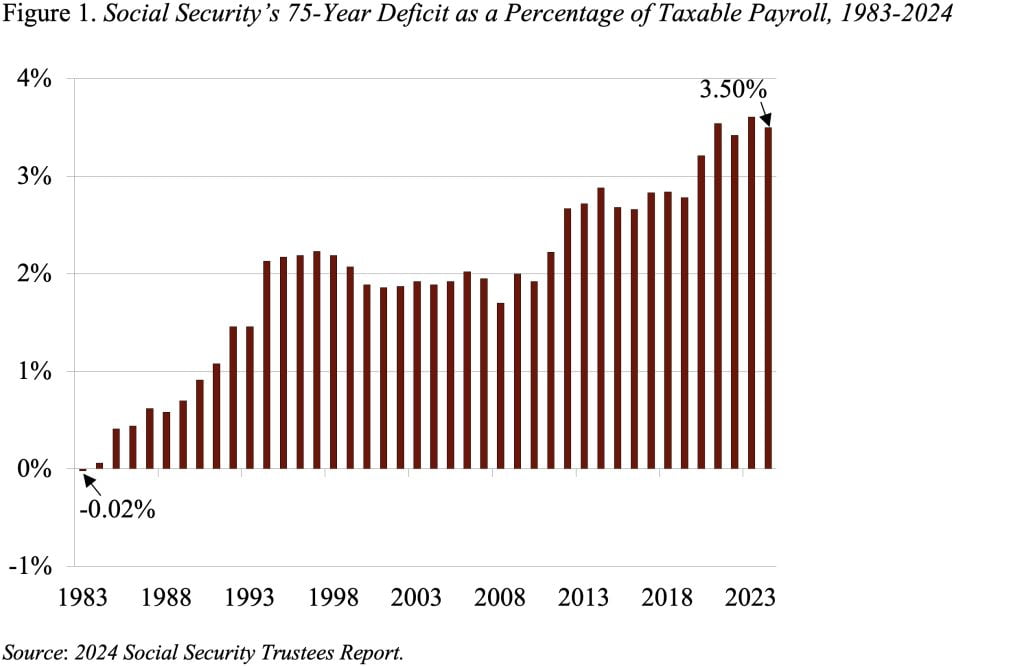
The 2024 Social Security Trustees Report showed a 75-year deficit of 3.50 percent of taxable payrolls compared to a surplus of .02 percent in 1983. While the increase in the deficit over the last 41 years is large, two-thirds of the increase was totally predictable in 1983 and much of the remainder is due to an unanticipated development outside the program’s purview.
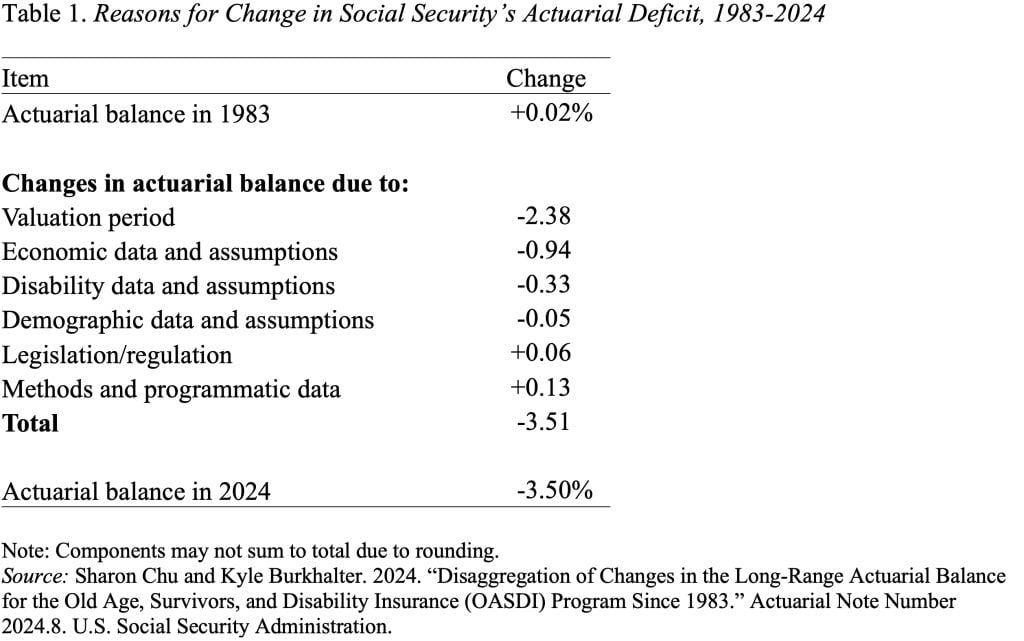
First, the predictable part of the story. The reasons for the increase in Social Security’s 75-year deficit over the last 41 years are shown in Table 1. Leading the list is advancing the valuation period. Each time the 75-year period moves forward one year – for example, from 1983-2057 to 1984-2058 – it picks up a year with a large negative balance. The cumulative effect of adding these negative balances over the last 41 years has been to increase the 75-year deficit by 2.38 percent of taxable payrolls. That is, more than two-thirds of the 41-year change in the deficit is attributable to simply moving the valuation period forward.
The fact that so much of the increase in the deficit is due to a mechanical issue – not a change in costs or revenues – should give us confidence in the accuracy and stability of the actuaries’ projections. Moreover, most of the remaining one-third of the deficit increase is due to a largely unanticipated development – namely, the increase in earnings inequality, which has led to a big decline in the ratio of taxable earnings to covered earnings.
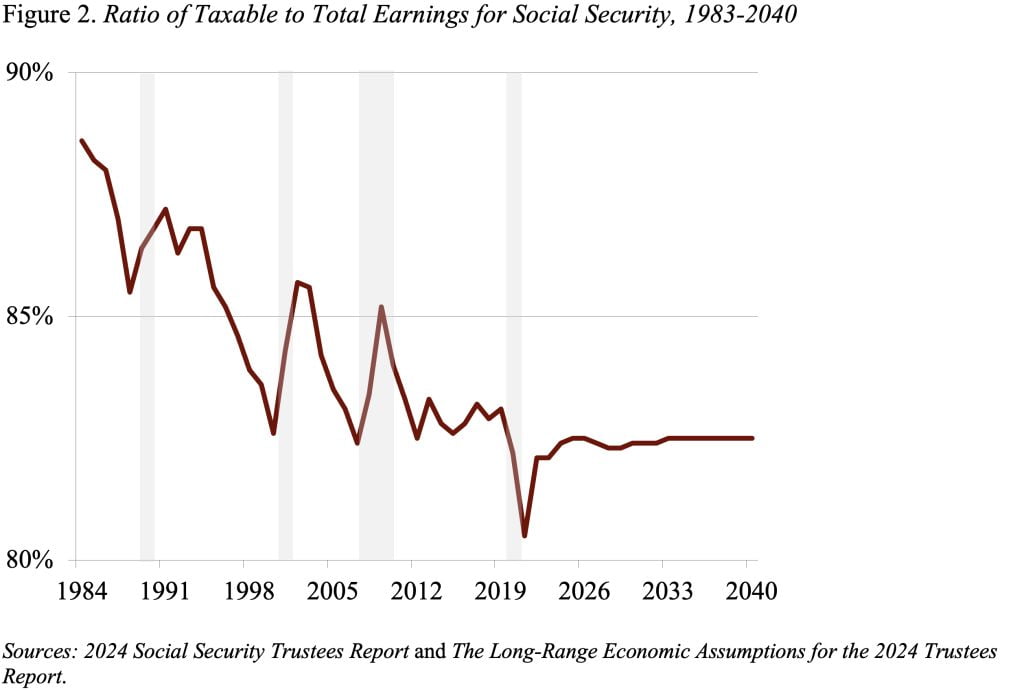
Let me explain. Only earnings below Social Security’s contribution and benefits base of $168,600 in 2024 are subject to the program’s payroll taxes and count towards benefits. The fraction of total earnings below this threshold is the taxable ratio. As inequality has increased, the percentage of earnings subject to tax has declined from almost 90 percent in 1983 to 82 percent today (see Figure 2).
A decline in the taxable ratio raises Social Security costs for two reasons. To understand the effects of both channels, assume that average wage growth for workers overall is constant, but that the growth shifts to the upper end of the income distribution.
The first channel is through the progressivity of the Social Security benefit formula – that is, Social Security provides higher benefits relative to earnings for low earners than for high earners. Consequently, a rise in the share of covered earnings above the taxable cap means relatively lower earnings growth for workers of modest means. This slower earnings growth means less tax revenue for Social Security, but – because of the progressive benefit formula – future benefits do not decline by a commensurate amount.
A second channel by which rising earnings inequality erodes Social Security’s finances is through the Average Wage Index (AWI). The AWI is based on all covered earnings, both below and above the taxable maximum. A rise in the AWI that is driven by growth in earnings above the taxable maximum generates no additional tax revenue. But such a rise does increase benefits because the AWI is used to inflate workers’ prior earnings when calculating their benefit levels.
While the actuaries in 1983 knew that Social Security costs would increase over time due to the aging of the population and they knew the 75-year deficit would rise as the valuation period moved forward, they had not planned on the increase in earnings inequality. But now that too is built into the projections.