
Supplemental Poverty Rate Reveals Little Variation by Age

Alicia H. Munnell is a columnist for MarketWatch and senior advisor of the Center for Retirement Research at Boston College.
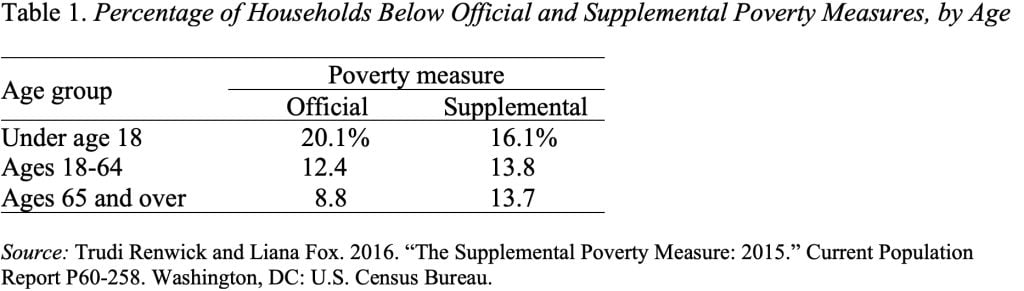
Unlike the official poverty rate, the supplemental rate shows retirees and kids are similar.
The Census publication Income and Poverty in the United States: 2015 was full of widely reported good news. Median household income was up and poverty was down. More recently, the Census has released its report The Supplemental Poverty Measure: 2015. This is a good time to look at poverty rates for different portions of the population.
Table 1 shows the percentage of households below the official measure of poverty; the poverty rate for those 65 and over is less than half the rate for children.
The problem is that the official poverty measure, which was a major innovation when it was first introduced in the late 1960s, is very crude. Essentially, the thresholds were set at a minimum diet for families of different sizes multiplied by three, assuming that families spent a third of their budget on food. The 1960s’ numbers have been adjusted for changes in the consumer price index to produce today’s poverty thresholds.
The official measure does not do a good job of measuring how much people have or how much they need. It does not reflect:
- Government tax and benefit programs: Taxes reduce disposable income, and in-kind programs, such as food stamps, free up money for other things.
- Rising standards of living: In the 1960s, the poverty threshold equaled one half of median income; today it is one third.
- Costs associated with earning a living: Child care and transportation reduce the amount available for spending.
- Variation in medical costs: Medical costs vary by health and insurance status.
- Geographic differences in prices: Housing costs more in Manhattan than in Mississippi.
Beginning in 2011, the government began publishing poverty rates based on a “Supplemental Poverty Measure,” built on a major study by the National Academy of Sciences in the 1990s, which overcomes these shortfalls.
The new measure established a poverty threshold for a basic set of goods for a family of four with two children. The amount spent on these goods (food, clothing, shelter, and utilities) was derived from five years of data from the Consumer Expenditure Survey. The basic estimate is adjusted to reflect different family sizes and geographic differences in housing costs.
It then compares these thresholds with family resources. These resources include the value of all cash income plus in-kind benefits minus necessary expenses. In-kind income includes nutritional assistance, subsidized housing, and home energy assistance. Necessary expenses include taxes, child care and other work-related expenses, and medical out-of-pocket costs.
Essentially, the new index finds that the low-income young receive a lot of previously uncounted benefits in kind, while older persons spend a large share of their income on health care, leaving less available for food, clothing, shelter, and utilities. The net result is that the poverty rate is more or less flat across age groups (see Table 1).
Offsetting factors will affect the poverty rate of those 65 and over going forward. On the one hand, health costs are rising rapidly, leaving less and less money for food, clothing, shelter, and utilities. On the other hand, the Baby Boomers are flooding into retirement, ballooning the size of the younger cohorts in the 65 and over population, who typically have lower poverty rates than older retirees. In the short run, the progress of the Baby Boomers will keep the poverty rate for older Americans steady; in the longer run, rapidly rising health costs and inadequate retirement savings will cause it to rise.