
The ACA and Labor Force Participation of Older Workers

Alicia H. Munnell is a columnist for MarketWatch and senior advisor of the Center for Retirement Research at Boston College.
Bits and pieces of evidence suggest the ACA may lead to a small decline in work.
Since the passage of the Affordable Care Act (ACA) in 2010, economists have been trying to figure out how the availability of health insurance not tied to the employer will affect labor supply, particularly that of older workers.
One of my colleagues here at the Center looked at the impact of Massachusetts health reform on the labor force participation of older men. He compared the percentage-point change in the share of workers participating in the labor force between 2000-2005 – the period before reform and 2007-12 – the period after reform – in Massachusetts and nearby states. Figure 1 shows that Massachusetts has seen the largest decrease in labor force participation of any of the comparison states (most states saw an increase). This simple comparison suggests that health reform does have an impact.
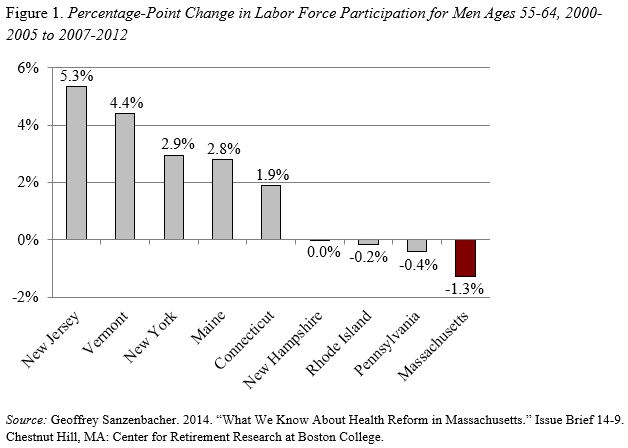
Similarly, the Congressional Budget Office (CBO) projected that the ACA would produce a decline in labor force activity nationally. CBO estimated a 1.5-2.0 percent reduction in hours worked due to the ACA. Although this estimate represents all workers and looks at hours worked, not labor force participation, the magnitude of the decline in labor supply estimated by the CBO is consistent with the estimates shown in Figure 1.
Recently, a colleague, arguing the other side – that is, the ACA is unlikely to impact labor force activity – sent me a chart looking at changes in labor force participation before and after the introduction of Medicare in 1966. To control for other things happening in the economy, he looked not only at the labor force activity of those ages 65-69 – the affected group – but also that activity relative to those ages 60-64 – a group not directly affected by the introduction of Medicare. Thus, the focus is the dashed line in Figure 2.
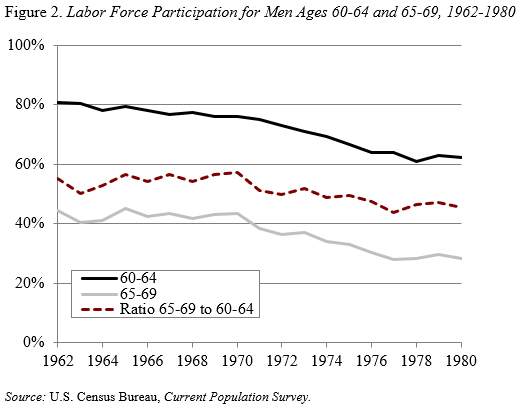
My colleague argued that the comparison should focus on the first five years after implementation, because the unemployment rate started to rise after 1970 and also Medicare started being available to individuals receiving disability insurance. Clearly, if the first five years is the focus, Medicare appears to have had no effect. But I couldn’t resist looking beyond 1970 and during the 1970s the decline in the labor force activity of Medicare recipients exceeded that of those not eligible, leading to a decline in the dashed line measuring the ratio of one to another.
On balance, my guess is that the ACA will lead to a small decline in the labor force activity of older workers, as those working only to get health coverage will leave their jobs and buy insurance on the exchanges.