The Retirement-Income Crisis, in One Chart

Alicia H. Munnell is a columnist for MarketWatch and senior advisor of the Center for Retirement Research at Boston College.
Wealth-to-income ratios show declining preparedness over time.
Call me paranoid, but it seems like the financial services industry has undertaken a concerted effort to show that the U.S. does not have a retirement income problem – that most people will have all the money they need in retirement. Indeed, some sophisticated economic modelling does suggest that people may be saving optimally. But the basic data say otherwise.
The Federal Reserve’s triennial Survey of Consumer Finances (SCF) shows that the ratio of wealth to income, a good indicator of the extent to which people can replace their earnings in retirement, has remained virtually unchanged at each age from 1983 through 2010. In these ratios, wealth includes all financial assets, 401(k) accumulations, and real estate less any outstanding debt, and income includes earnings and returns on financial assets; importantly, wealth excludes the present expected value of income that the household will eventually receive from defined benefit pension plans and Social Security.[1]
As shown in the Figure, the ratios at each age for each survey lie virtually on top of one another. The only outlier is 2010, where the ratios are substantially below those in the other surveys at every age.
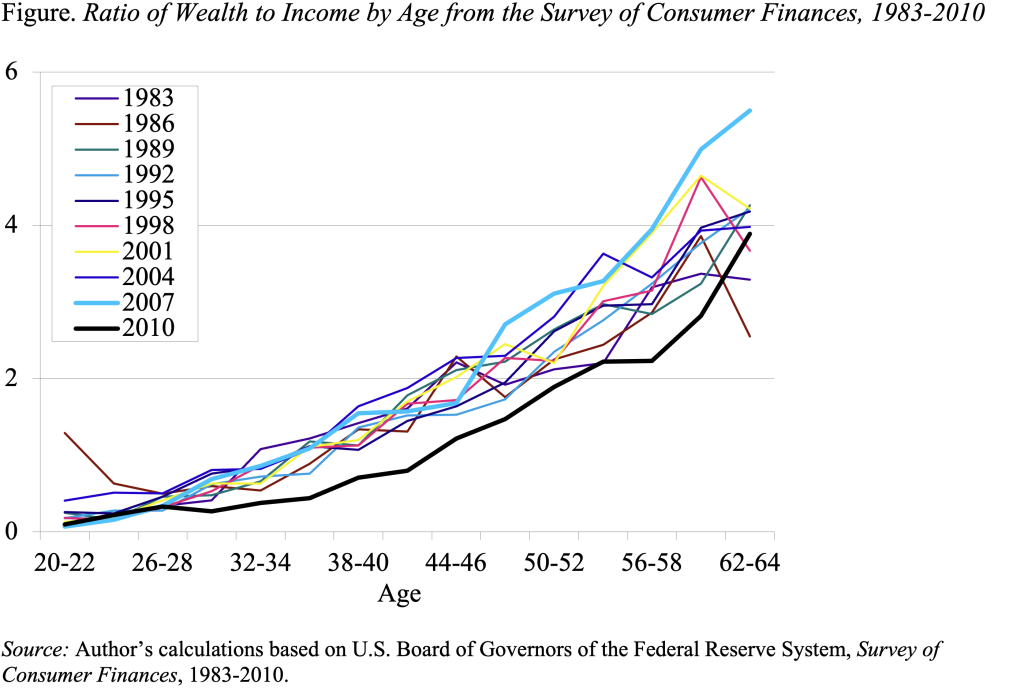
The stability of the ratio reveals a significant decline in retirement preparedness given that five major developments should have led to higher ratios of wealth to income.
- First, life expectancy has increased. Between 1983 and 2010, life expectancy at age 65 rose by 3.8 years for men and 2.3 years for women. As a result, for any given level of income, one would have expected workers to accumulate more wealth in order to support themselves over their longer period in retirement.
- Second, Social Security replacement rates have declined as the Full Retirement Age moves from 65 to 67 and the actuarial reduction on benefits claimed early increases. Moreover, the growing prevalence of two-earner couples means that fewer households receive the spousal benefit.
- Third, the nature of retirement plans has shifted from defined benefit to 401(k), and whereas accruals of future benefits under defined benefit plans are not included in wealth, assets in 401(k) plans are included. The shift from unreported to reported retirement assets would have been expected to increase the wealth-to-income ratio.
- Fourth, health care costs have risen substantially and show signs of further increase. The rising cost of health care should have led to higher wealth-to-income ratios today than in the past.
- Finally, real interest rates have fallen significantly since 1983, so a given amount of wealth now produces less retirement income. If people were interested in generating a given stream of income, the significant decline in interest rates would have been expected to boost wealth accumulations.
The stability of wealth-to-income ratios over the ten SCF surveys between 1983 and 2010 – in the face of these five significant developments – indicates that people are less well prepared than in the past. If they were over prepared in the past, they could be fine today. But if they were not over prepared in 1983, then they are falling short today.
[1] The exact definition of income in the SCF includes wages, investment income, interest and dividend income, capital gains or losses, unemployment payments, alimony, welfare, pension income, and some other less common income; it is essentially all pre-tax income that comes into a household in a given year.