Are the Rich or Poor Hurt More by Inflation?

Alicia H. Munnell is a columnist for MarketWatch and senior advisor of the Center for Retirement Research at Boston College.
It really depends on how you measure it.
Our new research associate, Diana Horvath, and I wanted to see whether the current high rates of inflation were hurting the poor more than the rich or vice versa. Indeed, researchers at the Bureau of Labor Statistics did such an exercise for the period 2003-2018. They found that because of differences in spending patterns the average annual increase in the Consumer Price Index for All Urban Consumers (CPI-U) for the lowest income quartile was 2.25% compared to 1.97% for the highest income quartile.
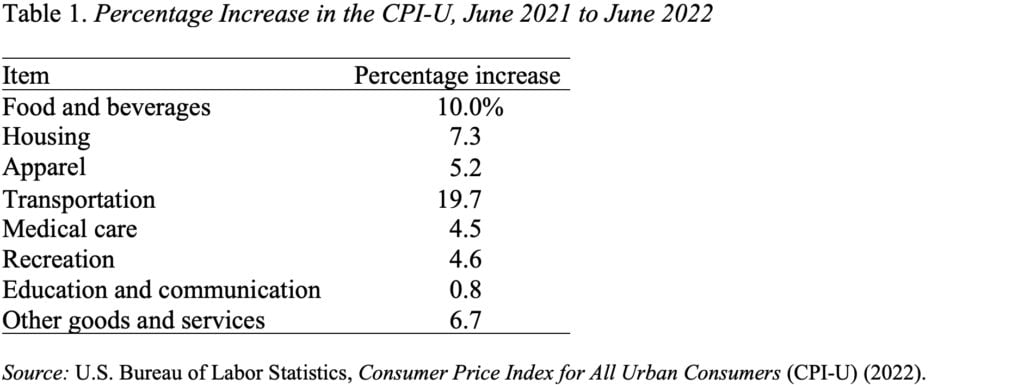
Since we don’t have access to the detailed data used by the BLS researchers, our plan was to focus on the price increases for the eight high-level categories in the CPI-U, using inflation data for June 2022 (see Table 1). (Although inflation has moderated somewhat since then, it remains very high.) The idea was to see whether or not low-income households spent more on, say, food and beverages and on transportation – categories with very high rates of price increase – than their high-income counterparts and therefore were hurt more by the current bout of inflation.
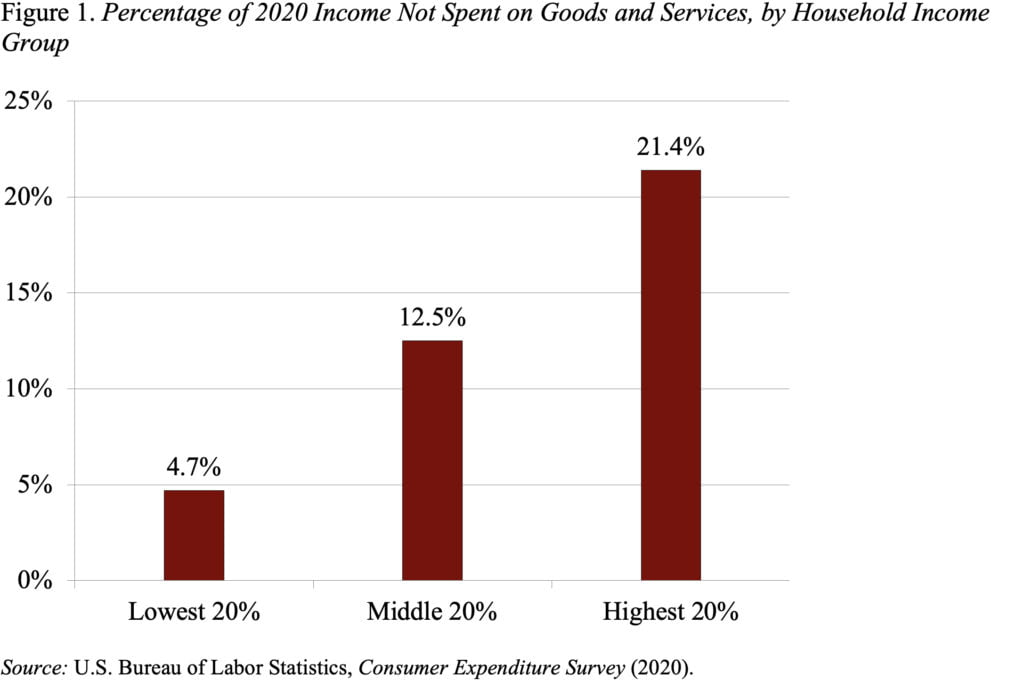
Spending data come from the 2020 Consumer Expenditure Survey (CEX), which reports annual expenditures by income quintiles. The CPI and CEX categories don’t quite line up perfectly, but, with a little rearrangement, it is possible to fit most of the CEX spending into one of the CPI bins. The major exception is “Savings for Retirement,” which includes contributions to Social Security and other retirement plans plus a few other items and does not correspond to anything in the CPI basket of goods and services. This category shows the expected pattern that higher income households save more (see Figure 1).
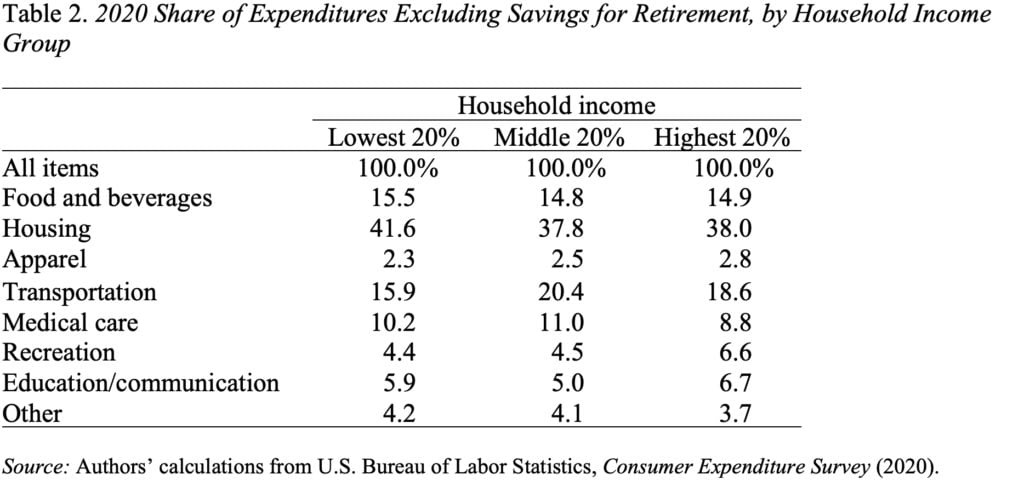
Ok, you say, ignore the retirement-contribution component of CEX expenditures and simply look at how the rest is distributed among the CPI categories. Mechanically, that exercise is easy to do (as described in our issue brief). What you find is that the spending patterns of low-, middle-, and high-income households look quite similar. All households spend about 15 percent of their budgets on food and beverages, 38-42 percent on housing, and 16-20 percent on transportation; other categories also look quite similar (see Table 2).
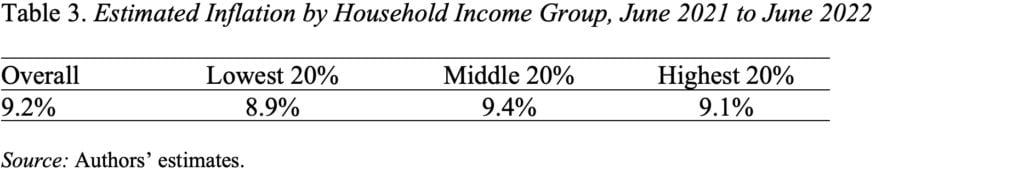
Given the similarity in spending patterns, it is not surprising that the inflation experienced by the three groups looks very similar (see Table 3).
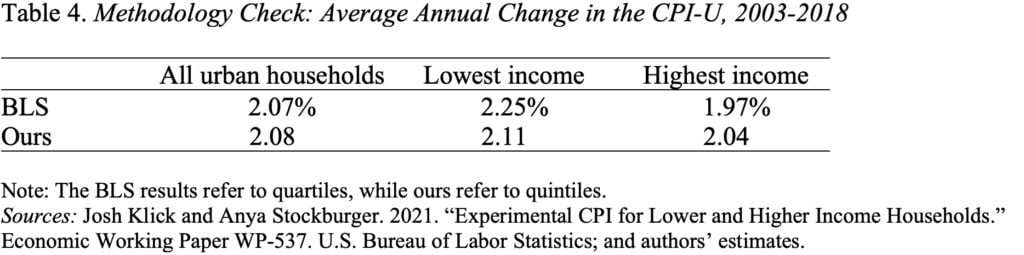
As a check on our methodology, we used our crude procedure to replicate the numbers from the BLS study for 2003-2018. The results are similar: the overall annual average increase is very close and the lowest-income households experienced higher inflation than the highest (see Table 4).
The thing that we find hard to wrap our head around is that the rich spend only 79 percent of their after-income-tax resources on items included in the CPI-U, while the poor spend 95 percent. So, yes, the inflation experience of high- and low-income households is not that different on the items that they purchase, but the low-income households spend virtually all their resources on inflation-affected items while the high-income spend a significantly smaller share on those items. Therefore, one could argue that at least on the expenditure side, the wealthy are much less affected than the low income by current high inflation. Of course, in a lifecycle sense, savings are exposed to inflation eventually when they are spent. But savers have time to shift their consumption patterns in preparation for these eventual impacts, an advantage unavailable to those forced to spend today.