
401(k)/IRA Holdings in 2022: An Update from the SCF

The brief’s key findings are:
- The 2022 Survey of Consumer Finances shows how 401(k)/IRA saving fared from 2019-2022.
- The answer is not obvious given all that went on: COVID, economic disruption, seesawing markets, a huge fiscal response, and strong employment.
- The good news: for working households nearing retirement with a 401(k), median combined 401(k)/IRA balances rose from $144,000 to $204,000.
- The bad news: these gains for older savers were mainly among the higher income, and younger savers generally did not do well.
- Moreover, half of households do not even have a 401(k), so the overall news on retirement saving remains disappointing.
Introduction
The Federal Reserve’s 2022 Survey of Consumer Finances (SCF) summarizes changes in family finances between 2019 and 2022 – three years of COVID, economic disruption, and unprecedented fiscal support – and 2022 was also a terrible year in terms of stock and bond returns. Despite the unusual circumstances, employment remained strong, the stock market – even with the drop in 2022 – ended up substantially higher than in 2019, and the 401(k) system continued to mature. On balance, one would expect improved balances between 2019 and 2022 across age and income groups. The SCF can resolve this issue. The advantage of the SCF over data on 401(k) plans from financial service firms is that it provides information not only about households’ 401(k) holdings but also about their IRAs, which are predominately rollovers from 401(k)s and represent the majority of retirement account assets.
The discussion proceeds as follows. The first section describes the importance of 401(k) plans and IRAs in the retirement income system. The second section documents the improving trend in individual decisions regarding the accumulation of assets in 401(k)s. The third section reports on 401(k)/IRA balances. The final section concludes with an assessment of the overall picture.
The good news from the 2022 SCF is that 401(k)/IRA balances for older working households with a plan totaled $204,000 in 2022, compared to $144,000 for comparable households in 2019. The bad news is that only half of older households had a 401(k) plan, and the gains occurred among higher-income households, while the situation for the bottom 40 percent of the income distribution deteriorated. Moreover, in contrast to older households, the balances of households ages 45-54 failed to keep pace with inflation and those of households 35-44 declined in nominal terms. On balance, given the strength of the economy and the gains in the stock market over the three-year period, the 2022 SCF provides a disappointing picture of the retirement assets for working households. Moreover, the focus is on the 50 percent of households with a 401(k) plan; the other half of households have nothing but Social Security.
The Role of 401(k)s/IRAs in the Retirement System
Retirement savings accounts – 401(k)s and IRAs – are key to the retirement security of today’s workers for two reasons.1This brief generally covers assets in all defined contribution plans but refers to them as 401(k)s for simplicity. First, Social Security, the backbone of the system, will provide less relative to pre-retirement earnings in the future – even assuming Congress addresses the program’s financial shortfall once trust fund balances are depleted in the early 2030s. Second, employer-sponsored plans have shifted almost entirely to 401(k)s in the private sector, although traditional defined benefit plans remain the major form of retirement saving for state and local workers.
Social Security
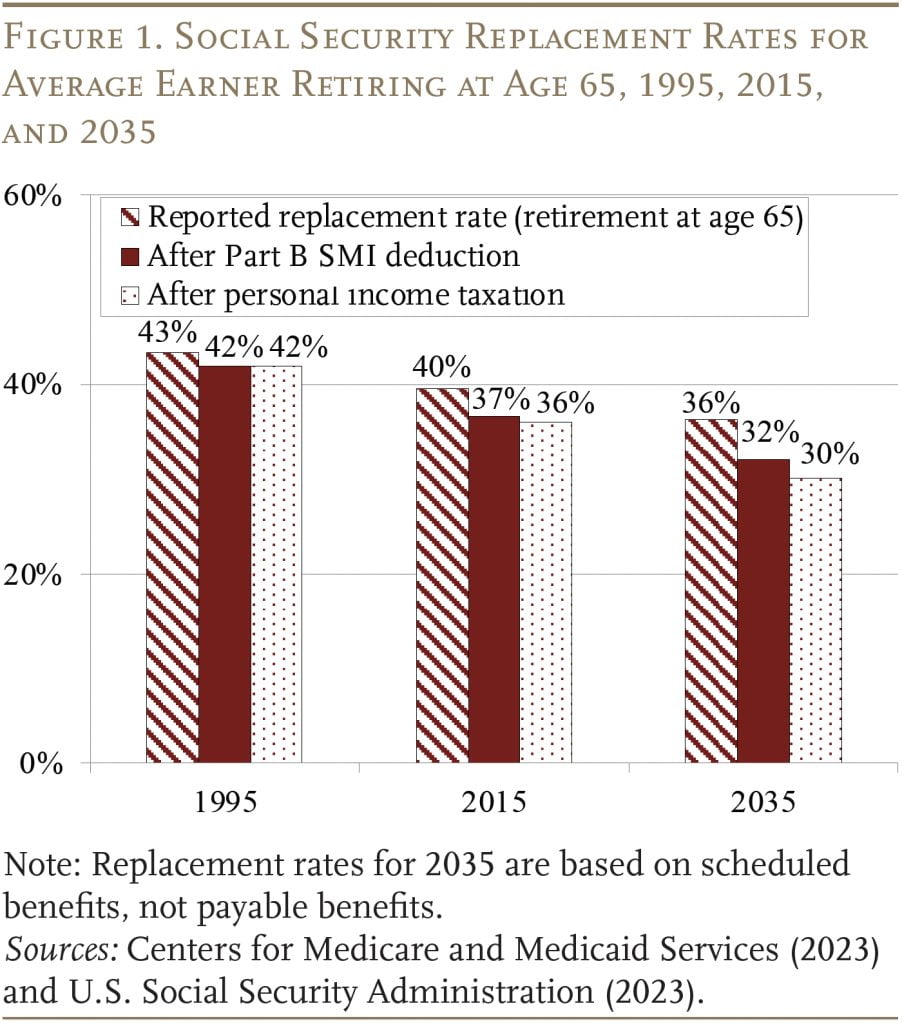
Social Security will replace less of workers’ earnings for three reasons. First, the Full Retirement Age – the age at which a worker is entitled to full benefits – has moved from 65 to 67. As a result, those who continue to retire at, say, 65 will see a cut in their monthly benefit relative to pre-retirement earnings (see Figure 1). Second, rising Medicare premiums, which are deducted before the check goes in the mail, will reduce the net Social Security benefit. Finally, more Social Security benefits will be subject to the personal income tax since the thresholds above which benefits are taxable are not adjusted for inflation or wage growth.
Employer-sponsored Plans
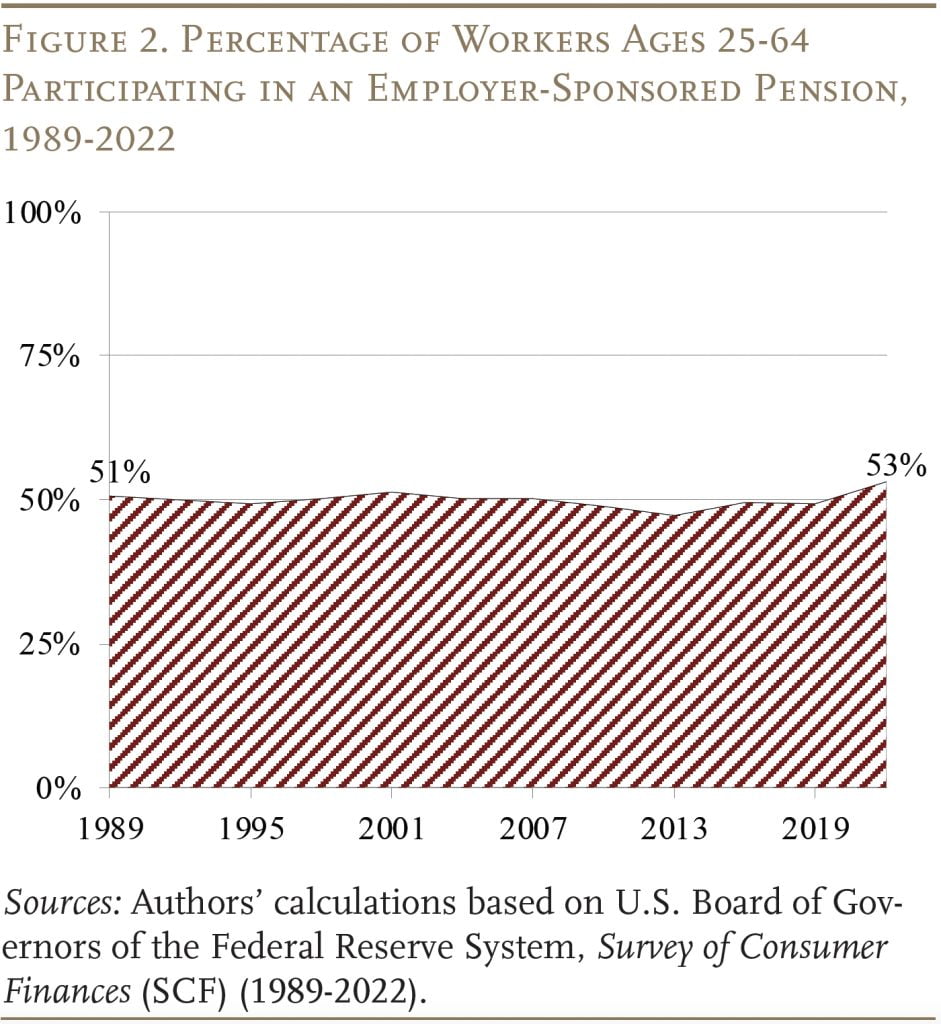
With Social Security replacing a smaller percentage of pre-retirement earnings, workers will become increasingly dependent on employer-sponsored retirement plans. Unfortunately, only about half of workers – at any moment in time – participate in either a defined benefit plan or a 401(k) plan. That percentage has remained constant for decades (see Figure 2).2For a comparison of different measures of pension participation and coverage, see Munnell, Belbase, and Sanzenbacher (2018).
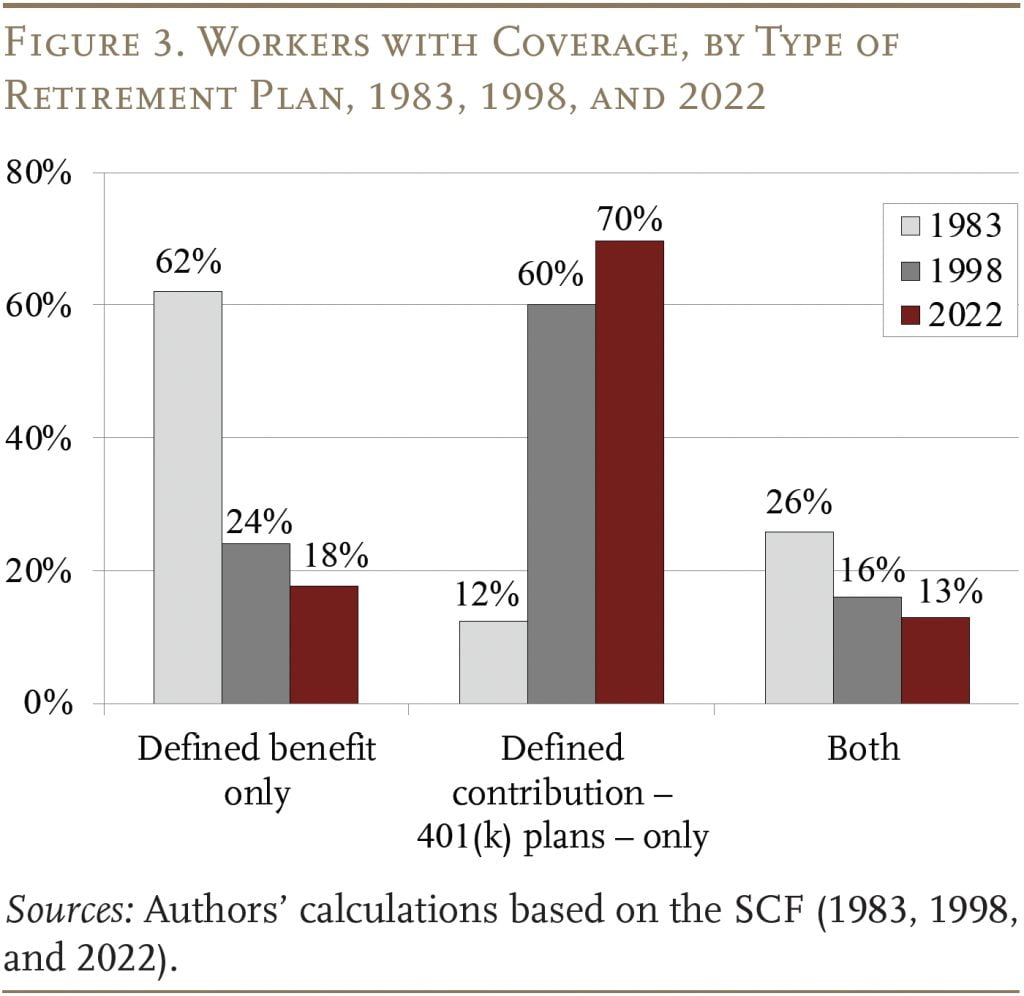
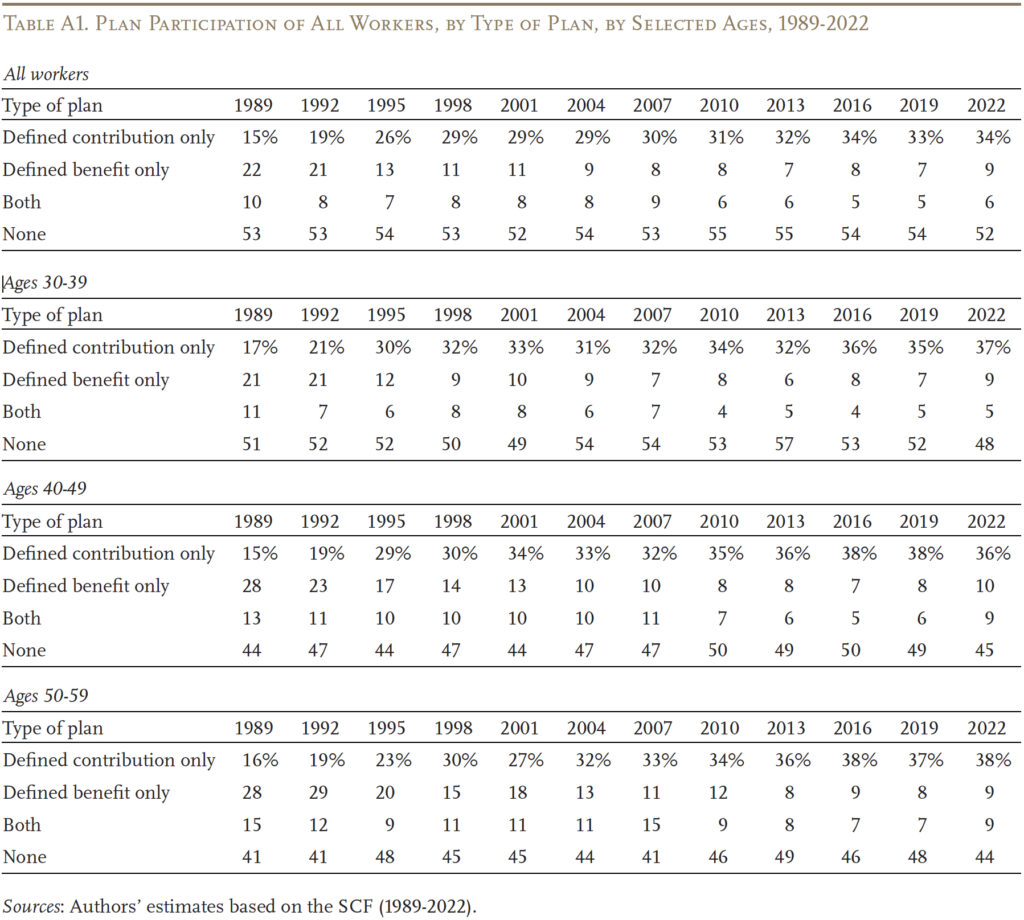
For those lucky enough to work for an employer providing a retirement plan, the nature of these plans has changed from defined benefit to 401(k) (see Figure 3).3See Appendix for trends in retirement plan participation for all workers between 1989 and 2022.
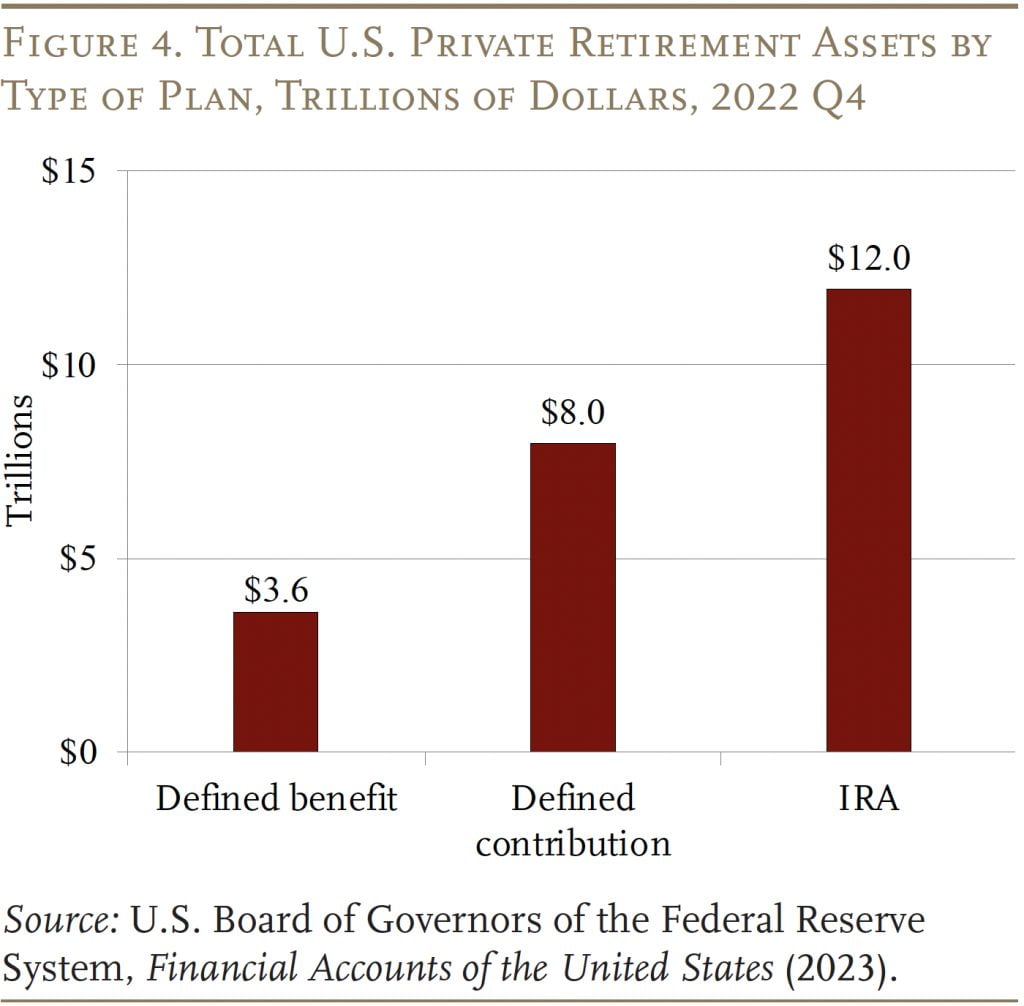
While 401(k)s plans have spread dramatically, they have essentially turned into a collection mechanism for retirement savings; participants eventually roll over the bulk of their money into IRAs. Today, IRA assets exceed those in 401(k)s by 50 percent – $12 trillion compared to $8 trillion (see Figure 4). Thus, any assessment of the current employer-sponsored retirement system requires an evaluation of how well 401(k)s collect money and how much people have in their combined 401(k)/IRA holdings.
How Well Do 401(k)s Collect Retirement Money?
401(k) plans were originally viewed as supplements to employer-funded pension and profit-sharing plans, so 401(k) participants were presumed to have their basic retirement income needs covered. As a result, participants were given substantial discretion over their 401(k) choices, including whether to participate, how much to contribute, how to invest, and when and in what form to withdraw the funds. Over time, policymakers have established guidance to put participants in the best position to accumulate retirement assets.
Participation
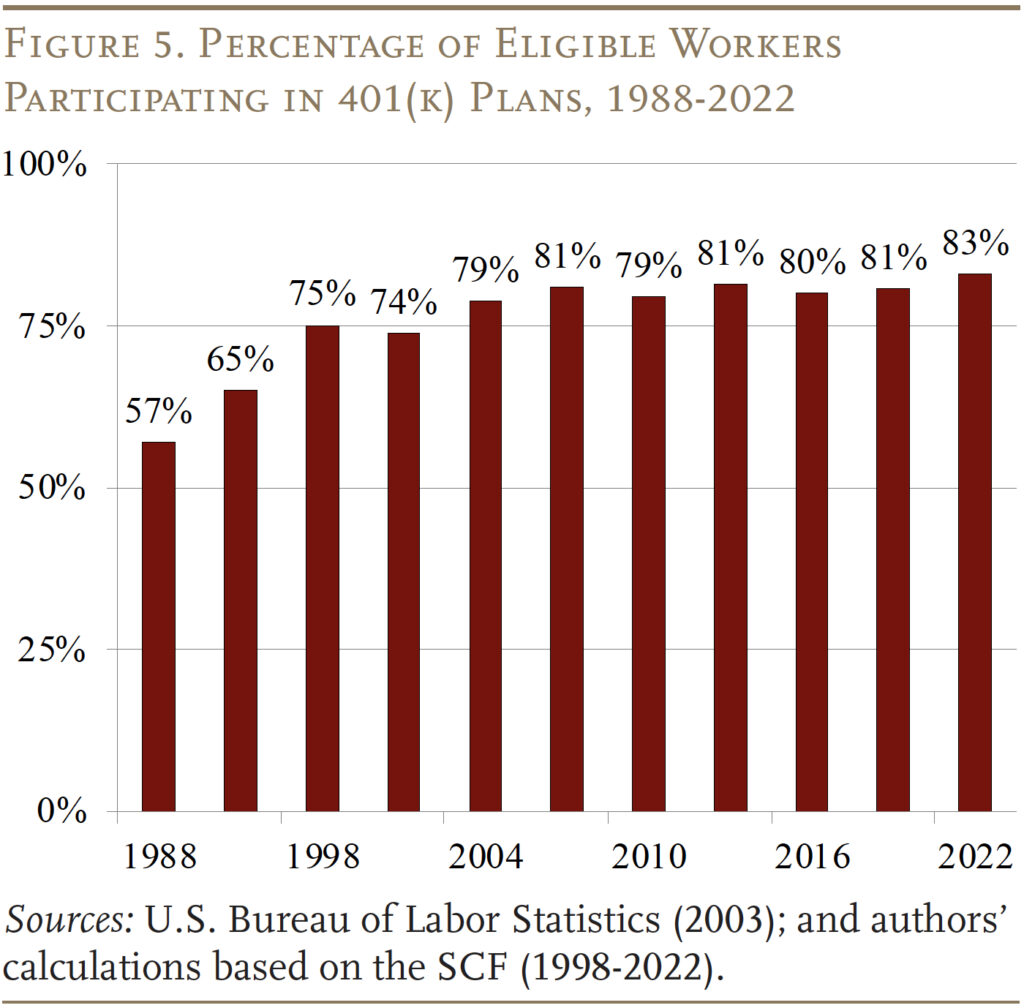
For those individuals offered a plan, success first requires that they participate. An extensive literature has demonstrated that automatically enrolling employees sharply increases participation rates.4For examples, see Nessmith, Utkus, and Young (2007), Butrica and Karamcheva (2012), Bernheim, Fradkin, and Popov (2015), Clark, Utkus, and Young (2015), and Beshears et al. (2009, 2010, 2022). In 2022, among Vanguard’s recordkeeping plans, the voluntary enrollment participation rate was 70 percent, and the auto-enrollment participation rate was 93 percent. The share of plans with auto-enrollment increased substantially in the wake of the Pension Protection Act of 2006 (PPA), and now hovers around 58 percent.5Vanguard (2023). Given the spread of plans with auto-enrollment, the upward trend in participation rates as reported in the SCF may seem modest (see Figure 5). One factor is that participation rates in plans without auto-enrollment actually declined for a while.6Vanguard reports that while participation rates at plans with auto-enrollment rose from 86 percent to 93 percent from 2010 to 2022, rates at plans without auto-enrollment fell from 70 percent to 56 percent from 2010 to 2016 but rose to 70 percent again in 2022.
Contributions
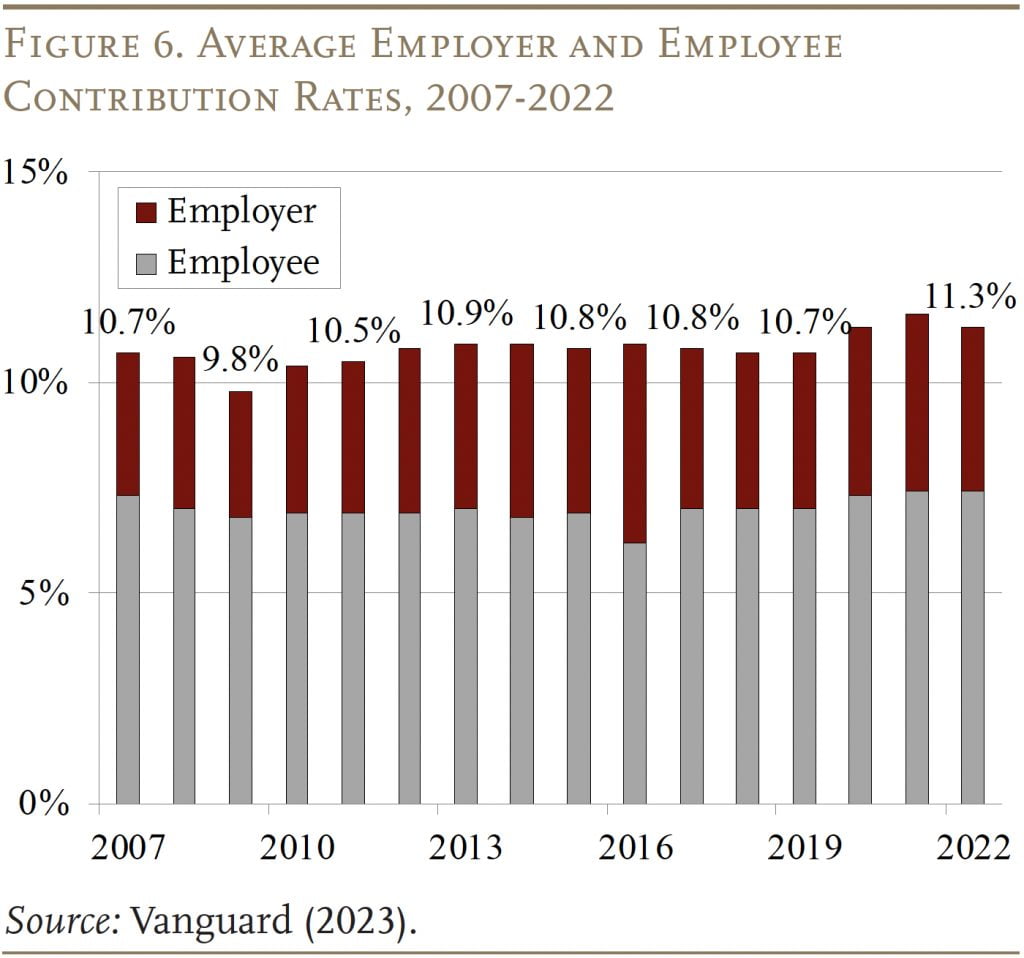
Once in the plan, participants have to decide how much to contribute. Average employee contribution rates continue to hover around 7.4 percent (see the gray bars in Figure 6). Employer contributions bring the total average deferral rate to 11.3 percent.7Median employee and employer contribution rates show the same pattern as the average rates in Figure 6. While in prior years, lower contribution rates for those automatically enrolled appeared to reduce the average, that effect no longer exists.8In 2022, Vanguard participants joining a plan under auto-enrollment had an average deferral rate of 7.3 percent, which is very close to the 7.5 percent average deferral rate for participants enrolling on a voluntary basis (Vanguard 2023).
Moving from the average contribution rate to the maximum, employees in 2022 were entitled to contribute $20,500 on a tax-deductible basis to their 401(k) plan. In addition, workers approaching retirement could contribute another $6,500 under “catch-up” provisions introduced in 2002. In 2022, 15 percent of Vanguard participants – mostly high earners – reached their limit. Since Vanguard tends to have a disproportionate number of large plans and, therefore, higher earners, the percentage maxing out is probably slightly lower for the 401(k) population as a whole.
Investment Decisions
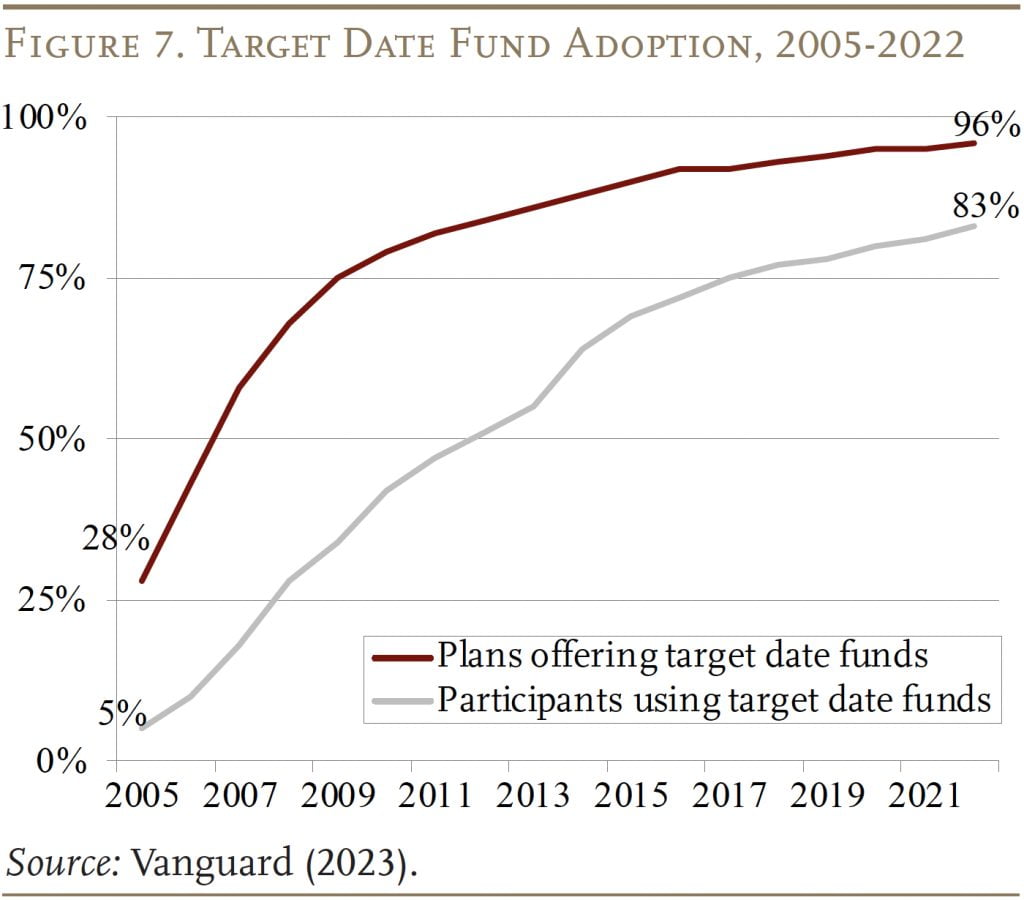
In addition to participation and contribution decisions, employees must decide how to invest their money. This process has been simplified significantly with the advent of target date funds, which ensure that investments are diversified and rebalanced over time (see Figure 7).9Historically, employers that offered auto-enrollment defaulted participants into stable value or money market funds – safe, but low-return, investments. Given inertia, most participants stayed in these investments. In response, the PPA defined a list of “qualified default investment alternatives,” which included target date funds, balanced funds, and managed accounts. Plans that use these investments as the default avoid fiduciary liability. The other benefit of these funds is that they reduce the likelihood of investing in employer stock, which helps to further diversify the participant’s portfolio both across stocks and away from the employer. According to Vanguard, only 8 percent of firms currently offer their own company’s stock in their 401(k) plans.
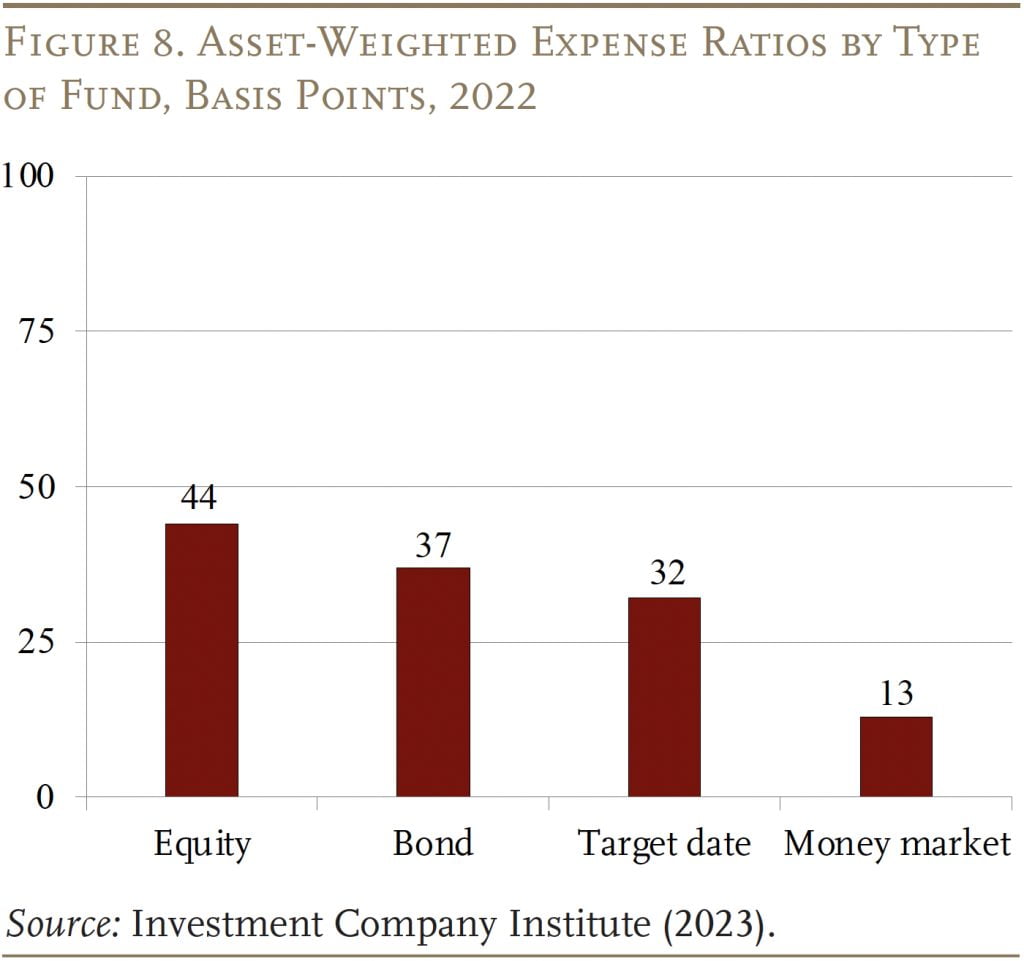
Even with the spread of target date funds, fees remain an important issue. An expense ratio of 1 percent – 100 basis points – over a 40-year worklife will reduce assets at retirement by almost 20 percent.10The calculations assume real stock and bond returns of 6.6 percent and 2.3 percent respectively, a stock asset allocation of 50 percent, 40 years of saving, and real wage growth of 1.1 percent per year. If individuals respond to the decline in projected balances by saving more, the ultimate impact on wealth at retirement will be smaller. Despite a decline over time, expense ratios on mutual funds – the primary investment vehicle in 401(k) plans – remain high. Based on how people actually invest, the expense ratio in 2022 was 44 basis points for equity funds, 37 basis points for bond funds, 32 basis points for target date funds, and 13 basis points for money market funds (see Figure 8).
Keeping Money in the Plan
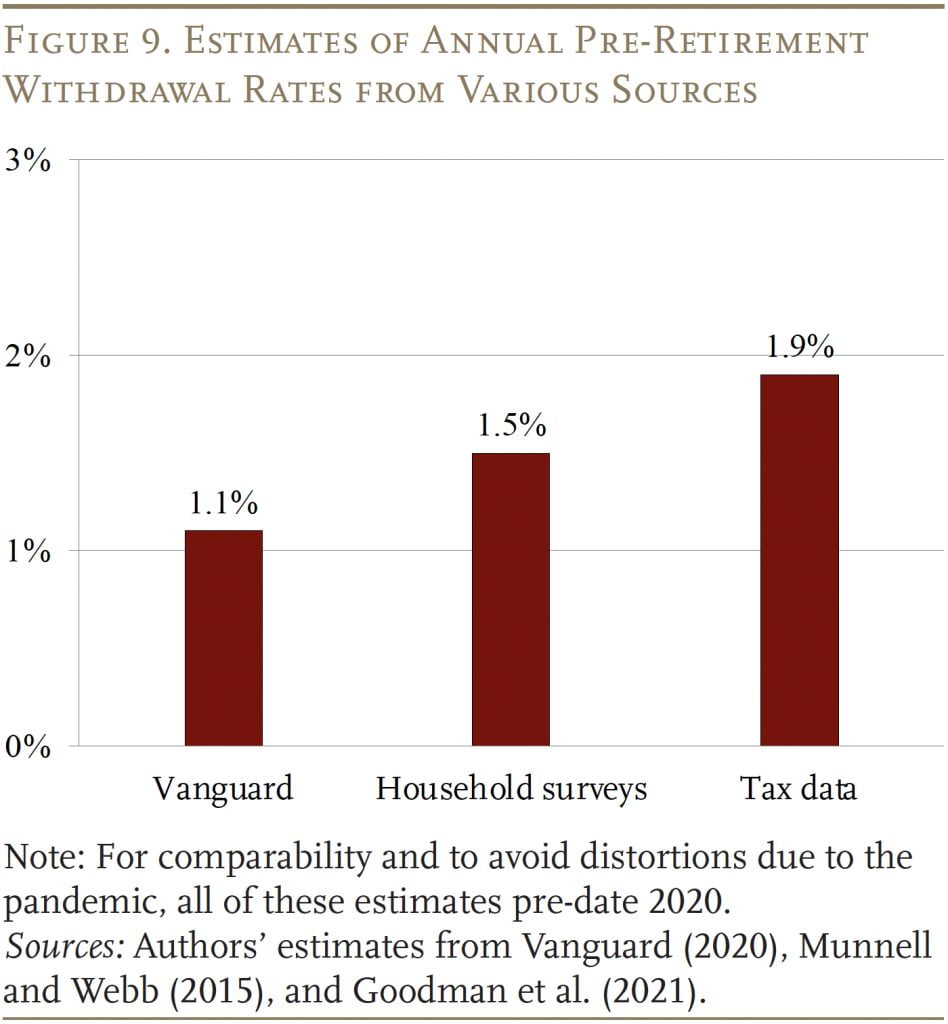
Over the last decade, researchers have undertaken a number of studies to estimate the magnitude of pre-retirement withdrawals out of 401(k)s and IRAs.11For an overview, see Munnell and Webb (2015) and most recently, see Goodman et al. (2021). For a detailed study of leakages through loan defaults, see Lu et al. (2014). In addition, Vanguard provides data on flows that make it possible to estimate a pre-retirement withdrawal rate. The Vanguard data suggest that 1.1 percent of assets are taken out each year (see Figure 9). Not surprisingly, given Vanguard’s skew towards larger plans and better-paid employees, studies based on household surveys put the withdrawal rate somewhat higher at 1.5 percent.12Biggs, Munnell, and Chen (2019), Butrica, Zedlewski, and Issa (2010) and Munnell and Webb (2015). And the most recent study using tax data suggest an even higher pre-retirement withdrawal rate.13The most recent estimate based on tax data comes from Goodman et al. (2021). It is significantly lower than earlier estimates (2.9 percent) from Argento, Bryant, and Sabelhaus (2015) because the authors exclude distributions from defined benefit accounts and distributions due to death and disability of the account holder. Pre-retirement withdrawals from cashouts at the time of a job change remain the most serious problem.
Reported 401(k) Balances: 2019 and 2022
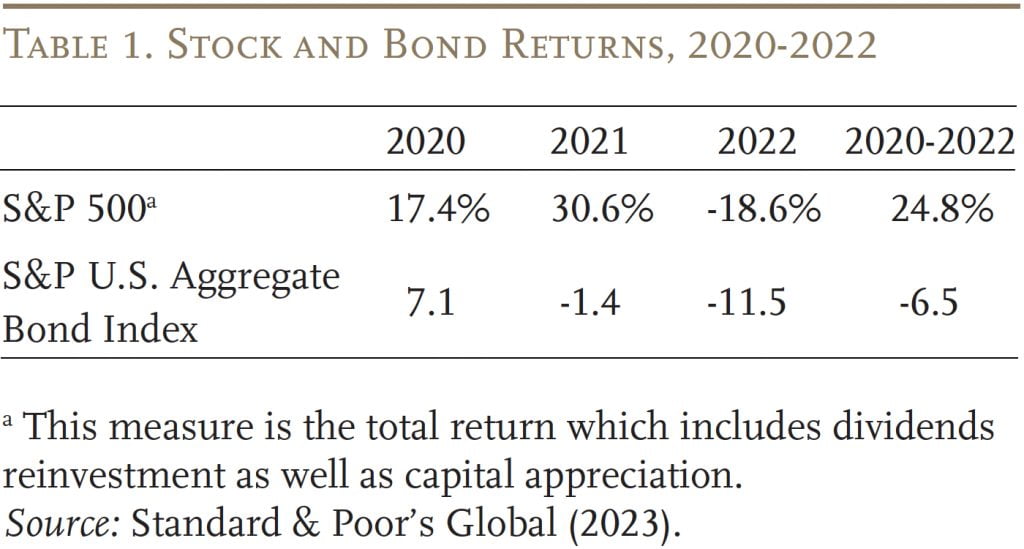
While the trends in 401(k) participation, contributions, and investments are all positive, balances also depend critically on market performance, and returns for both stocks and bonds were sharply negative in 2022 (see Table 1).
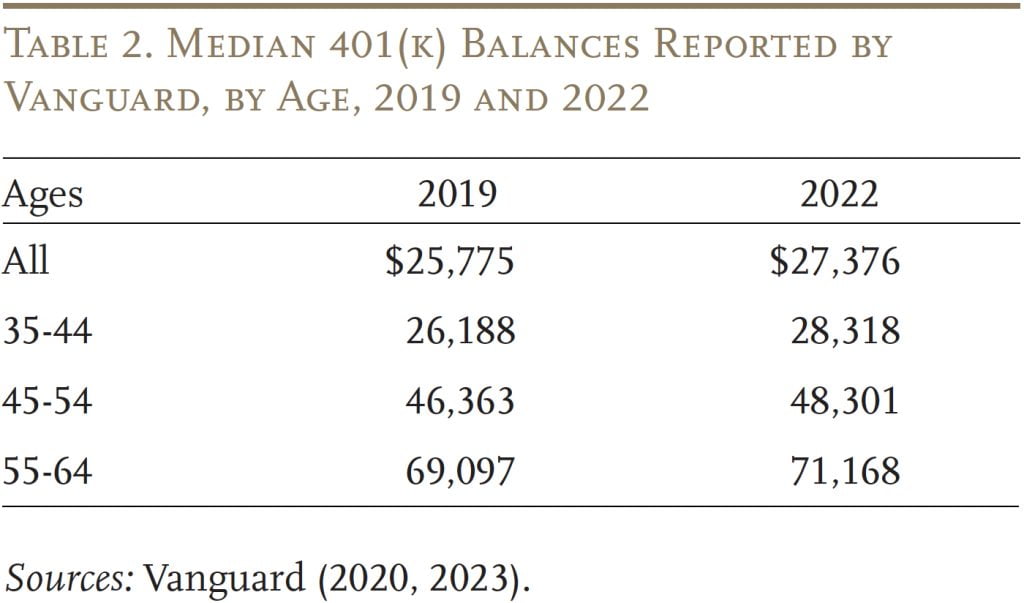
Over the period, median 401(k) balances in 2022 were only slightly higher than in 2019 in nominal terms (see Table 2). And, considering that the Consumer Price Index increased 15.5 percent from December 2019 to December 2022, median balances declined in inflation-adjusted terms.
Although these individual 401(k) balances provide a hint of what to expect in the 2022 SCF, three factors make it impossible to determine from these numbers how much money households have accumulated for retirement. First, when participants change jobs, their 401(k) accounts may remain with their old employer, so individuals may have more than one 401(k) account. Second, 401(k) balances are often rolled over to an IRA, and financial services companies cannot track combined 401(k)/IRA holdings. Third, by necessity, balances are provided on an individual, rather than a household, basis. For all these reasons, the new SCF data are crucial.
401(k)/IRA Balances in the 2022 SCF
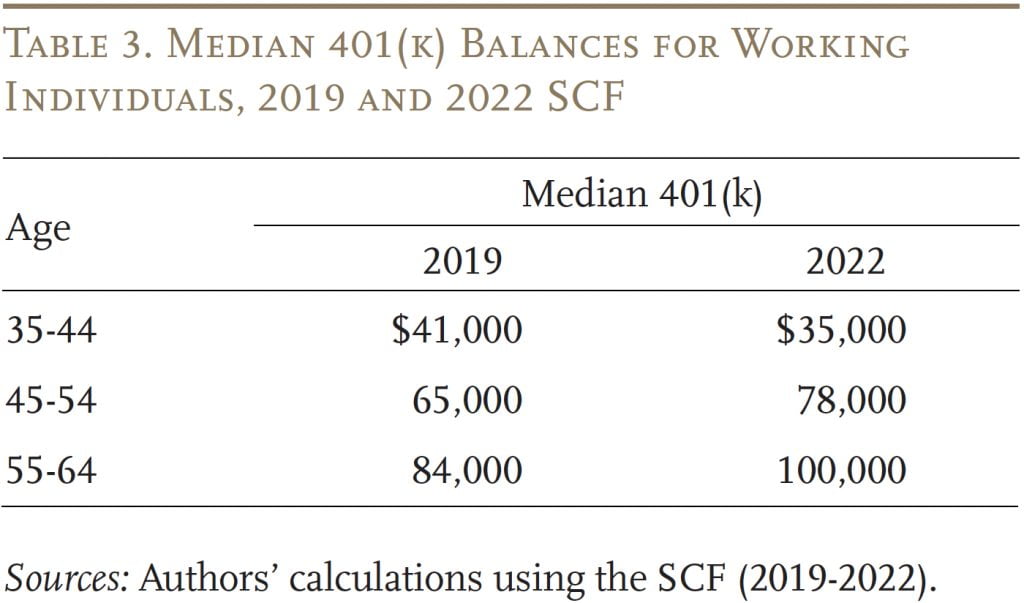
To calibrate the Federal Reserve’s 2022 SCF to the numbers from financial services firms, the best place to start is with single individuals. The SCF 401(k) balances are higher than the Vanguard numbers, most likely because they represent all the accounts held by an individual, and the pattern by age is very similar (see Table 3). For older age groups, balances increase over this period by about 20 percent, reflecting three years of contributions as well as market returns. The anomaly compared to the Vanguard data is that SCF balances for individuals ages 35-44 actually declined from 2019 to 2022.
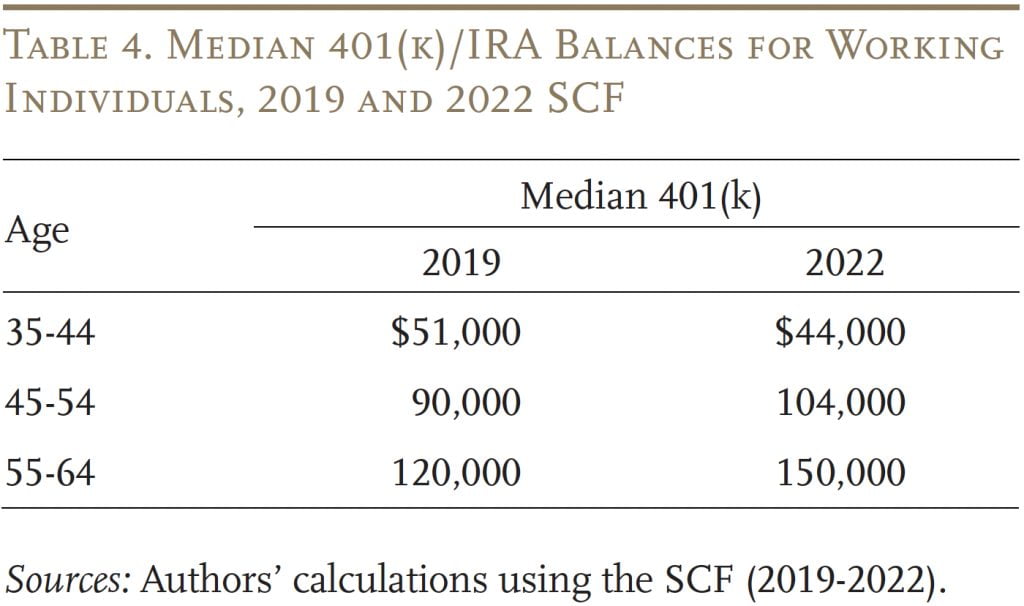
Adding IRA balances shows that focusing only on 401(k)s significantly understates retirement saving by workers. In 2022, the typical worker approaching retirement (ages 55-64) with a 401(k) had a balance of $150,000 in combined 401(k)/IRA accounts, up from $120,000 in 2019 (see Table 4). The percentage gains for the older groups are roughly comparable to those for 401(k) balances alone. Once again, balances for individuals 35-44 actually declined.
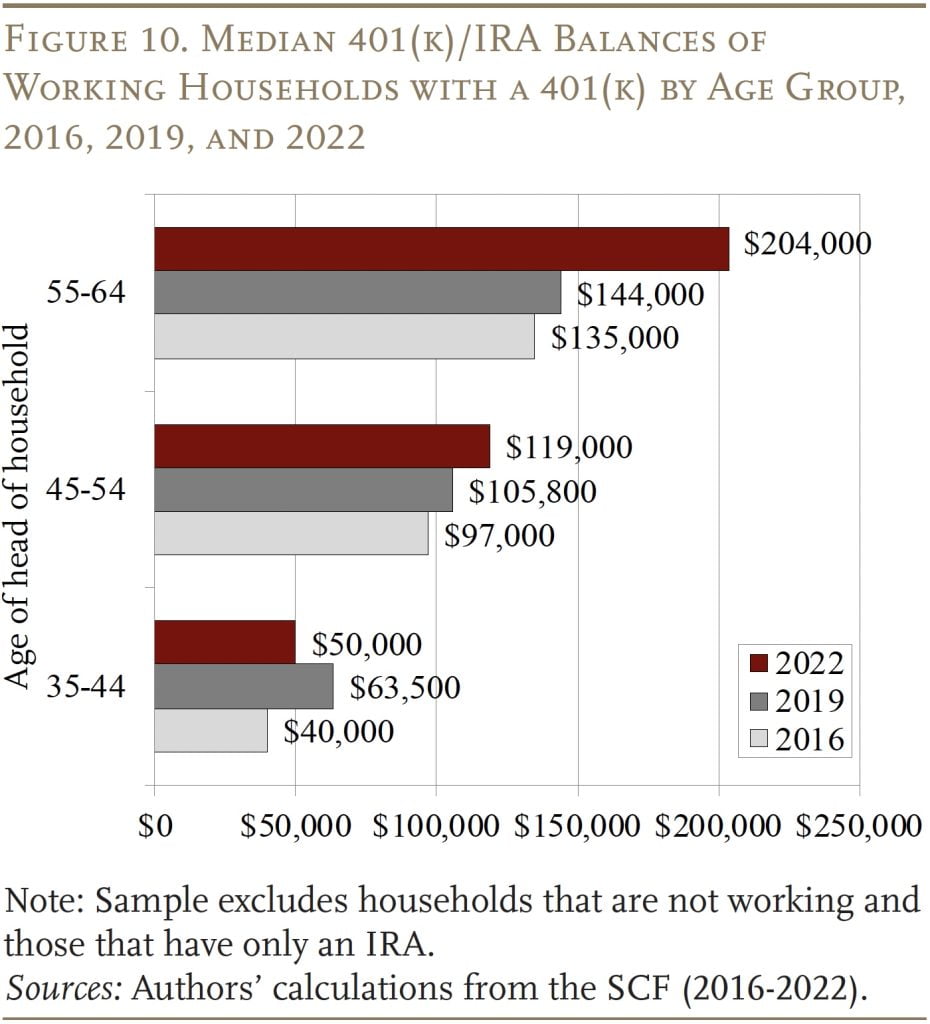
In terms of evaluating retirement security, it is important to remember that individuals live in households. In 2022, the SCF reports that the typical working household approaching retirement with a 401(k) had $204,000 in 401(k)/IRA balances (see Figure 10).14This figure differs from the value of “retirement accounts” reported in Bhutta et al. (2017) because it pertains to only those households that are working and have a 401(k) plan; those that are not working or only have an IRA are excluded. This amount compares to $144,000 in 2019 – an enormous jump. The news for younger households, however, is less rosy. The median 401(k)/IRA balances for households ages 45-54 increased only from $105,800 to $119,000 – less than the rate of inflation. And the holdings of the youngest group (35-44) actually declined.
Even the good news for the older working households needs to be put in perspective. First, the 401(k)/IRA balances for the households approaching retirement will produce a relatively modest supplement to Social Security. If the couple uses their $204,000 to buy a joint-and-survivor annuity, they will receive $1,100 per month.15This number comes from ImmediateAnnuity.com and assumes that the husband is 65 and the wife is 62, the average retirement ages for men and women, respectively. Since this amount is not indexed for inflation, its purchasing power will decline over time. Moreover, this $1,100 is likely to be the only source of additional income, because the typical household holds virtually no financial assets outside of its 401(k).16Financial assets outside of 401(k) plans made up only 2-3 percent of total assets for the typical household ages 55-64 in 2016.
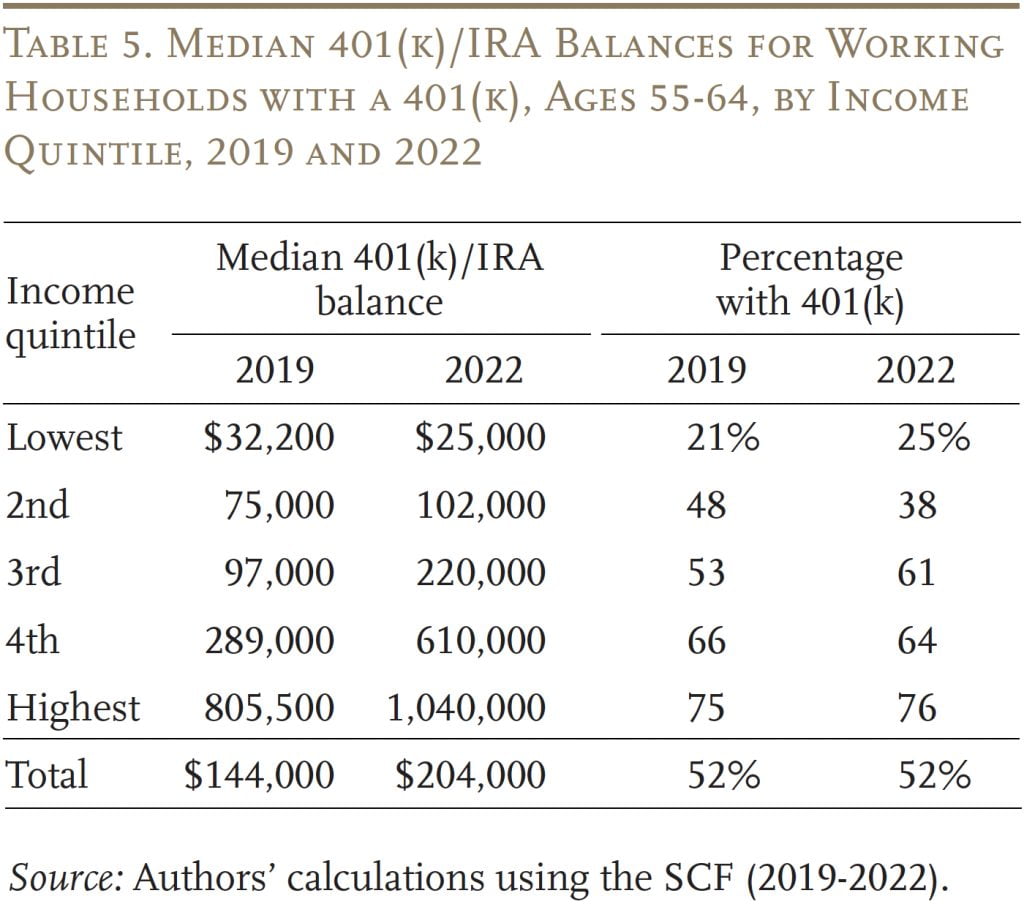
Second, the gains in 401(k)/IRA balances were not spread evenly across the income distribution of working households. The middle quintile gained not only in balances but also in the percentage of households with a 401(k) plan. That is clearly good news. Higher-income households saw even larger percentage increases in their balances, and the share of households with a plan held steady. For the bottom two quintiles, the news is not good. Either balances dropped or balances increased but the percentage with a plan dropped sharply (see Table 5).
Conclusion
401(k) plans are the collection mechanism for retirement saving, and changes over the years – auto-enrollment, target date funds, and declining fees – have greatly improved the functioning of these plans. In fact, it is hard to see how 401(k)s as structured could do a better job. Money collected in 401(k) plans is then generally rolled over to IRAs, which hold 50 percent more assets than 401(k)s. The question is how the combined system fared from 2019-2022.
The answer is not obvious, given all that was going on. The years between 2019 and 2022 included COVID, economic disruption, unprecedented fiscal support, and then a terrible year in terms of stock and bond returns. At the same time, employment remained strong, the stock market – even with the drop in 2022 – ended up significantly higher than in 2019, and the 401(k) system continued to mature.
The good news from the SCF is that 401(k)/IRA balances for older working households with a plan totaled $204,000 in 2022, compared to $144,000 for comparable households in 2019. The bad news is that only half of older households had a 401(k) plan, and the gains occurred among higher-income households while the situation for the bottom 40 percent deteriorated. Moreover, in contrast to older households, the balances of households 45-54 failed to keep pace with inflation and those of households 35-44 declined in nominal terms. In short, the 2022 SCF provides a disappointing picture of the retirement assets for the half of working households lucky enough to have a retirement plan. The other half of households do not have a retirement plan and will have to rely solely on Social Security. Ensuring the solvency of Social Security is clearly a high priority.
References
Argento, Roberto, Victoria L. Bryant, and John Sabelhaus. 2013. “Early Withdrawals from Retirement Accounts.” Finance and Economics Discussion Series Paper 2013-22. Washington, DC: U.S. Board of Governors of the Federal Reserve System.
Bernheim, Douglas B., Andrey Fradkin, and Igor Popov. 2015. “The Welfare Economics of Default Options in 401(k) Plans.” American Economic Review 105(9): 2798-2837.
Beshears, John, James J. Choi, David Laibson, and Brigitte C. Madrian. 2010. “The Impact of Employer Matching on Savings Plan Participation under Automatic Enrollment.” In Research Findings in the Economics of Aging, edited by David A. Wise, 311- 327. Chicago, IL: University of Chicago Press.
Beshears, John, James J. Choi, David Laibson, and Brigitte C. Madrian. 2009. “The Importance of Default Options for Retirement Saving Outcomes: Evidence from the United States.” In Social Security Policy in a Changing Environment, edited by Jeffrey Brown, Jeffrey Liebman, and David A. Wise, 167-195. Chicago, IL: University of Chicago Press.
Beshears, John, James J. Choi, David Laibson, Brigitte C. Madrian, and William L. Skimmyhorn. 2022. “Borrowing to Save? The Impact of Automatic Enrollment on Debt.” Journal of Finance 77(1): 403-447.
Bhutta, Neil, Jesse Bricker, Andrew C. Chang, Lisa J. Dettling, Sarena Goodman, Joanne W. Hsu, Kevin B. Moore, Sarah Reber, Alice Henriques Volz, and Richard A. Windle, of the Board’s Division of Research and Statistics, prepared this article with assistance from Kathy Bi, Jacqueline Blair, Julia Hewitt, and Dalton Ruh. 2020. “Changes in U.S. Family Finances from 2016 to 2019: Evidence from the Survey of Consumer Finances.” Federal Reserve Bulletin 100(4): 1-41.
Biggs, Andrew G., Alicia H. Munnell, and Anqi Chen. 2019. “Why Are 401(k)/IRA Balances Substantially Below Potential?” Working Paper 2019-14. Chestnut Hill, MA: Center for Retirement Research at Boston College.
Bryant, Victoria L., Sarah Holden, and John Sabelhaus. 2011. “Qualified Retirement Plans: Analysis of Distribution and Rollover Activity.” Working Paper 2011-01. Philadelphia, PA: Pension Research Council.
Butrica, Barbara A. and Nadia S. Karamcheva. 2012. “Automatic Enrollment, Employee Compensation, and Retirement Security.” Working Paper 2012-25. Chestnut Hill, MA: Center for Retirement Research at Boston College.
Butrica, Barbara A., Sheila R. Zedlewski, and Philip Issa. 2010. “Understanding Early Withdrawals from Retirement Accounts.” The Retirement Policy Program, Discussion Paper 10-02. Washington, DC: Urban Institute.
Centers for Medicare & Medicaid Services. 2023. Annual Medicare Trustees Report. Washington, DC.
Clark, Jeffrey W., Stephen P. Utkus, and Jean A. Young. 2015. “Automatic Enrollment: The Power of the Default.” Valley Forge, PA: Vanguard.
Goodman, Lucas, Jacob Mortenson, Kathleen Mackie, and Heidi Schramm. 2021. “Leakage from Retirement Savings Accounts in The United States.” National Tax Journal 74(3): 689-719.
Investment Company Institute. 2023. “2022 Investment Company Fact Book.” Washington, DC.
Lu, Timothy (Jun), Olivia S. Mitchell, Stephen P. Utkus, and Jean A. Young. 2014. “Borrowing from the Future: 401(k) Plan Loans and Defaults.” Working Paper 2014-01. Philadelphia, PA: Pension Research Council.
Munnell, Alicia H. and Anthony Webb. 2015. “The Impact of Leakages from 401(k)s and IRAs.” Working Paper 2015-2. Chestnut Hill, MA: Center for Retirement Research at Boston College.
Munnell, Alicia H., Anek Belbase, and Geoffrey T. Sanzenbacher. 2018. “An Analysis of Retirement Models to Improve Portability and Coverage.” Special Report. Chestnut Hill, MA: Center for Retirement Research at Boston College.
Nessmith, William E., Stephen P. Utkus, and Jean A. Young. 2007. “Measuring the Effectiveness of Automatic Enrollment.” Volume 31. Valley Forge, PA: Vanguard Center for Retirement Research.
Plan Sponsor Council of America. 2013, 2016. 56th and 59th Annual Surveys of Profit Sharing and 401(k) Plans. Chicago, IL.
Standard & Poor’s Global. 2023. “Dow Jones Indices.” New York, NY.
U.S. Board of Governors of the Federal Reserve System. 2023. Financial Accounts of the United States. Washington, DC.
U.S. Board of Governors of the Federal Reserve System. Survey of Consumer Finances, 1983-2022. Washington, DC.
U.S. Bureau of Labor Statistics. 2003. Labor Force Statistics from the Current Population Survey. Washington, DC.
U.S. Census Bureau. Current Population Survey, 1980- 2023. Washington, DC.
U.S. Social Security Administration. 2023. The Annual Report of the Board of Trustees of the Federal Old-Age and Survivors Insurance and Federal Disability Insurance Trust Funds. Washington, DC: U.S. Government Printing Office.
Vanguard. 2020, 2023. “How America Saves: A Report on Vanguard DC Plan Data.” Valley Forge, PA: Vanguard Institutional Investor Group.
Appendix
Endnotes
- 1This brief generally covers assets in all defined contribution plans but refers to them as 401(k)s for simplicity.
- 2For a comparison of different measures of pension participation and coverage, see Munnell, Belbase, and Sanzenbacher (2018).
- 3See Appendix for trends in retirement plan participation for all workers between 1989 and 2022.
- 4For examples, see Nessmith, Utkus, and Young (2007), Butrica and Karamcheva (2012), Bernheim, Fradkin, and Popov (2015), Clark, Utkus, and Young (2015), and Beshears et al. (2009, 2010, 2022). In 2022, among Vanguard’s recordkeeping plans, the voluntary enrollment participation rate was 70 percent, and the auto-enrollment participation rate was 93 percent
- 5Vanguard (2023).
- 6Vanguard reports that while participation rates at plans with auto-enrollment rose from 86 percent to 93 percent from 2010 to 2022, rates at plans without auto-enrollment fell from 70 percent to 56 percent from 2010 to 2016 but rose to 70 percent again in 2022.
- 7Median employee and employer contribution rates show the same pattern as the average rates in Figure 6.
- 8In 2022, Vanguard participants joining a plan under auto-enrollment had an average deferral rate of 7.3 percent, which is very close to the 7.5 percent average deferral rate for participants enrolling on a voluntary basis (Vanguard 2023).
- 9Historically, employers that offered auto-enrollment defaulted participants into stable value or money market funds – safe, but low-return, investments. Given inertia, most participants stayed in these investments. In response, the PPA defined a list of “qualified default investment alternatives,” which included target date funds, balanced funds, and managed accounts. Plans that use these investments as the default avoid fiduciary liability.
- 10The calculations assume real stock and bond returns of 6.6 percent and 2.3 percent respectively, a stock asset allocation of 50 percent, 40 years of saving, and real wage growth of 1.1 percent per year. If individuals respond to the decline in projected balances by saving more, the ultimate impact on wealth at retirement will be smaller.
- 11For an overview, see Munnell and Webb (2015) and most recently, see Goodman et al. (2021). For a detailed study of leakages through loan defaults, see Lu et al. (2014).
- 12Biggs, Munnell, and Chen (2019), Butrica, Zedlewski, and Issa (2010) and Munnell and Webb (2015).
- 13The most recent estimate based on tax data comes from Goodman et al. (2021). It is significantly lower than earlier estimates (2.9 percent) from Argento, Bryant, and Sabelhaus (2015) because the authors exclude distributions from defined benefit accounts and distributions due to death and disability of the account holder.
- 14This figure differs from the value of “retirement accounts” reported in Bhutta et al. (2017) because it pertains to only those households that are working and have a 401(k) plan; those that are not working or only have an IRA are excluded.
- 15This number comes from ImmediateAnnuity.com and assumes that the husband is 65 and the wife is 62, the average retirement ages for men and women, respectively.
- 16Financial assets outside of 401(k) plans made up only 2-3 percent of total assets for the typical household ages 55-64 in 2016.


Chen, Anqi and Alicia H. Munnell. 2023. "401(k)/IRA Holdings in 2022: An Update from the SCF" Issue in Brief 23-25. Chestnut Hill, MA: Center for Retirement Research at Boston College.