Closing the Coverage Gap

The Problem
The main reason that U.S. workers end up with inadequate retirement savings is that, at any given time, only about half of workers ages 25-64 are participating in an employer-sponsored pension, mostly due to a lack of coverage (see Figure 1).
Figure 1. Percentage of Workers Ages 25-64 Participating in an Employer-Sponsored Pension, 1989-2022
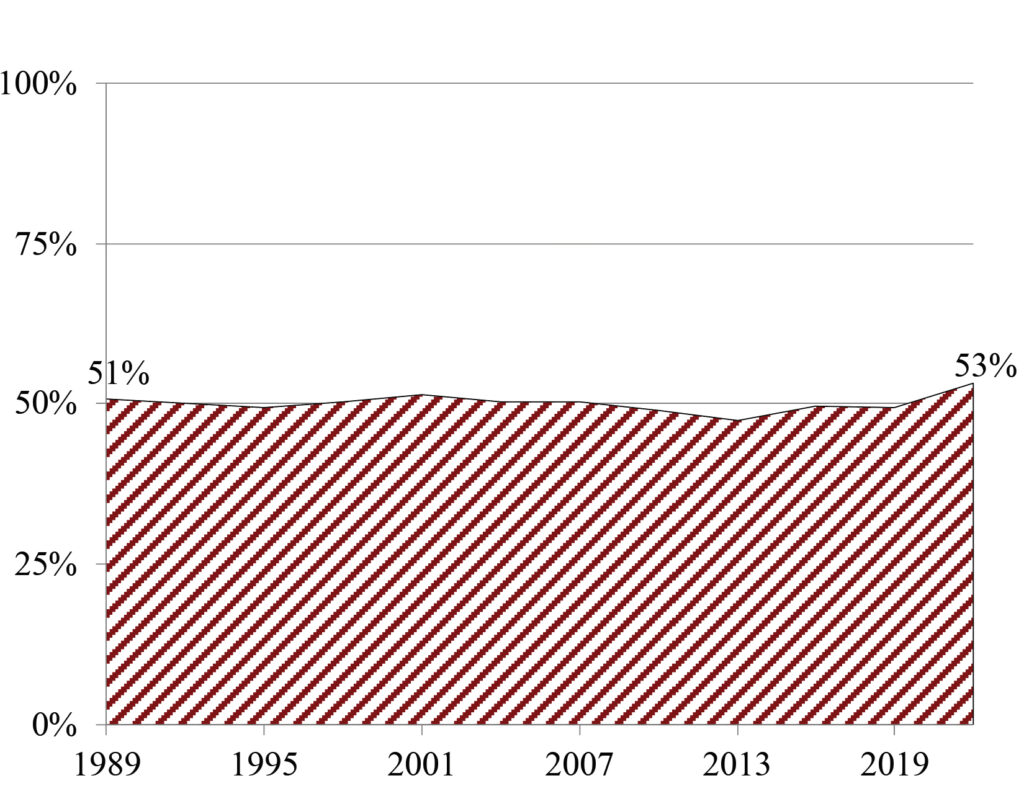
Source: CRR estimates based on U.S. Board of Governors of the Federal Reserve System, Survey of Consumer Finances (1989-2022).
Workers can be uncovered in three ways: 1) their employer does not offer a plan; 2) their employer does offer a plan, but they are not included; or 3) they are self-employed. The first group accounts for three-quarters of all uncovered workers (see Figure 2). Initiatives to close the coverage gap generally focus on expanding coverage to the first group, but some also aim to eventually include the other groups.
Figure 2. Uncovered Workers by Reason Uncovered, 2024
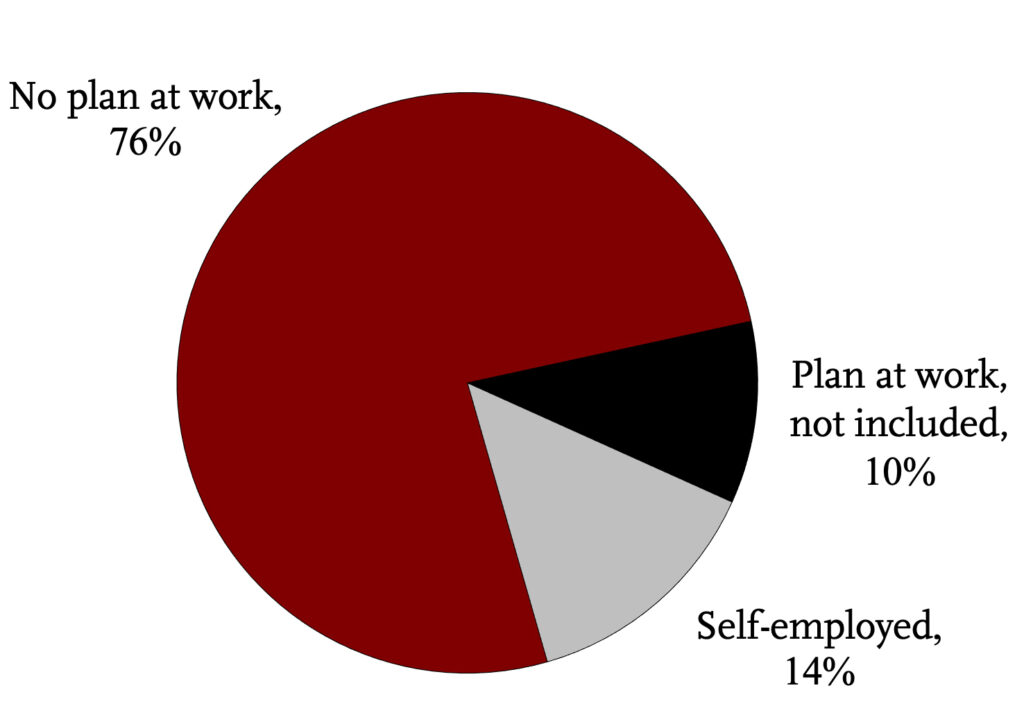
Source: CRR analysis from U.S. Census Bureau, Current Population Survey Annual Social and Economic Supplement (2025).
Federal Initiatives
At the federal level, several initiatives to address the coverage gap have been enacted over the years (see Table 1). These programs have relied on the voluntary participation of employers and therefore have had little impact.
Table 1. Federal Provisions Enacted to Address the Coverage Gap Since 1975
| Year | Provision |
| 1978- | SEP |
| 1996- | SIMPLE-IRA |
| 1999- | Payroll deduction IRA |
| 2001- | Small business tax credit |
| 2014-2018 | myRA |
| 2019- | “Open” MEP |
| 2022- | Starter 401(k) |
Source: CRR analysis of Internal Revenue Service (2022).
→ Learn More about Enacted Federal Provisions
Legislative proposals for mandatory programs are more likely the answer (see Table 2).
Table 2. Recent Federal Proposals to Close the Coverage Gap
| Year | Provision |
| 2009-2016 | The President’s budget included a national auto-IRA plan, conceptually similar to those that the states have adopted. |
| 2014 | USA Retirement Funds Act (S.1979) |
| 2016 | SAVE UP Act (H.R.5731) |
| 2017 | Automatic Retirement Plan Act of 2017 (H.R.4523) |
| 2019 | Automatic IRA Act of 2019 (S.2370) |
| 2021 | Automatic IRA provision (H.R. 5376: Build Back Better Act) |
| 2025 | Retirement Savings for Americans Act of 2025 (H.R.2696, S.1526) |
| 2025 | Automatic IRA Act of 2025 (H.R. 6722) |
Source: CRR analysis.
→ Learn More about Federal Proposals
State Initiatives
In the absence of meaningful federal action, states have seized the issue (see Figure 3). The inclusion of a mandate for employers is a significant differentiator for state programs. Mandatory auto-IRAs require employers without a retirement plan to auto-enroll their employees in an Individual Retirement Account (IRA). Voluntary programs, which involve “marketplaces,” multiple employer 401(k)s, and voluntary auto-IRAs, allow the employer to choose whether to participate (see Table 3).
Figure 3. State Initiatives to Address the Coverage Gap, as of June 2026
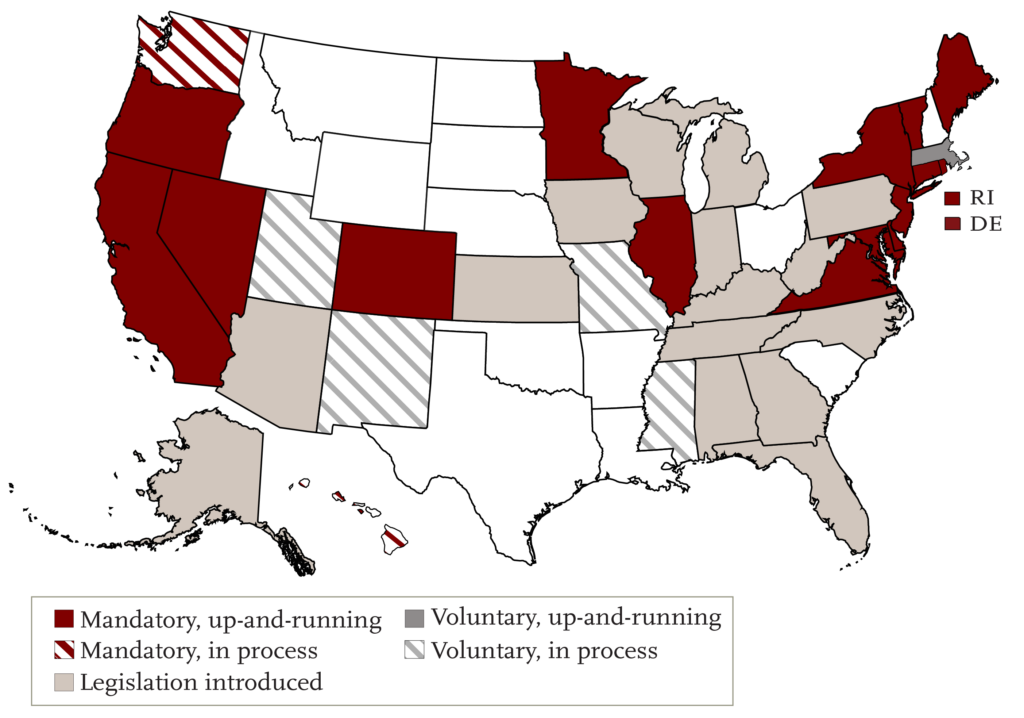
Source: Adapted from Georgetown Center for Retirement Initiatives (2026).
Table 3. Types of State Programs, by Account Type and Employer Role
| Employer role | IRA | 401(k) |
| Mandatory | Mandatory auto-IRAs (CA, CO, CT, DE, HI, IL, MDa, ME, MN, NJ, NV, NY, OR, RI, VA, VT, WA) | |
| Voluntary | Voluntary for employers (NMb, MS) | Retirement marketplaces (NM, UT, WA) Multiple Employer Plans (MA, MO) |
a Maryland’s legislation requires employers without a plan to auto-enroll their employees, but imposes no penalties for failing to do so. Instead, it allows participating employers to avoid the annual $300 filing fee that ordinarily applies to businesses in Maryland.
b Once an employer decides to adopt the program, workers are automatically enrolled.
Source: CRR analysis.
The early adopters of mandatory programs are showing potential (see Table 4). In contrast, voluntary programs have virtually no impact.
Table 4. Key Metrics of Early Auto-IRA Adopters, as of March 31, 2026
| State | Initial rollout period | Status |
| Oregon | 2017-2021 | ➤ 8,340 employers facilitating payroll in last 90 days ➤ 151,306 workers with assets ➤ $453.8 million in assets |
| Illinois | 2018-2020 | ➤ 8,163 employers facilitating payroll in last 90 days ➤ 169,745 workers with assets ➤ $316.9 million in assets |
| California | 2019-2022 | ➤ 51,328 employers facilitating payroll in last 90 days ➤ 629,324 workers with assets ➤ $1.6 billion in assets |
| Connecticut | 2022-2023 | ➤ 3,003 employers facilitating payroll in last 90 days ➤ 37,641 workers with assets ➤ $62.1 million in assets |
| Maryland | 2022-2023 | ➤ 1,990 employers facilitating payroll in last 90 days ➤ 18,339 workers with assets ➤ $29.9 million in assets |
Sources: OregonSaves monthly dashboard, Office of the State Treasurer (2026); Illinois Secure Choice performance dashboards, Office of the State Treasurer (2026); CalSavers reports, Office of the State Treasurer (2026); Connecticut Retirement Security Program reports (2026); and Maryland Small Business Retirement Savings Board reports (2026).
CRR Reports on State Initiatives
Other Resources
Georgetown University’s Center for Retirement Initiatives
Massena Associates
Pew Retirement Savings Policy Initiatives
Publications