Social Security in the Cross Hairs: Replacement Rates Again
Alicia H. Munnell is a columnist for MarketWatch and senior advisor of the Center for Retirement Research at Boston College.
CBO suggests that Social Security is getting more generous every day.
The stage is being set for cuts in Social Security, and the Congressional Budget Office (CBO) has become a major player in this effort. The agency’s most recent report shows not only a huge increase in the 75-year deficit, but also an enormous increase in the generosity of the program as measured by replacement rates – benefits relative to pre-retirement earnings. None of the changes that increase the deficit – lower interest rates, higher incidence of disability, longer life expectancy, and a lower share of taxable earnings – should have any major effect on replacement rates. CBO has simply been revising its methodology each year in ways that produce higher numbers.
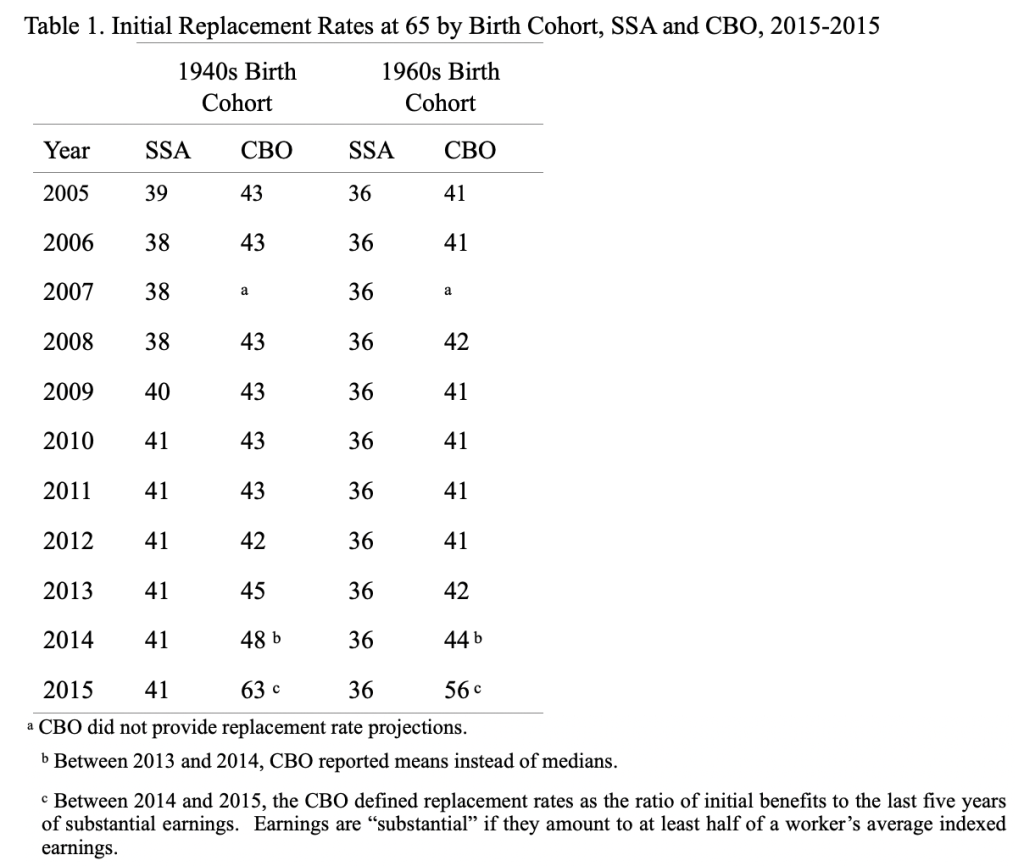
Table 1 compares the replacement rates reported by the Social Security Administration’s (SSA) actuaries with those reported by CBO for the period 2005-15. The CBO reports replacement rates for workers claiming at age 65 for those born in various cohorts; the table shows the numbers for those born in the 1940s and 1960s. For comparability, the SSA replacement rates refer to workers born in 1945 and 1965 who also claim at 65. The CBO replacement rate refers to the middle fifth of individuals arrayed by household income. The SSA replacement rate is for a hypothetical worker with career average earnings. The SSA replacement rates are lower for those born in 1965 than in 1945 because the Full Retirement Age will have increased from 65 to 67, reducing replacement rates at age 65.

Between 2005 and 2013, the pattern between the SSA and CBO replacement rates remained relatively stable; SSA rates were a few percentage points lower. The reason for the lower replacement rates is that SSA’s “hypothetical medium earner” turns out be to about the 56th percentile, rather than the 50th percentile, of the lifetime earnings distribution. With a progressive benefit formula, workers higher up the earnings distribution receive lower replacement rates. The bottom line is that the two agencies were telling the same story.
Then all hell broke loose! Between 2013 and 2014, the CBO decided to report means instead of medians. The medians had reflected the amount for a person in the middle of a 10-year birth cohort or in the middle of an earnings quintile, which makes the number comparable to the SSA replacement rate. The mean reflects the amounts received by everyone in the group, not just those in the middle. The rationale for switching does not seem very compelling.
In any event, the mean/median issue is small potatoes compared to the change made between 2014 and 2015. Instead of computing replacement rates as the ratio of initial benefits to lifetime earnings adjusted for wage growth, the CBO related initial benefits to the average of the last five years of substantial earnings before age 62. And as you can see in Table 1, the CBO replacement rates jump to 63 percent for the 1940s cohort and to 56 percent for the 1960s cohort.
Suddenly, the CBO is telling a very different story than SSA and a very different story than its own numbers in the past. The change in the metric would not be expected to provide such a different answer as work by the Social Security actuaries using claimant data has shown. Putting out such a high number without any effort to reconcile it with the historical data is irresponsible. And those waiting for an opportunity to show that Social Security is excessively generous have pounced on the new CBO replacement rate number and publicized it in op-eds from coast-to-coast.
Social Security is the backbone of the nation’s retirement system. Its finances need to be treated more thoughtfully.


