Social Security in the Cross Hairs: Replacement Rates One Last Time
Alicia H. Munnell is a columnist for MarketWatch and senior advisor of the Center for Retirement Research at Boston College.
CBO lowers its 2015 replacement rate numbers.
The Congressional Budget Office (CBO) produced a report in December that showed Social Security is very expensive – a huge 75-year deficit – and very generous – extraordinarily high benefits relative to pre-retirement earnings (replacement rates). These two developments together could set the stage for cutting back on Social Security – something this country can ill afford given that the typical household approaching retirement has only $111,000 combined in 401(k) and IRA accounts. And those with 401(k)s are the lucky ones; one third of households will be forced to rely on Social Security alone.
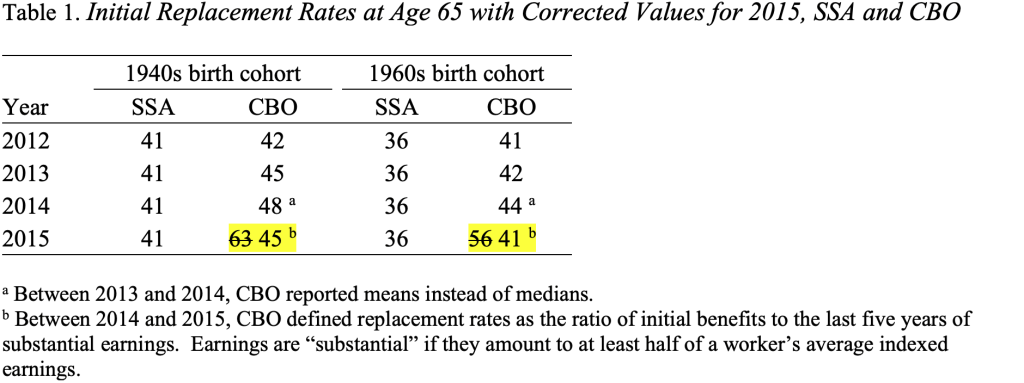
CBO’s measure of generosity was clearly problematic, as it acknowledged last week when it announced a correction to its estimates. In its initial erroneous estimates for 2015, CBO’s replacement rates jumped dramatically to extraordinary levels, suggesting that the average worker receives benefits equal to about 60 percent of pre-retirement earnings rather than about 40 percent as it had reported for the past decade (see Table 1).
The major change in 2015 was to switch the calculation of replacement rates from a) the ratio of initial benefits to average lifetime earnings adjusted for wage growth to b) the ratio of initial benefits to the average of the last five years of substantial earnings before age 62 adjusted for price growth.
But such a change in concept should not have led to such a large change in replacement rates. It turns out that CBO’s high replacement rates were the result of an error that included years of low and zero earnings in the calculation. The new, corrected replacement rates are now consistent with the agency’s previous estimates.

The reason that I was so sure that CBO’s estimates made no sense is that the Social Security actuaries analyzed a random sample of 200,000 workers claiming benefits in 2011 using a variety of definitions of replacement rates and came up with results that were highly consistent across definitions (see Table 2). (Because the average retirement age for the actual claimants was 63.75, the replacement rates are lower than those in Table 1 for hypothetical workers retiring at 65.)

As the table shows, at the median, the replacement rate is not sensitive to the definition of pre-retirement income. The first row shows the replacement rate using the highest 35 years of career average earnings indexed by wages. This measure is similar to the concept used by CBO for the past decade. The next two lines show the replacement rates when the denominator is the last 5 years of non-zero earnings indexed by wages and then by prices. Regardless of the index used, the replacement rate based on the last five years is almost identical to that based on career average earnings indexed by wages. The Table also shows that it is possible to get very high replacement rates when including years with zero earnings. That is what happened at CBO.
CBO should be commended for owning up to its error. Researchers can make mistakes despite their best efforts. But errors often produce red flags, and the agency initially ignored both the huge disconnect between its 2015 replacement rates and those of earlier years and the careful study based on actual earnings histories by the Social Security actuaries. Tossing incendiary numbers into a charged political debate was not helpful.
Thank you CBO for fixing it.


