
How Do Older Households React to Inflation?

The brief’s key findings are:
- Without any behavioral response, high inflation generally harms older households by reducing their consumption and wealth.
- But new survey data show that people do respond:
- many near retirees and retirees cut back saving and tap existing assets;
- and they rarely work longer or change their asset allocation.
- Overall, these actions help prop up consumption today, but leave them with less wealth for consumption tomorrow.
Introduction
U.S. inflation peaked at 8.9 percent in June 2022, and, while the rate has declined substantially since then, inflation still remains an important concern. That concern is justified in that the first brief in this two-part series – as well as numerous other studies – have shown that inflation harms older households by both reducing their consumption and diminishing their wealth. Most researchers, however, do not consider how households react to inflation and how those reactions could affect their outcomes.
This brief builds on the scenario analysis in the first brief by including behavioral responses when looking at the effect of inflation on consumption and wealth of near retirees and retirees.1The first brief is Aubry and Quinby (2024a). Both briefs are based on two recent papers, Aubry and Quinby (2024b and 2024c), which describe the methodology in detail. The behavioral responses come from a new survey that explores how older households reacted to recent inflation – in terms of labor supply, saving, and asset allocation. These responses are incorporated into the scenario analysis to provide a more complete picture of the impact of inflation on the consumption and wealth of older households.
The discussion proceeds as follows. The first section briefly recaps the main findings from the scenario analysis in the first brief. The second section describes the survey, which shows that a significant portion of both near retirees and retirees reduce new saving and increase withdrawals from existing accounts, but only a few near retirees delay their planned retirement. Interestingly, older households do not adjust their asset allocation in response to inflation to any meaningful extent. The third section incorporates reduced saving and increased withdrawals into the scenario analysis, showing that these behaviors offset the drop in consumption caused by inflation. This improvement in consumption is not costless, however, since households end up with significantly less wealth at the end of the period. The final section concludes that households may still be able to catch up on saving – but will they do so?
Recap of Scenario Analysis (w/out Behavioral Responses)
The first brief estimated the impact of inflation on the finances of near retirees (head ages 55-62) and retirees (head ages 62 and older) from 2021 to 2025. We focused on two metrics: 1) the real change in consumption from the beginning of the analysis period to the end; and 2) the stock of household wealth (financial and housing) at the end of the period.
Since inflation can have different effects depending on the Fed’s policy response, we considered four hypothetical scenarios: 1) No inflation, which serves as the baseline, 2) Permanent shock, where inflation spikes at 4 percent and stays there; 3) Soft landing, where inflation gradually returns to 2 percent in 2025 without a recession; and 4) Recession, where inflation begins to rise again in 2024 and the Fed responds aggressively by raising rates. All results were reported relative to the “no-inflation” scenario.
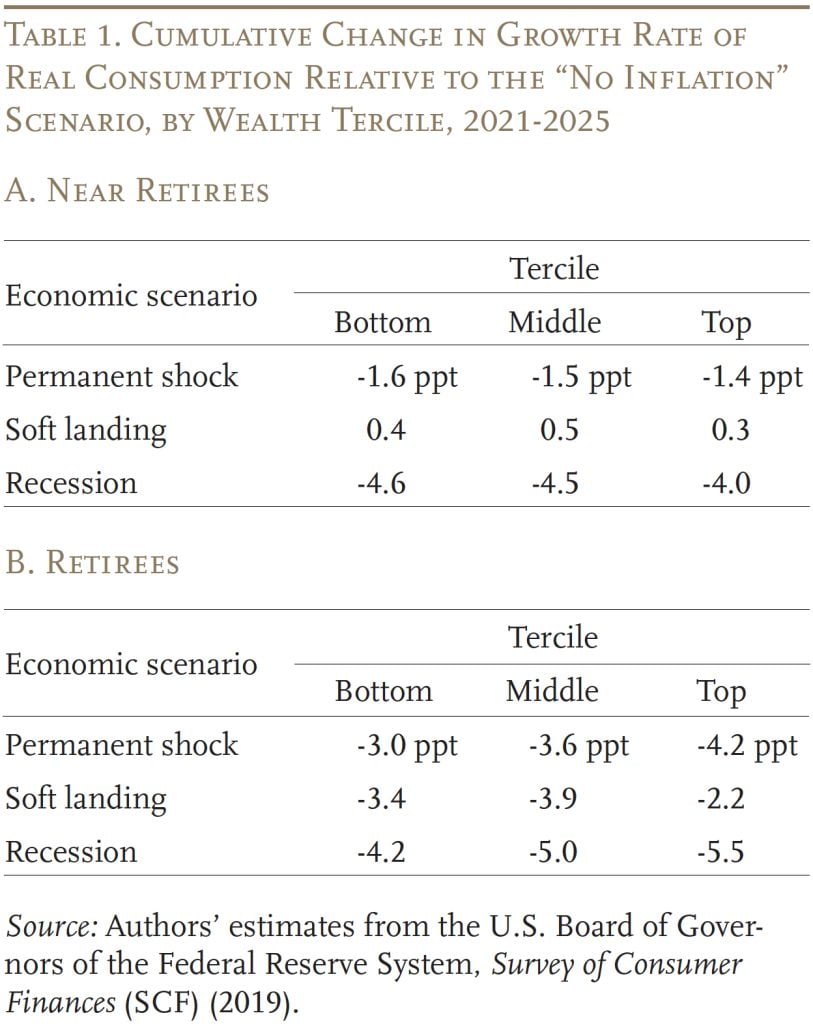
Since the results showed that inflation had very little impact on housing wealth, this brief only presents the findings for the change in consumption and financial wealth. In terms of the difference in the growth rate of consumption relative to the “no-inflation scenario,” the key finding is that near retirees experience a smaller decline than retirees, even enjoying real consumption gains in the “soft landing” scenario (see Table 1). This outcome is due to the real decline in mortgage payments relative to earnings. In contrast, retirees have less erosion of real debt, and often also lose real income as employer pension benefits are only partially indexed to inflation.
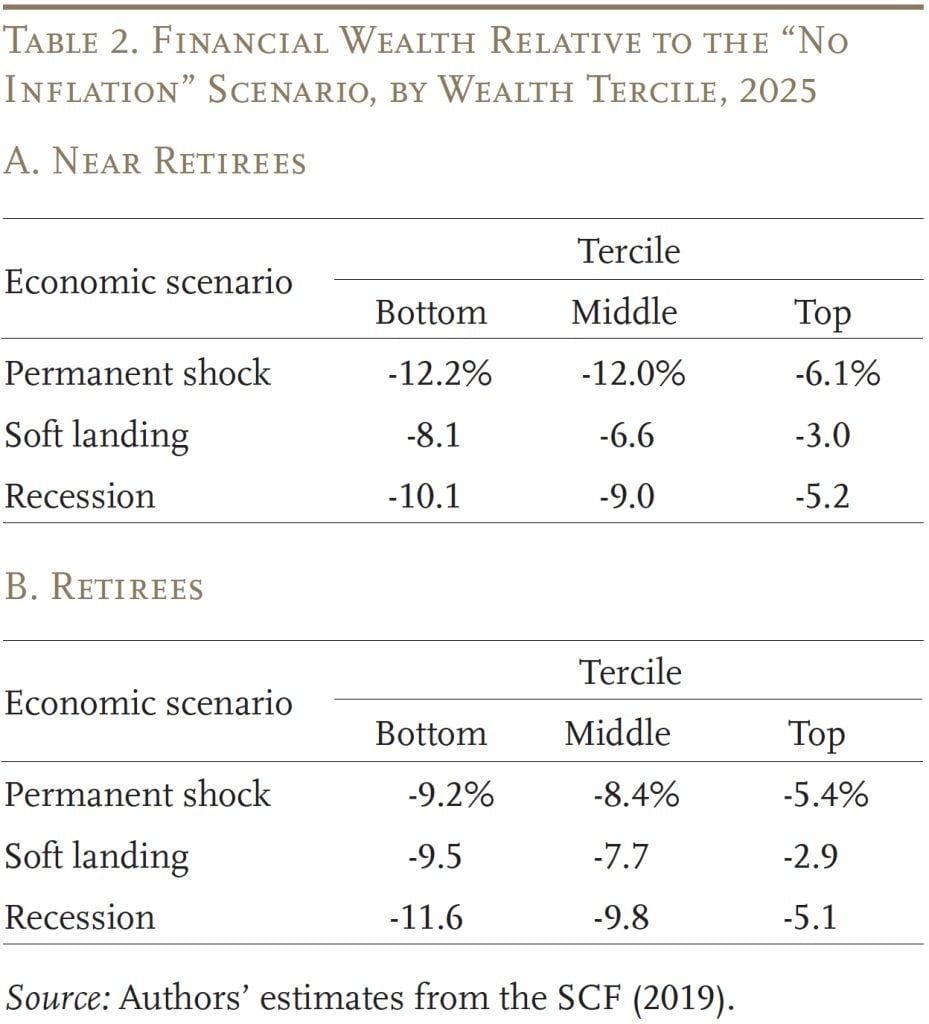
In terms of financial (non-housing) wealth in 2025, we see that inflation has an unambiguous negative impact (see Table 2). Top-wealth households, however, always lose less than their lower-wealth counterparts, because they invest in equities, businesses, and other assets that grow with inflation.
In short, most older households lose real consumption and wealth after an inflation shock. The magnitude of the loss depends on the nature of the shock, the real growth of income and assets, and the household’s exposure to fixed-rate debt. The questions addressed in this analysis are how households react to inflation and the consequences of their reactions for their consumption and wealth.
How Have Households Reacted to Recent Inflation?
Since economic theory is ambiguous about how older households should react to inflation, we undertook a new survey to explore how inflation impacted their behavior between 2021 and 2023. The survey was fielded by Greenwald Research in November 2023 and includes 1,501 respondents ages 55-85. To align with the scenario analysis, noted above, we focus on two groups: near retirees, who were under age 62 and working full time in 2021; and retirees, who were 62 or older and retired from their primary career in 2021, with a spouse also retired. Ultimately, 322 respondents in the survey meet our definition of near retirees and 630 meet our definition of retirees.
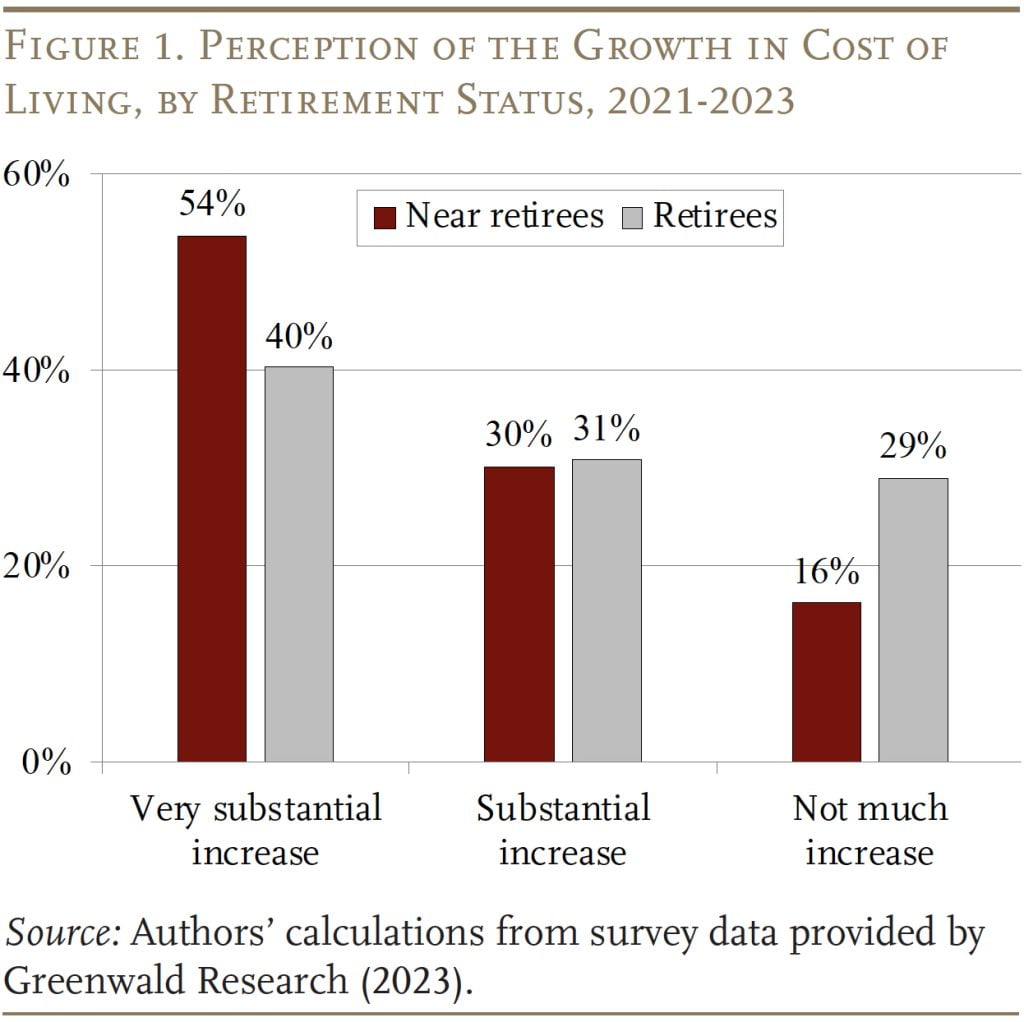
To provide context for the main analysis, the survey asked a series of questions about respondents’ cost of living, the growth in their income and assets (relative to the change in prices), and their economic outlook. Figure 1 shows the share of respondents reporting a change in their cost of living between 2021 and 2023. Fifty-four percent of near retirees and 40 percent of retirees rate the increase as “very substantial,” and another 30-31 percent rate it “substantial.”
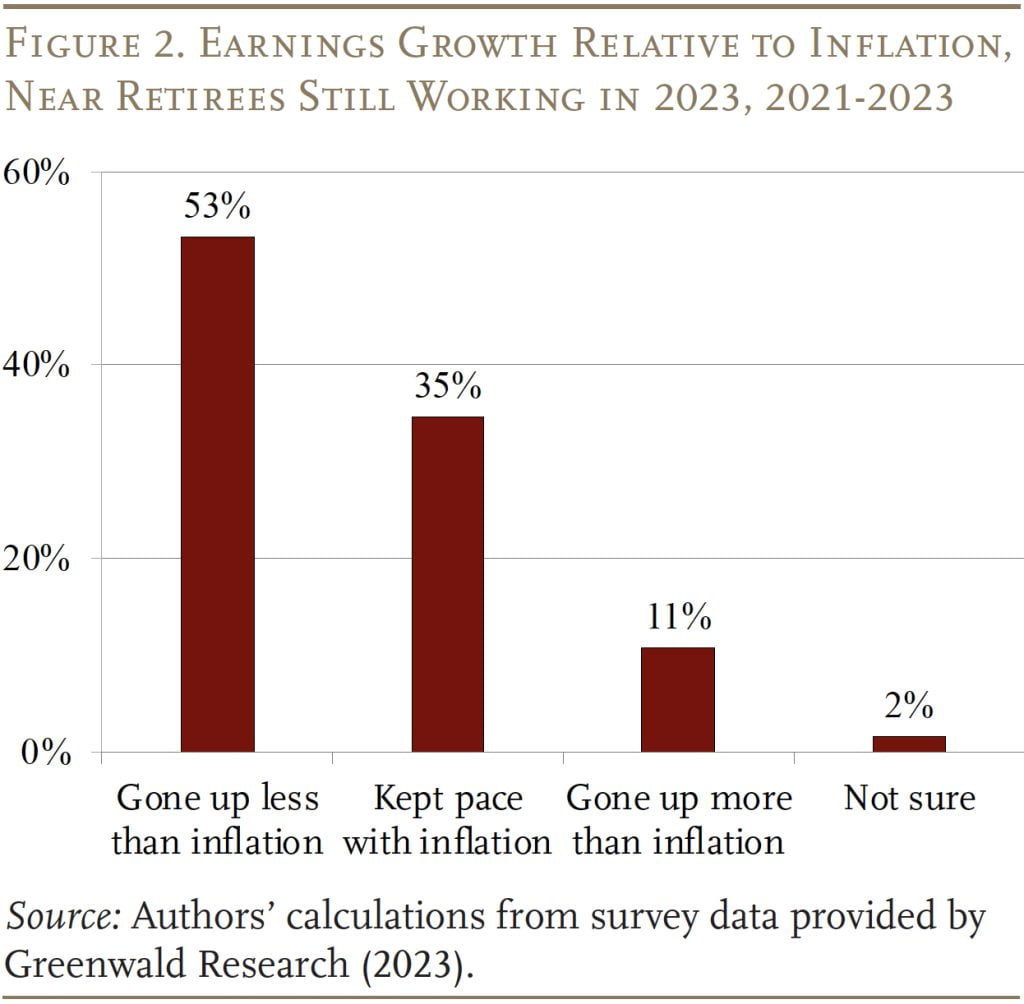
Meanwhile, Figure 2 shows the share of near retirees who report that their household’s work income kept pace with inflation over this period.2This question was only asked of households working in 2023. Over half report that their earnings have gone up less than inflation, 35 percent report that earnings kept pace with inflation, and only 11 percent experienced real wage growth.3Moreover, this figure likely overestimates real wage growth for the near retirees since around one-third retired before 2023, and these retiring workers probably had lower real wage growth, on average, than their counterparts who continued to work. This pattern aligns with the Federal Reserve Bank of Atlanta’s Wage Growth Tracker, which reports that workers ages 55+ saw a decline in real wages from the beginning of 2021 through May of 2023.4Since wage growth for older workers typically lags inflation, and the rate of inflation has been declining, we have now entered a period of real wage growth.
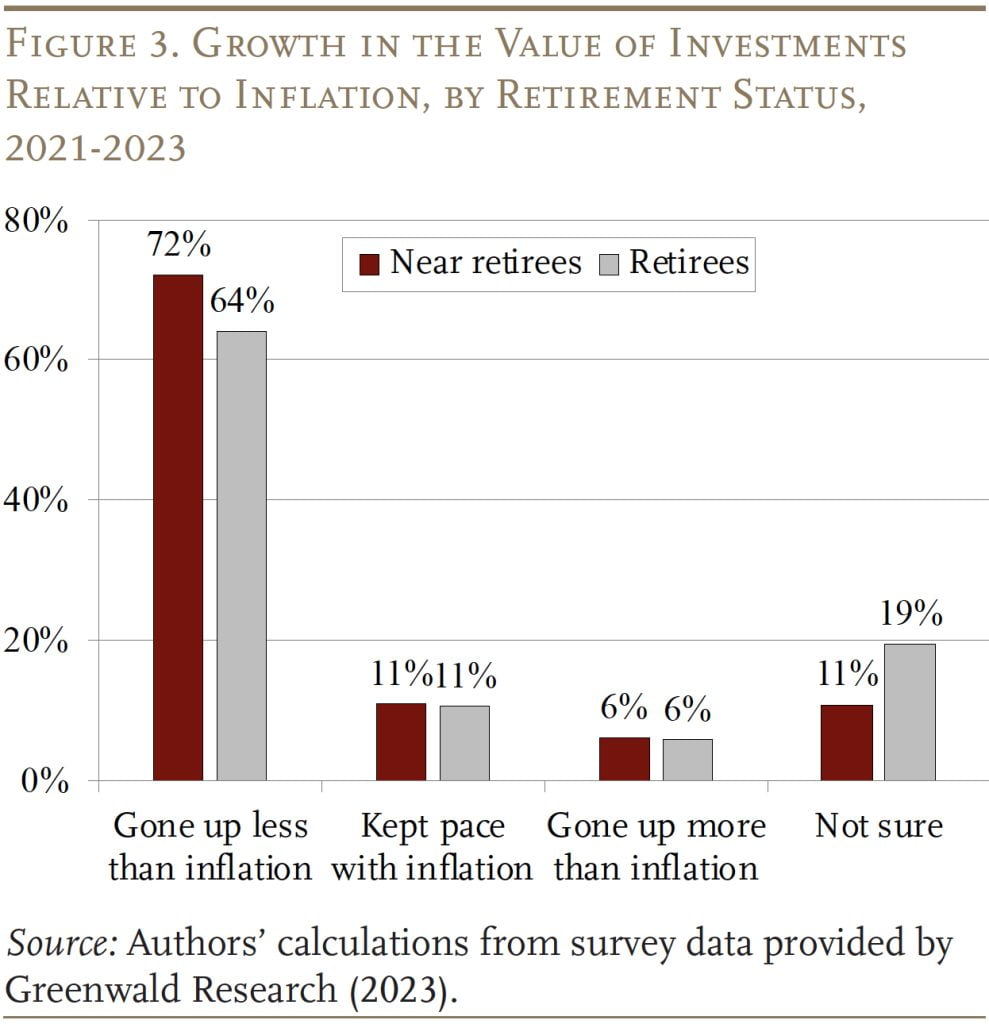
Similarly, Figure 3 shows the reported performance of household investments between 2021 and 2023, relative to price levels. Seventy-two percent of near retirees and 64 percent of retirees state that their investments grew less than inflation, 11 percent report that investments tracked inflation, and only 6 percent saw real growth.
To quantify the impact on household budgets, the survey also asked respondents to estimate the dollar increase in their monthly cost of living between 2021 and 2023 as a percentage of 2023 household income. This question measures the extent to which prices rose faster than income for each household. Although these dollar values are subject to recall error (and are top-coded at 8 percent of income) we can determine whether expenses rose 5 percent faster than income or more, and how that excess price growth correlates with respondents’ perception of inflation. As expected, 34 percent of respondents experiencing “very substantial” inflation report that their monthly expenses rose at least 5 percent faster than income, compared to 11 percent of respondents in the “substantial” group, and only 2 percent of respondents in the “not much” group.
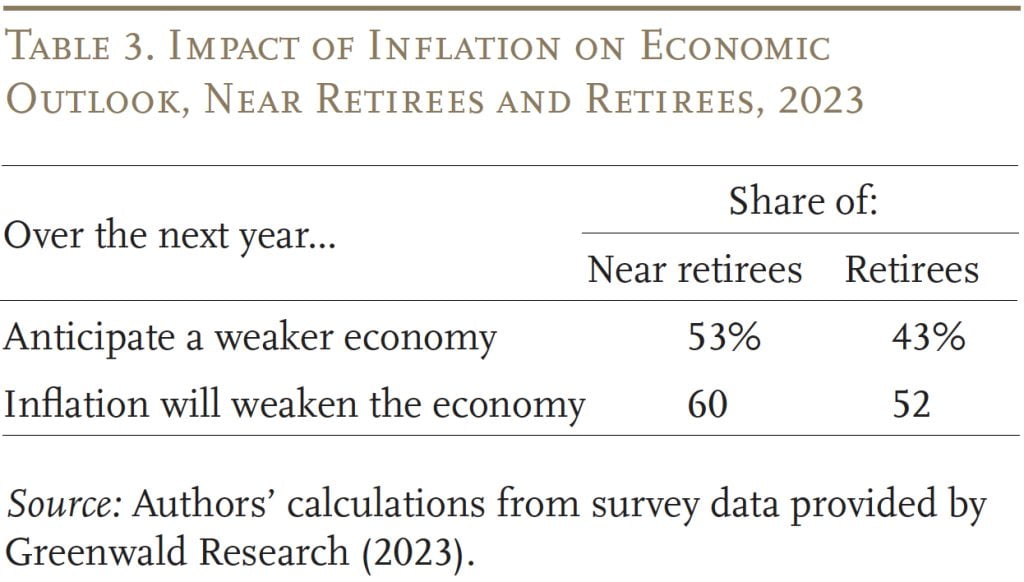
Unsurprisingly given these experiences, many older households are pessimistic about the trajectory of the economy. Fifty-three percent of near retirees and 43 percent of retirees have a negative outlook for 2024 (see Table 3).5Specifically, the survey asked: “Over the next year, do you think the U.S. Economy will get: […]” Then respondents were shown a menu with the following options: “stronger than it is now;” “weaker than it is now;” “the strength of the economy will not change;” and “not sure.” The survey then followed up with: “Do you think the rise in prices over the past year will contribute to: […]” with possible responses including: “a stronger economy over the next year;” “a weaker economy over the next year;” “will neither weaken nor strengthen the economy over the next year;” and “not sure.” Additionally, 60 percent of near retirees and 52 percent of retirees believe that last year’s inflation will contribute to a weaker economy over the year.
The next step is to look at how respondents’ experience with, and perceptions of, inflation affected their behavior. The survey asked respondents whether they had made changes since 2021 along four dimensions: 1) labor supply (retirement age and hours worked); 2) saving rate; 3) withdrawals from savings; and 4) asset allocation. For respondents reporting a change in behavior, the survey had them rank their motivations in order of importance. We attribute a change in behavior to inflation if the respondent cited rising prices as their primary motivator.6The paper on which this brief is based (Aubry and Quinby 2024b) also uses regression analysis to confirm the reliability of these self-assessed impacts of inflation.
Labor Supply
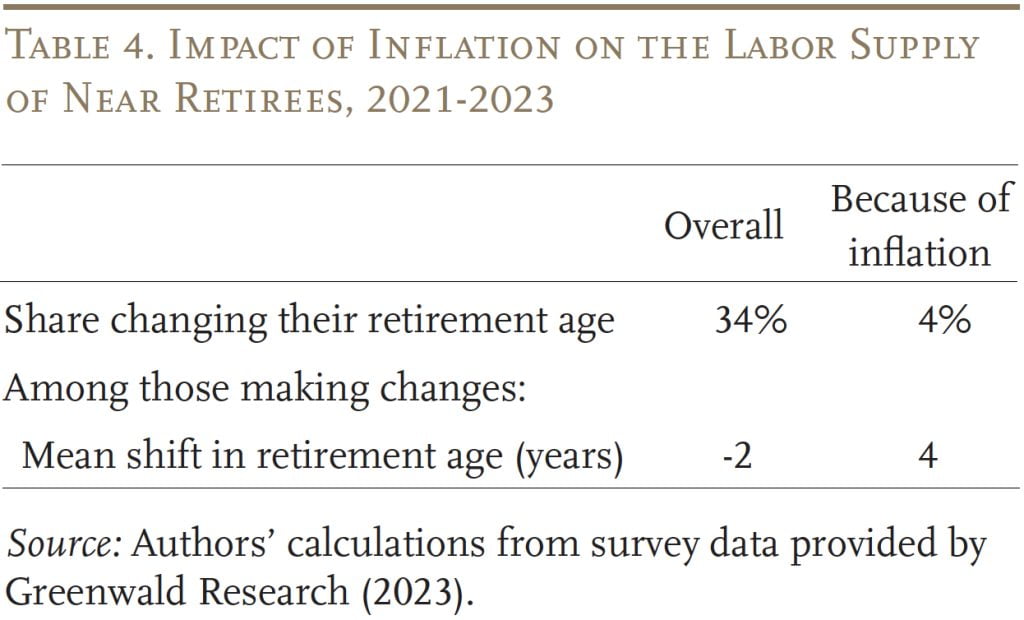
Table 4 reports the impact of inflation on labor supply. The first row shows that whereas 34 percent of all near retirees changed their retirement age, only 4 percent did so because of inflation. Among those reacting to inflation, the next row shows an average expected delay of 4 years. For context, this length of delay is similar to results from previous survey research, but we find many fewer individuals choose to delay at all.7Nationwide (2022) finds that 40 percent of workers ages 45+ plan to retire later due to inflation. One explanation is that previous research interviewed respondents at the height of inflation in 2022, whereas we fielded our survey in November 2023.
Saving and Withdrawals
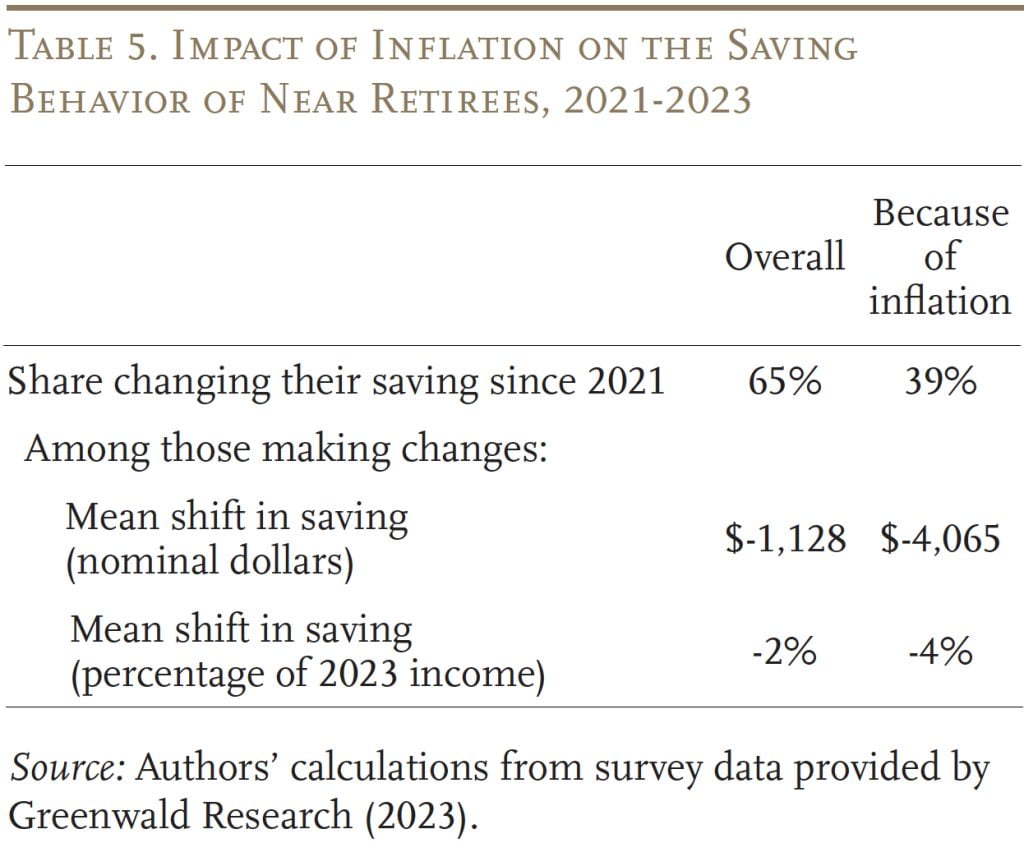
Turning to financial wealth, 39 percent of near retirees claim to have changed their saving because of inflation (see Table 5). Among those primarily motivated by inflation, annual saving declined by $4,065, on average, or 4 percent of annual household income in 2023.
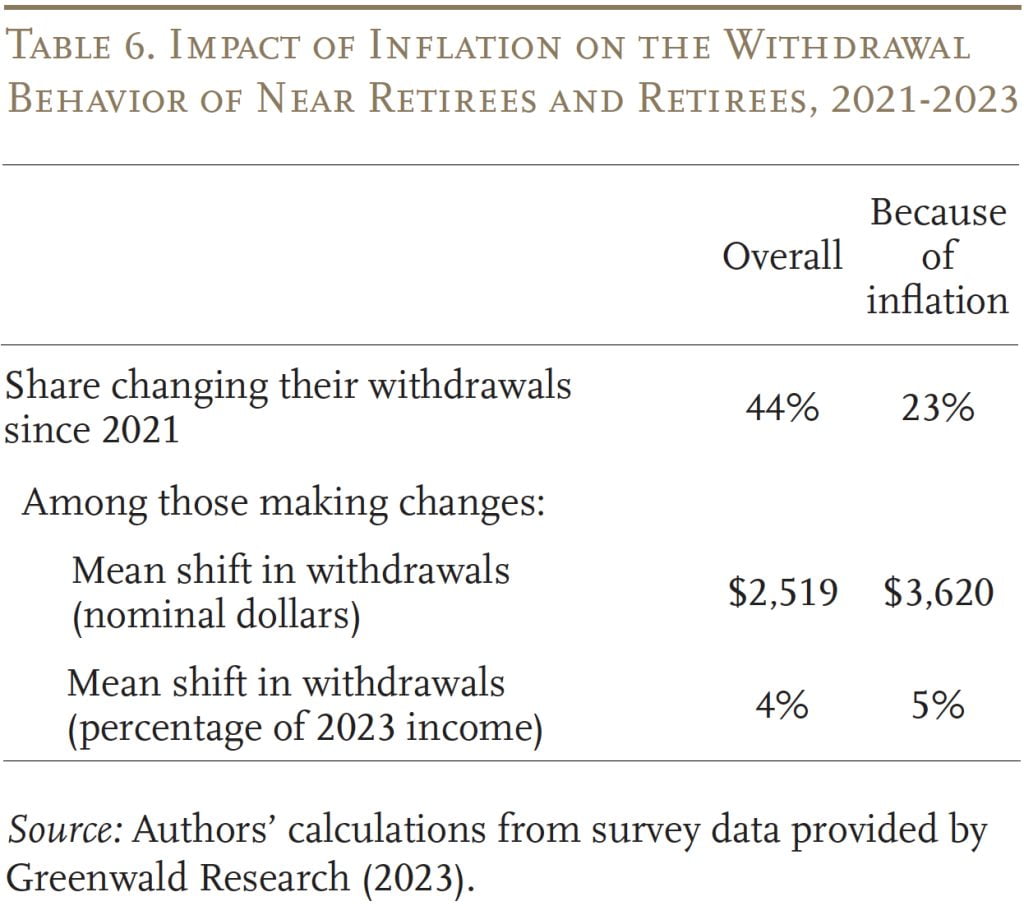
Additionally, rising prices caused both near retirees and retirees to dip into their savings. Table 6, which combines the results for both groups because they are quite similar, reports that 23 percent of respondents changed their withdrawals from 2021 to 2023 because of rising prices. Among those making changes, the average increase was $3,620 (5 percent of 2023 household income).8Respondents were not given the option to select rising prices as a motivation for reducing withdrawals.
Asset Allocation
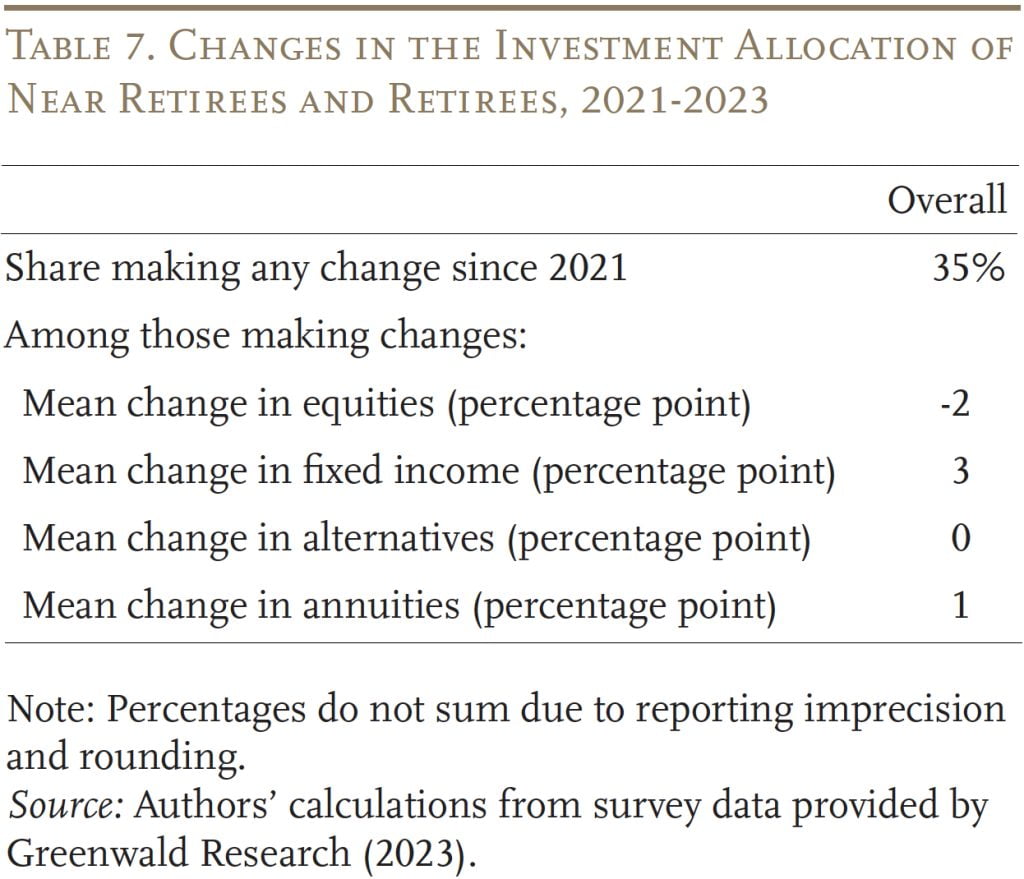
In contrast to the substantial shares of households changing saving and withdrawals, a much smaller percentage changed their asset allocation. Table 7, which again combines results for near retirees and retirees, indicates that, while 35 percent of all households changed their allocation between 2021 and 2023, the magnitude of the shift is very small. To the extent that shifts occurred, households moved away from equities and toward fixed income.9Franklin (2023) and MFS Investment Management (2023) find similar patterns across asset classes.
Implications for Retirement Security
The next step is to incorporate households’ behavioral responses into the scenario modeling. For this exercise, we focus on the changes in saving and withdrawals, since very few near retirees changed their retirement age or asset allocation. For each near-retiree household, we calculate the total reduction in saving (the decline in saving plus the increase in withdrawals between 2021 and 2023). On average, this reduction equaled 4 percent of 2023 income, which we annualize to 2 percent per year. Similarly, retirees increase their annual withdrawals by 2.5 percent of income (annualizing the 5-percent change reported in the survey for 2021-2023).10For retirees in the bottom wealth tercile, we assume that withdrawals only increase by 1.2 percent of income, since any greater change would deplete the assets in their retirement accounts before the end of our analysis period. For simplicity, we assume that households across the wealth distribution respond similarly and that the annualized rates of change start in May 2021 and persist through December 2025.
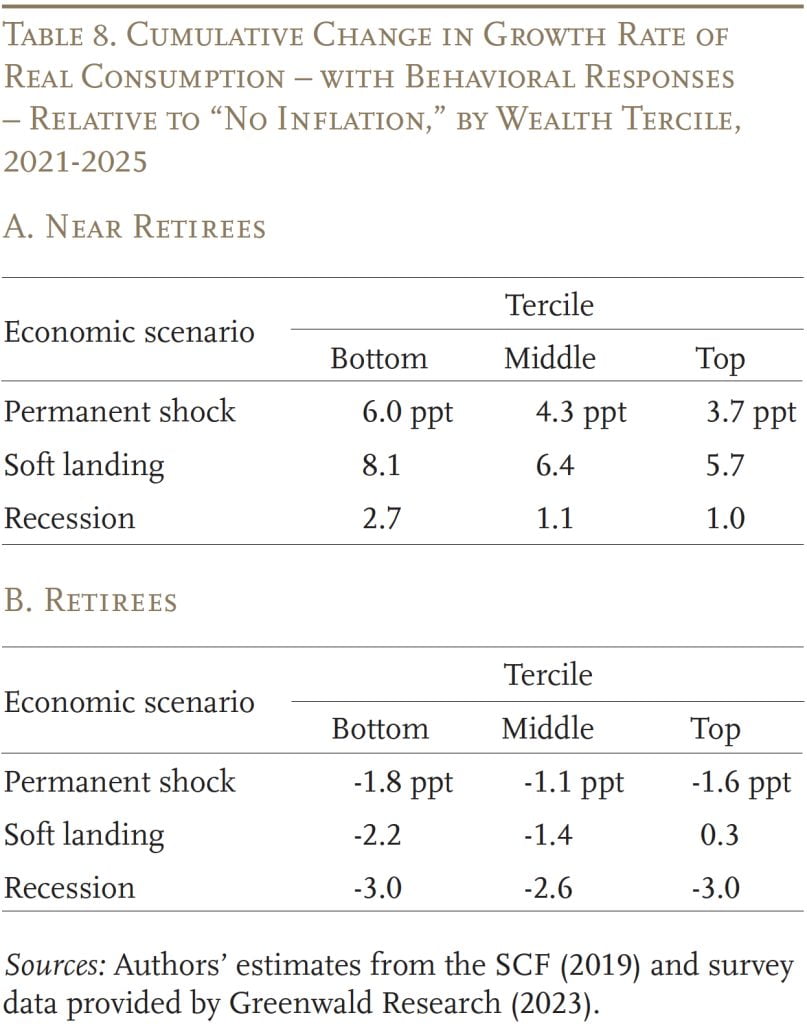
Table 8 shows the difference in the growth rate of real consumption, from 2021 to 2025, relative to the “no inflation” scenario once we incorporate behavioral responses reported in the survey. Unsurprisingly, households are able to close much of the inflation-consumption gap by tapping into their savings. The key difference in outcomes here is between near retirees – who all show gains in consumption – and retirees – who mainly see small declines.
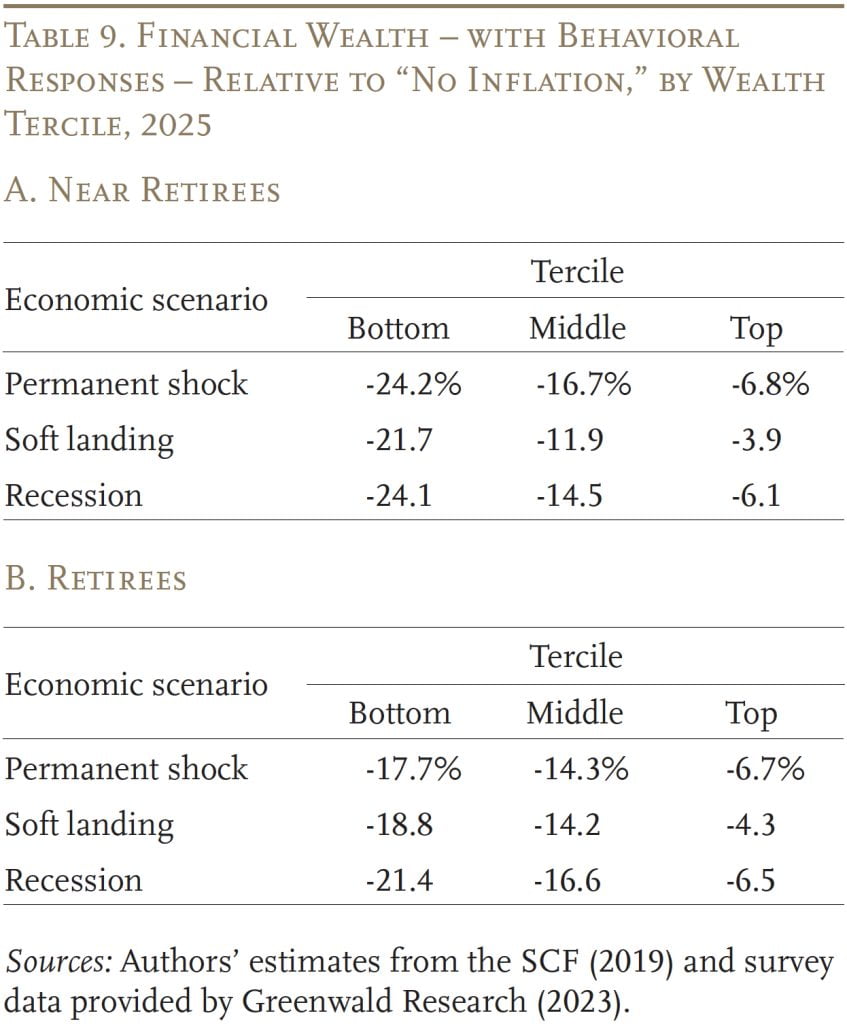
This short-term gain, however, comes at the expense of future consumption. Table 9 compares real financial wealth in 2025, with behavioral responses, to the “no inflation” scenario.11The figure excludes housing wealth because saving and withdrawals do not have any effect on home value or mortgage debt in our illustration. As expected, reduced saving and increased withdrawals compound the direct impact of inflation on wealth.
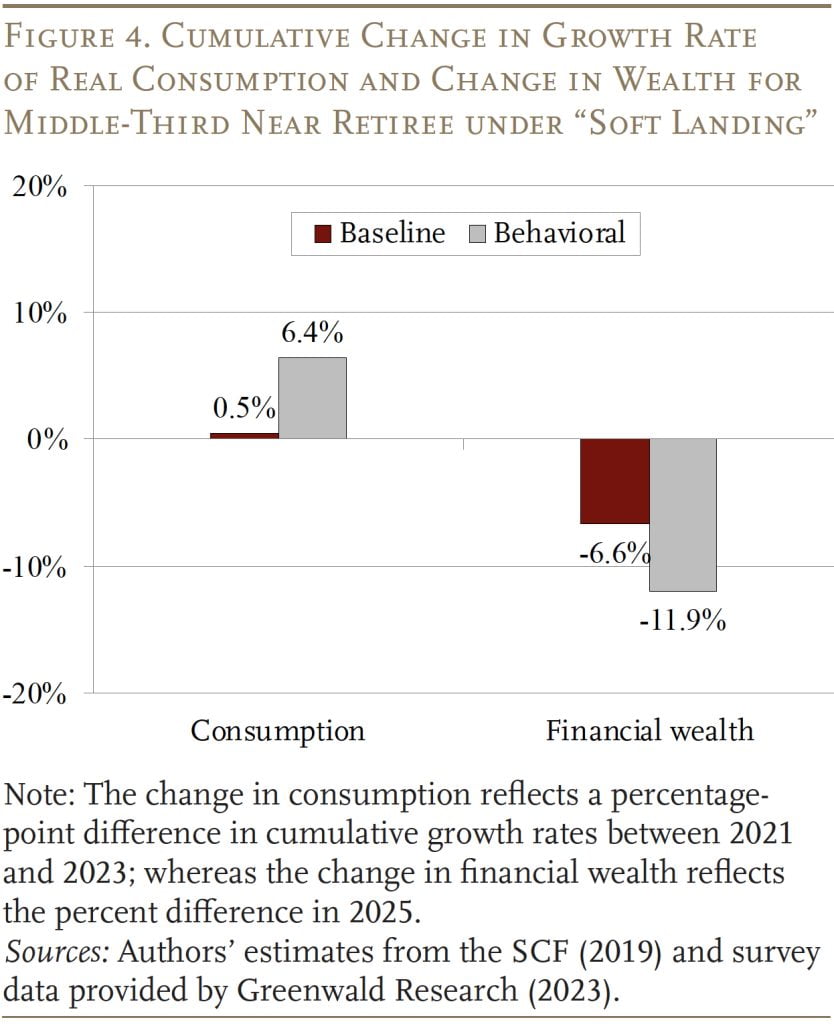
To clearly illustrate this trade-off between current and future consumption, Figure 4 compares the results incorporating the behavioral responses to the original baseline analysis for one type of household: near retirees in the middle-wealth tercile under the “soft landing” scenario. Recall that, in the original model, the growth rate of real consumption was 0.5 percentage points higher than in the “no inflation” scenario (due to the real decline in mortgage debt). After households reduce their saving, real consumption grows 6.4 percentage points more than in “no inflation.” However, whereas the initial model found a 6.6-percent reduction in financial wealth compared to “no inflation,” the results incorporating behavioral responses create an 11.9-percent drop. This same trade-off holds across all age groups, wealth terciles, and macroeconomic scenarios.
Conclusion
High inflation in later life is often harmful to retirement security. Compounding the direct impacts on real income and wealth, many households cut back their saving and increase withdrawals when inflation spikes. So, what can older households do to mitigate the risk of a future inflation shock?
Households that are still working when inflation hits have the most flexibility to improve their situation. Since wages tend to lag prices, households that stay in the workforce are likely to experience real wage gains eventually, allowing them to catch up on their saving. Working longer also reduces the period over which savings must spread.
Retired households have less opportunity to earn inflation-adjusted income. However, they can still take protective steps when inflation hits, such as – to the extent possible – re-investing their fixed-income holdings to take advantage of rising interest rates, rather than making withdrawals that lock in large initial losses.
The inflation shock that prompted our study is starting to recede, and the Federal Reserve now seems likely to achieve a soft landing. Will households reverse course as inflation moderates, saving more and withdrawing less? We leave these and other questions for future work.
References
Aubry, Jean-Pierre and Laura D. Quinby. 2024a. “How Does Inflation Impact Near Retirees and Retirees?” Issue in Brief 24-12. Chestnut Hill, MA: Center for Retirement Research at Boston College.
Aubry, Jean-Pierre and Laura D. Quinby. 2024b. “How Do Households React to Inflation? New Survey Evidence.” Working Paper 2024-3. Chestnut Hill, MA: Center for Retirement Research at Boston College.
Aubry, Jean-Pierre and Laura D. Quinby. 2024c. “What Risks Do Near Retirees and Retirees Face from Inflation?” Working Paper 2024-4. Chestnut Hill, MA: Center for Retirement Research at Boston College.
Federal Reserve Bank of Atlanta. 2000-2023. “Wage Growth Tracker.” Atlanta, GA.
Franklin, Glen. 2023. “The Impact of Inflation’s Return on Retirement Planning.” Highlands Ranch, CO: 401k Specialist.
MFS Investment Management. 2023. “Inflation is Already Reshaping Retirement Strategies and Expectations, 2023 MFS Global Retirement Survey Finds.” Boston, MA.
Nationwide. 2022. “Nationwide in Plan Sponsor: Survey Report.” Columbus, OH.
U.S. Board of Governors of the Federal Reserve System. Survey of Consumer Finances, 2019. Washington, DC.
Endnotes
- 1The first brief is Aubry and Quinby (2024a). Both briefs are based on two recent papers, Aubry and Quinby (2024b and 2024c), which describe the methodology in detail.
- 2This question was only asked of households working in 2023.
- 3Moreover, this figure likely overestimates real wage growth for the near retirees since around one-third retired before 2023, and these retiring workers probably had lower real wage growth, on average, than their counterparts who continued to work.
- 4Since wage growth for older workers typically lags inflation, and the rate of inflation has been declining, we have now entered a period of real wage growth.
- 5Specifically, the survey asked: “Over the next year, do you think the U.S. Economy will get: […]” Then respondents were shown a menu with the following options: “stronger than it is now;” “weaker than it is now;” “the strength of the economy will not change;” and “not sure.” The survey then followed up with: “Do you think the rise in prices over the past year will contribute to: […]” with possible responses including: “a stronger economy over the next year;” “a weaker economy over the next year;” “will neither weaken nor strengthen the economy over the next year;” and “not sure.”
- 6The paper on which this brief is based (Aubry and Quinby 2024b) also uses regression analysis to confirm the reliability of these self-assessed impacts of inflation.
- 7Nationwide (2022) finds that 40 percent of workers ages 45+ plan to retire later due to inflation.
- 8Respondents were not given the option to select rising prices as a motivation for reducing withdrawals.
- 9Franklin (2023) and MFS Investment Management (2023) find similar patterns across asset classes.
- 10For retirees in the bottom wealth tercile, we assume that withdrawals only increase by 1.2 percent of income, since any greater change would deplete the assets in their retirement accounts before the end of our analysis period.
- 11The figure excludes housing wealth because saving and withdrawals do not have any effect on home value or mortgage debt in our illustration.


Aubry, Jean-Pierre and Laura D. Quinby. 2024. "How Do Older Households React to Inflation?" Issue in Brief 24-14. Chestnut Hill, MA: Center for Retirement Research at Boston College.