What’s the Best Way to Calculate Social Security’s COLA?
Alicia H. Munnell is a columnist for MarketWatch and senior advisor of the Center for Retirement Research at Boston College.
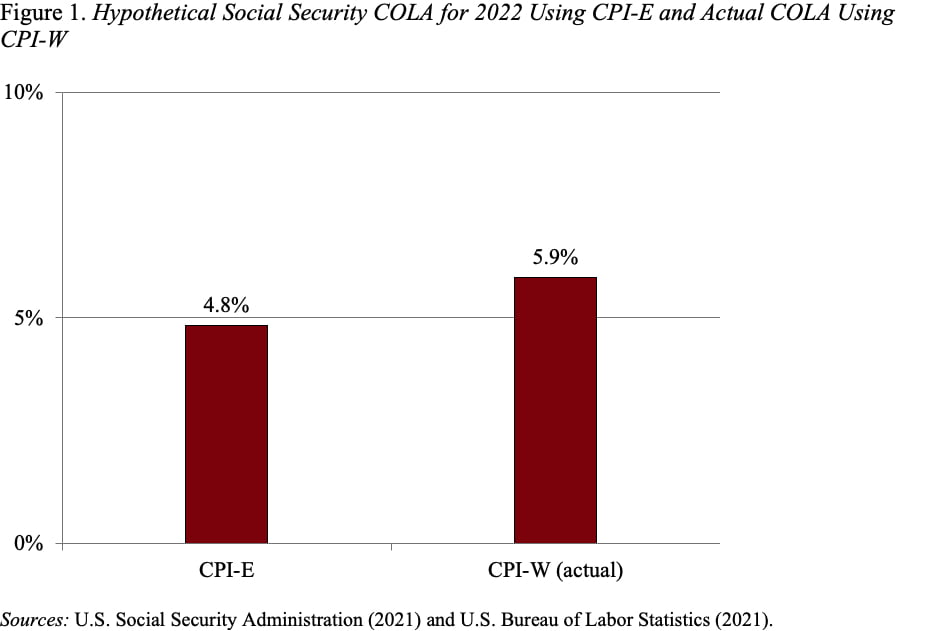
For CPI-E fans, the Social Security COLA would have been 4.8% rather than 5.9%.
In light of the recent announcement of a 5.9% cost-of-living adjustment (COLA) for Social Security benefits in 2022, a reporter asked what the number would have been based on the often- advocated CPI-E – the experimental index for the elderly.
My trusted sidekick – Patrick Hubbard – came back with 4.8%. I sighed with disappointment, reminded him that he knew that the CPI-E rises faster than the CPI-W (the index used for adjusting Social Security benefits), and sent him away. He returned a few minutes later with the same number and a story to boot. Patrick is usually right! Indeed, the COLA based on the experimental CPI-E would have been 4.8 percent compared to the actual COLA of 5.9 percent (see Figure 1).

First, let me tell you why this happened. The underlying argument for a CPI-E is that older households spend more on medical care than their younger counterparts and the cost of medical care rises faster than other budget items.
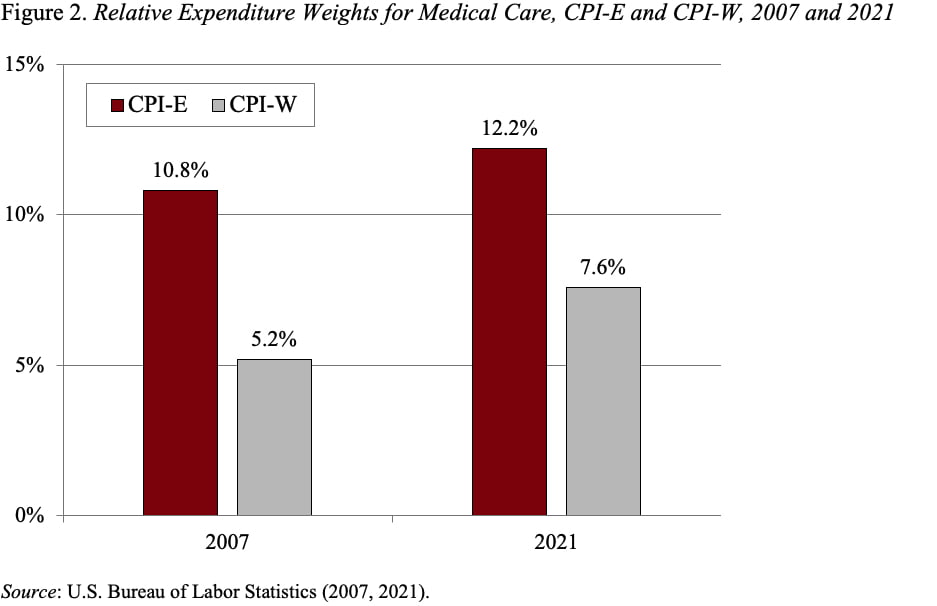
The weighting argument is correct. In 2007 – the earliest year for which CPI-E weights are publicly available – the elderly spent more than twice as much on medical care – relative to their total expenditures – as the population as a whole. A notable difference persists today (see Figure 2).

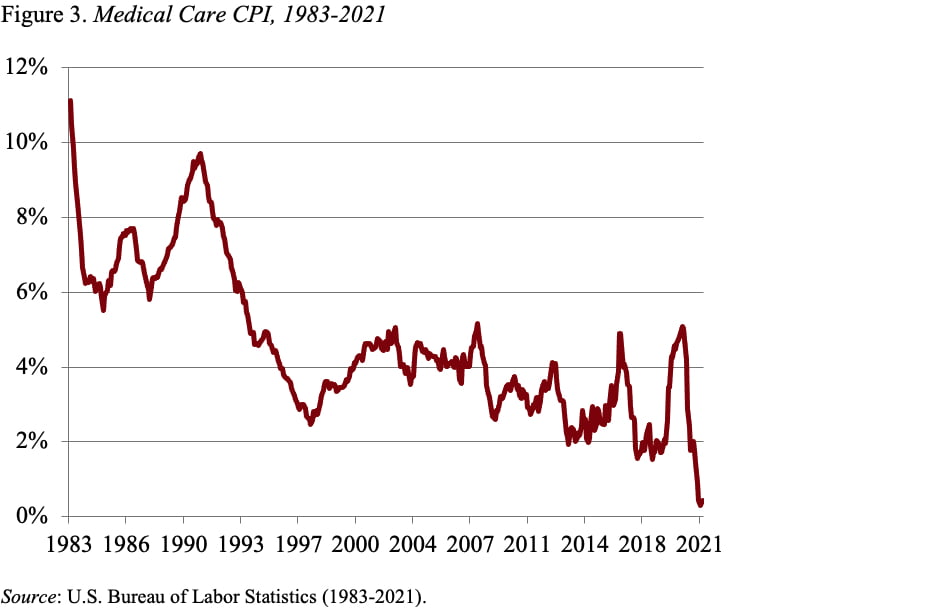
What has changed is the rate of medical inflation. Health care costs are rising at a much lower rate than in the past. And between the third quarter of 2020 and the third quarter of 2021, they barely rose at all (see Figure 3). Since this low-inflation component receives twice the weight in the CPI for the elderly as it does in the CPI-W, the CPI-E increased more slowly.

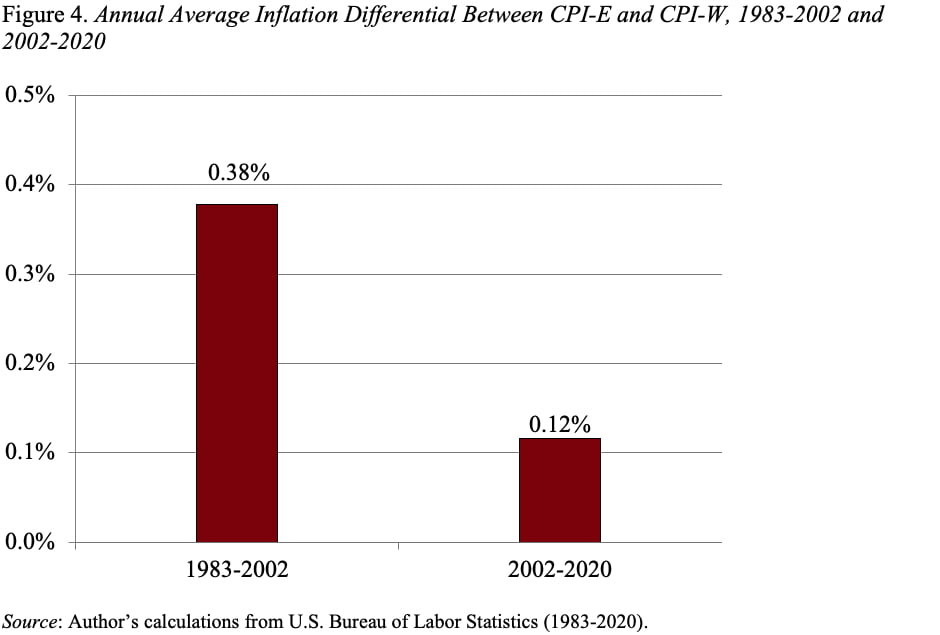
To me, shifting to the CPI-E to determine the COLA has never seemed like a productive proposal. First, the difference between the two indices has declined over time. The annual average difference from 1983 to 2002 was 0.38 percent. But, from 2002-2020, it narrowed to 0.12 percent (see Figure 4), and, as noted, the difference in 2021 was actually negative.

More importantly, the CPI-E is not a real price index. It simply re-weights the data collected for the population as a whole. As a result, it suffers from several flaws. First, a relatively small number of households are used to determine expenditure patterns. Second, prices are based on the same geographic areas and retail outlets used by younger people. Third, the items sampled may not be the same as those bought by the elderly. Finally, the prices used are the same as those reported for younger people and do not reflect any senior discounts. Thus, if the decision were made to employ an index for the elderly, a new index would be needed with a larger sample of older households that uses the prices for products they buy at the places they shop.
In short, fooling around with the index for Social Security’s COLA is not worth the effort. We have bigger fish to fry!!


