Are Retiree Housing Patterns Stable Enough to Borrow Against Home Equity?
Alicia H. Munnell is a columnist for MarketWatch and senior advisor of the Center for Retirement Research at Boston College.
Recent study shows that most people don’t move; only 14 percent are “frequent movers.”
As retirees live longer, spend more on medical care, and get less income replaced by Social Security, many may need to tap their home equity to be comfortable in retirement. The most direct way to access home equity is downsizing, but few choose this option because they generally prefer to stay in their house. The alternative is withdrawing equity through a reverse mortgage or a property tax deferral, but few households use these options either.
A potential reason that homeowners are reluctant to borrow against their house is a concern that, if they do decide to move, they have to pay back the loan with interest at a vulnerable time in their life. In a recent paper, my co-authors and I assess how likely households are to move as they age to see if borrowing against one’s home is a viable financial strategy.
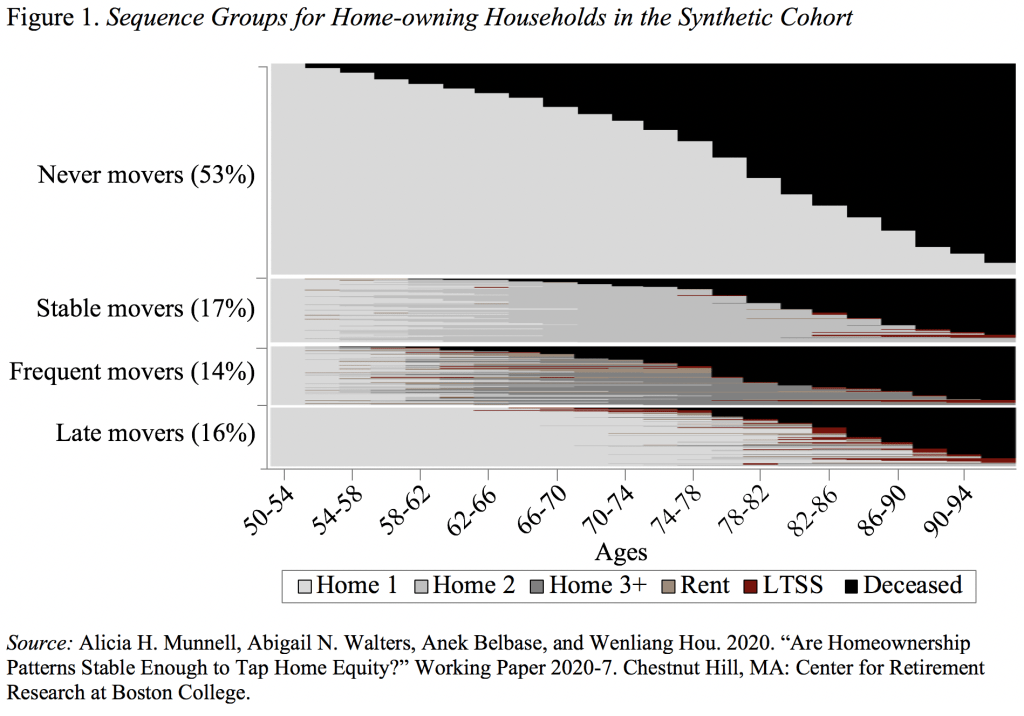
We used data from the 1992-2016 waves of the Health and Retirement Study (HRS), a longitudinal survey of households ages 50 and over. To describe the typical housing trajectories of people in their 50s until death required the creation of a synthetic cohort by “splicing” together two cohorts to create a complete picture. We then followed people over time to see if they stayed in their same home, moved to another home, or moved to a rental or to a care facility. Sequence analysis was used to group together common residential patterns among homeowners. The analysis uncovered four groups (see Figure 1).

The first two groups could be characterized as “never movers” and “stable movers.” Group 1 (53 percent) are those that never move from the original home they owned in their early 50s. Further analysis shows that households taking this approach look very much like the average for older households in terms of race, income, and wealth. Group 2 (17 percent) households move around retirement into a new owner-occupied home and then generally stay in that new home until death. The households that follow this second path are the most privileged of the four groups. They are more educated than the average older household and they have higher income, substantially more financial wealth, and more housing wealth.
The movers consist of two distinct groups – “frequent movers” (Group 3) and “late movers” Group (4). The “frequent movers” (14 percent) look somewhat like the stable movers in that they are better educated and have higher income than the average. Along other dimensions, however, they differ noticeably. Most importantly, a much smaller share of the frequent movers are two-earner couples; they have more children; they experience more unemployment; and they have less financial wealth. The result of the frequent moves appears to be less combined housing and financial wealth than any other group at the end of the observation period.
The Group 4 “late movers” (16 percent) stay in their original home until their 80s and then move into either a rental or a care facility. This group looks like the “never movers” along many dimensions. They have the same racial makeup, a very similar education profile, the same percentage of dual-earners, and similar incomes at the first observation. They are better off, however, than the never movers in terms of starting financial and housing wealth. While they stay in their original home for a long period of time, they are more likely to experience an impairment and be forced to move in their 80s.
The overall conclusion is that most homeowners – the exception being the “frequent movers” – experience enough residential stability to tap home equity.


