
Social Security Costs Could Rise if Fertility Rates Stay Low

Alicia H. Munnell is a columnist for MarketWatch and senior advisor of the Center for Retirement Research at Boston College.
Are the Social Security Trustees too optimistic?
The 2025 Social Security Trustees Report is standard fare. It confirms what has been evident for almost three decades – namely, Social Security is facing a 75-year financing shortfall that currently equals 1.3 percent of GDP. And, if no action is taken before 2033, the depletion of reserves in the retirement trust fund will result in an automatic 23-percent cut in benefits.
Compared to last year’s report, the metrics are somewhat worse. The projected 75-year deficit rose to 3.82 percent of taxable payroll, compared to 3.50 percent in 2024. The projected depletion date for the Old-Age and Survivors Insurance (OASI) trust fund assets did not change; it remains at 2033. Yes, the Disability Insurance (DI) trust fund has enough to pay benefits for the full 75-year period, so the date of depletion for the combined OASDI trust funds is 2034 – a year earlier than last year’s report. But combining the two systems would require a change in the law; hence, under current law, the action-forcing date is 2033 – eight years from now.
All these numbers, however, are based on the Trustees’ intermediate assumptions. What happens to the cost of the program should the fertility rate remain low, should policymakers deport millions of immigrants and reduce future immigration levels, and should people live longer than expected? This blog focuses on the fertility assumptions.
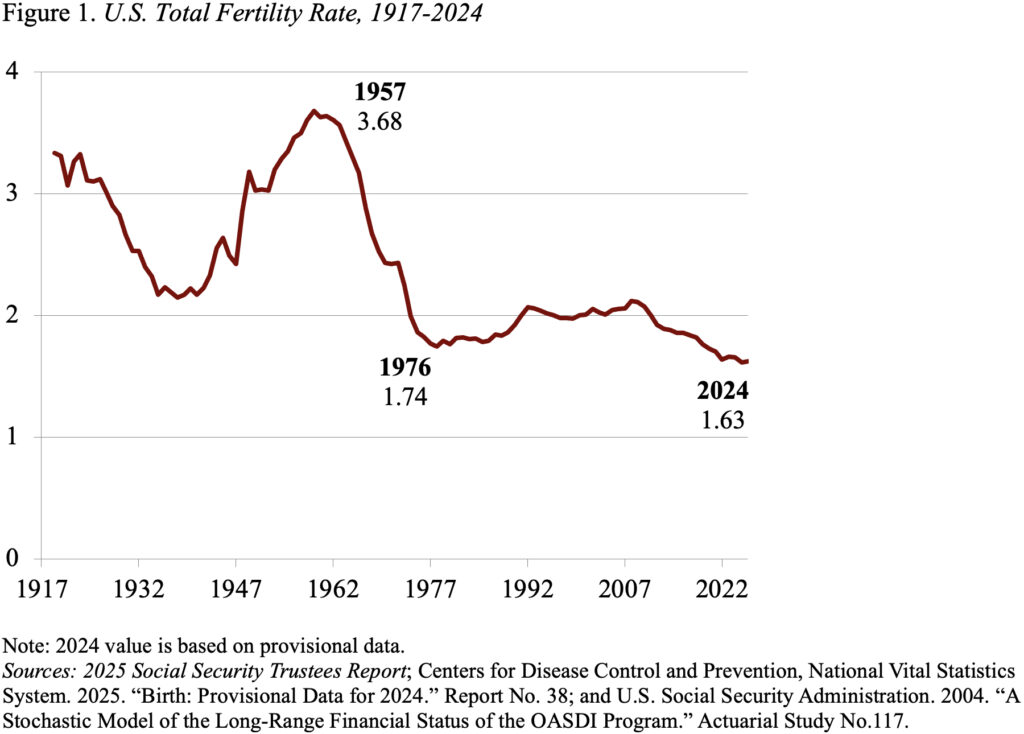
U.S. fertility rates have generally been falling since the end of the Baby Boom in the mid-1960s, and that decline accelerated after the Great Recession. Many observers thought that, once the economy recovered, the fertility rate would rebound. It has not (see Figure 1). Today, the hypothetical lifetime number of births for a woman over her childbearing years is 1.63.
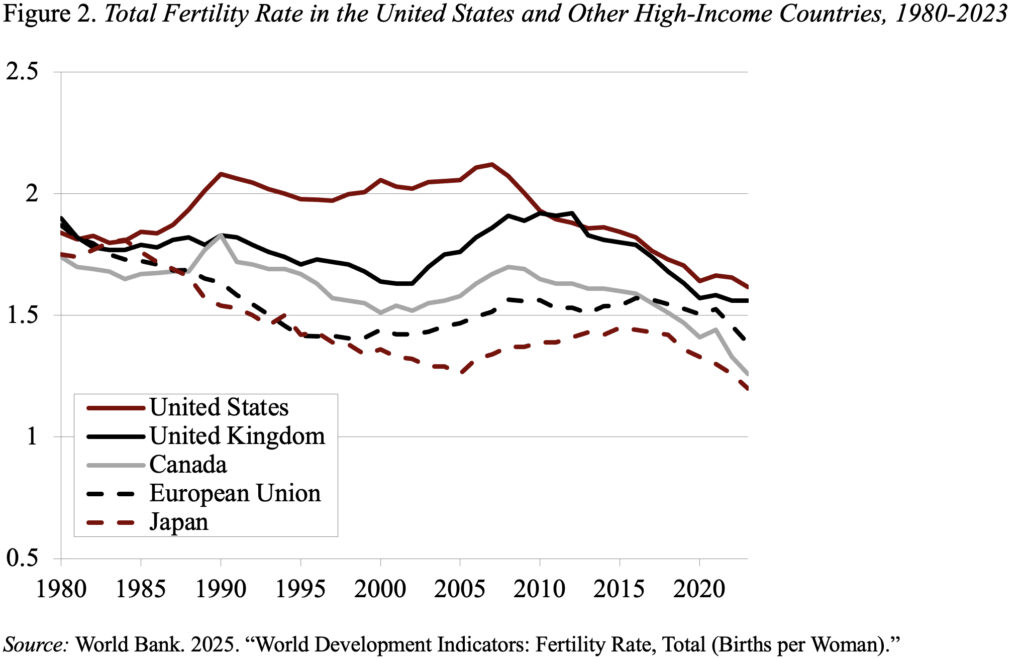
The U.S. current fertility rate is not an anomaly; it is now roughly in line with the rates in other high-income countries (see Figure 2).
The Social Security Trustees are well aware of these numbers, but project an ultimate fertility of 1.9 children. The Trustees base their case on two factors. The first is that repeated surveys of women of childbearing age show birth expectations above 2.0, suggesting that the current low levels will not be permanent. Second, they believe that increasing fertility rates for women in their 30s support the notion that women are simply postponing their childbearing.
This Trustees’ projected fertility rate, however, is substantially higher than the Congressional Budget Office, which projects an ultimate fertility rate of 1.60 by 2035, and the Census Bureau, which projects a continuous decline in fertility to 1.60 in 2050 and 1.55 in 2100.
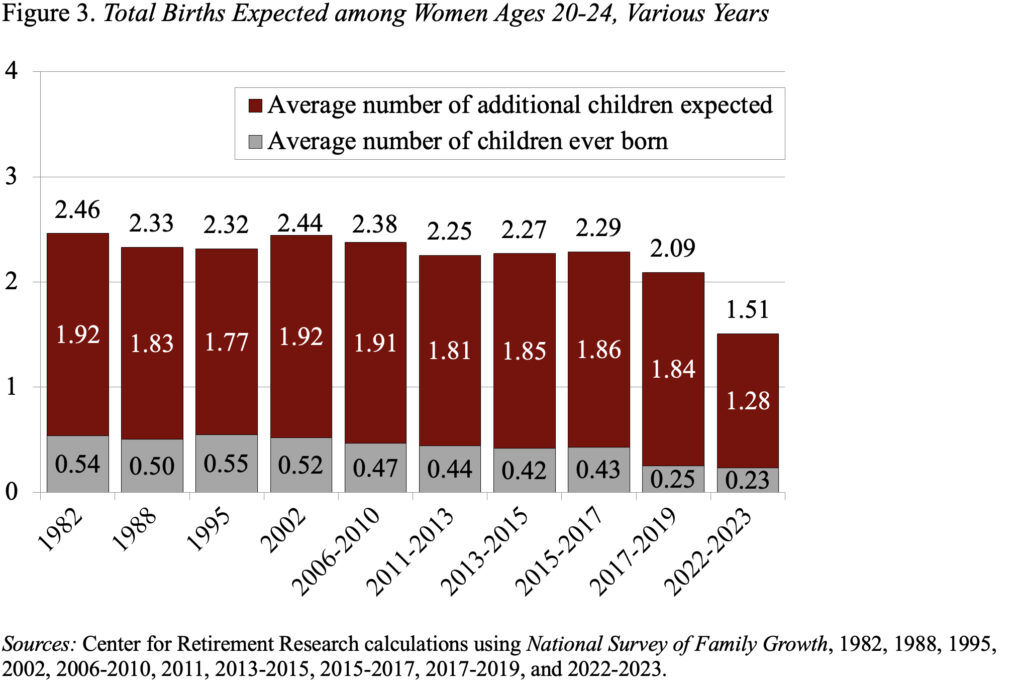
Additionally, the most recent expectations data – which came out after the Trustees set their assumptions for this year’s report – show that women under 35 all expect to have fewer than 2.0 children. In fact, today’s 20-24-year-olds only expect to have 1.5 children (see Figure 3).
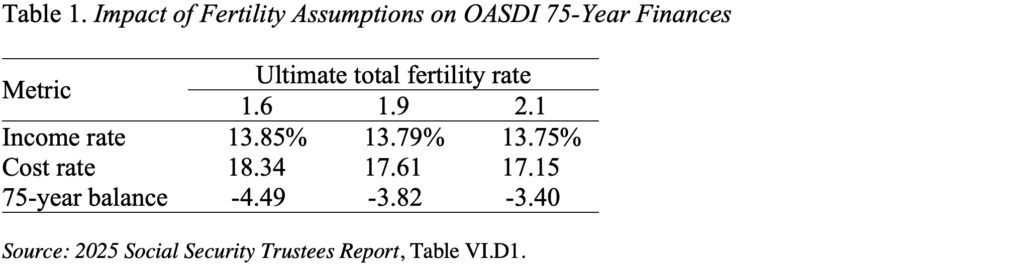
According to the Trustees’ sensitivity analysis, an ultimate fertility rate of 1.6 rather than 1.9 would increase the 75-year deficit from 3.82 to 4.49 percent of taxable payroll (see Table 1).
Could pro-natalist policies increase the fertility rate? The challenge is that, over the last 30 years, many countries have instituted pro-natalist policies – basing benefits on number of children, providing allowances for newborns, or offering child tax credits. The evidence suggests that these efforts have not worked. Sweden is a wonderful example, because even with soup-to-nuts support its fertility rate is 1.45 – significantly lower than the U.S. rate.
If low fertility persists, the Trustees will eventually have to reduce their assumptions. Lower assumed fertility could produce 75-year deficits in the range of 4 to 4.5 percent. However, even with higher projected deficits, the levers are available on both the revenue and benefit side to restore balance to Social Security. Congress just needs to act.