
Do Older Homeowners Pay More for Mortgages?

The brief’s key findings are:
- A prior brief found that older mortgage applicants are more likely to be denied. The focus here is whether older homeowners pay more on loans.
- The analysis controls for borrowers’ credit risk using the fees that Fannie Mae and Freddie Mac charge lenders to insure against default.
- The results show that older homebuyers paid higher interest rates, but only up to 8 basis points more on a base cost of 391 basis points.
- One possible explanation for the interest rate gap is that older borrowers might do less comparison shopping for lower rates.
Introduction
As the U.S. population ages and life expectancies increase, more older people will be applying for loans. As a result, it is important to understand how aging affects an individual’s ability to access credit and the rate they pay for that credit. This brief, which is based on a recent paper, is the second of a two-part series that looks at the relationship between age and mortgage outcomes.1Amornsiripanitch (2023). The first brief concluded that older mortgage applicants were significantly more likely to be turned down for a loan than their younger counterparts. This brief focuses on the relationship between age and the cost of mortgages.
As in the first brief, the analysis is based on millions of mortgage applications from the confidential Home Mortgage Disclosure Act (HMDA) data, which include extensive information about the applicant, the property, and the loan. The analysis compares the rate on the loan with that on the Fannie Mae and Freddie Mac loan-level pricing adjustment grids. The notion is that if the loans were originated to be sold, then the lender’s price should only depend on the grid’s fee structure and any deviations across age groups are unrelated to credit risk. In practice, the analysis is implemented using a regression that relates the rate on the loan to demographic variables, controlling for the grid fees and the lender.
The discussion proceeds as follows. The first section offers some background on how Fannie Mae and Freddie Mac prices are determined. The second section describes the data and the methodology. The third section presents the results, which show loan rates increasing monotonically with age, with an ultimate difference of 8 basis points between homebuyers in their 30s and those 70+. The fourth section offers some possible reasons for this relationship. The final section concludes that, while the results from the first brief showing that the probability of being turned down for a mortgage increased sharply with age were both statistically significant and large, the relationship between age and price – at least for loans sold to Fannie Mae and Freddie Mac – were modest. Yes, older applicants paid more and the results were statistically significant, but an additional 8 basis points on a base cost of 391 basis points does not fundamentally change the economics.
How Do the Fannie Mae and Freddie Mac Grids Work?
Since Fannie Mae and Freddie Mac are central to the following analysis, it is worth taking a moment to understand exactly what role they play. The challenge researchers face when attempting to establish that the pricing of a loan is related to characteristics other than credit, such as age, gender, or race, is accounting for all legitimate factors that might cause rates to vary.2Only “conforming” loans qualify for purchase by Fannie Mae or Freddie Mac. These loans require a minimum down payment of 3 percent; a minimum credit score of 620; mortgage insurance until equity reaches 20 percent; a maximum debt-to-equity ratio of 45 percent; and a maximum loan-to-value ratio of 97 percent. In 2023, the maximum loan limit is $726,200. In this study, that goal is achieved by using Fannie Mae and Freddie Mac loan-level price adjustment grids.3This strategy was originally suggested by Bartlett et al. (2022).
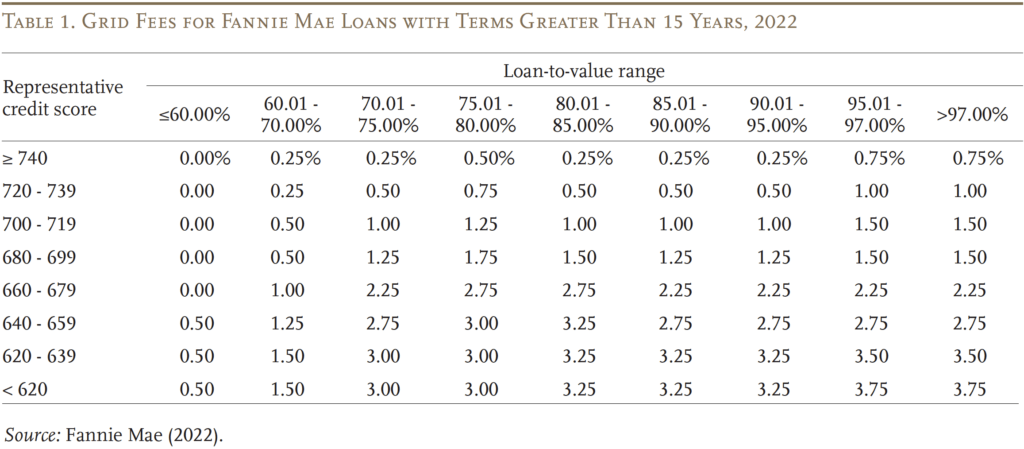
While the grid sounds very complicated, it merely lays out the fees that Fannie Mae and Freddie Mac charge lenders to insure them against credit risk – that is, the loan might default. Specifically, the grid is a matrix with the mortgage’s loan-to-value ratio along one axis and the borrower’s credit score along the other axis. Table 1 presents Fannie Mae’s grid for mortgages backed by single-family homes with terms greater than 15 years. This information was published in April 2022, but has not changed since 2018. For loans with a loan-to-value ratio of 80.01-85.00 percent and a borrower with a credit score of 680-699, Fannie Mae requires the lender to pay an additional 1.5 percent of the loan amount. Freddie Mac’s grid is very similar.
It is important to understand how the grid fits into the lender’s process. The process begins with the lender’s submission of applicant data (credit score, income, liquid reserves, debt-to-income ratio, loan-to-value ratio, property value, etc.) to either Fannie Mae or Freddie Mac. If the automated underwriter system issues an approval, the lenders can offer a price quote to the applicant, and the applicant can then decide to accept or not. If the lender issues the mortgage, it immediately sells it to Fannie Mae or Freddie Mac, which then packages the loan with a pool of similar mortgages into a mortgage-backed security, issues a default-risk guarantee, and sells it to the market. During this process, the lender must decide what interest rate to offer to the applicant. This interest-rate quote consists of three parts. The first is essentially the credit-risk-free rate. The second is the grid fee to cover projected borrower default. The third component of pricing comes from lenders’ discretion.
The critical point for the following analysis is that even if the grid fee is not a perfect predictor of default, it is the amount that enables the lender to get rid of all credit risk. Hence, any interest-rate differences among loans within a given grid cell cannot reflect differential credit risk, and are therefore related to some non-credit-related characteristic. Rates could differ for reasons other than the demographics of the borrower. For example, lenders with higher overhead costs may need to charge more than their lower-cost competitors. The question is whether any differences that do exist for loans in a given cell of the grid reflect lenders’ economics or the personal characteristics of the applicant.
Data and Methodology
To determine the relationship between age and mortgage rate, this analysis uses mortgage application data from the HMDA data set that spans 2018 to 2020. These data contain applicant and co-applicant age in years and a rich set of applicant, property, and loan characteristic variables.
The analysis focuses on a subset of mortgage applications – specifically, loans with one borrower that are conforming fixed-rate 30-year mortgages with credit scores between 620 and 850 (which excludes those with poor scores), loan-to-value ratios between 0.3 and 1.3, and loan amounts greater than or equal to $30,000.4Excluded from the analysis are commercial loans; non-first lien loans; loans with a balloon payment; interest-only loans; loans associated with second homes, investment properties, multi-family properties, or manufactured homes; and loans with uncommon amortizing features. The final sample contains approximately 1.7 million home purchase mortgages and 1.1 million refinance mortgages.
As discussed, the analysis is based on the notion that, for loans that were sold to Fannie Mae and Freddie Mac, the sole determinant of the coupon rates for a given lender is where the loans land in the agency’s grid. The goal is to estimate the correlation between borrower’s age and coupon rate that stem from sources beyond the grid fee and lender characteristics. By including the grid and lender in a regression equation, any remaining relationship between coupon rate and the borrower’s characteristics can be attributed to factors unrelated to relevant credit risk. These factors include differences in shopping behavior and taste-based discrimination.
Hence, the empirical strategy involves estimating the following ordinary least squares regression:
Coupon rate = ƒ(Age, demographics, grid by month FE, lender by county FE)
where the outcome variable coupon rate is reported in basis points. Applicants are sorted into the following age groups: 18-24, 25-29, 30-39, 40-49, 50-59, 60-69, 70 or older, and missing age. Individuals ages 18-24 are used as the reference group. Control variables include demographic characteristics, the grid by month (because the focus is excess over grid), and the lender by county (to address the concern that differences in rates across age groups could reflect the overhead cost of lenders). The coefficient of the demographic variables – specifically age – is the estimate of the relationship between borrower age and coupon rate that is in excess of the grid.
Because Fannie Mae and Freddie Mac have slightly different grids, equations are estimated separately for each entity. The results below are for Fannie Mae.
Results
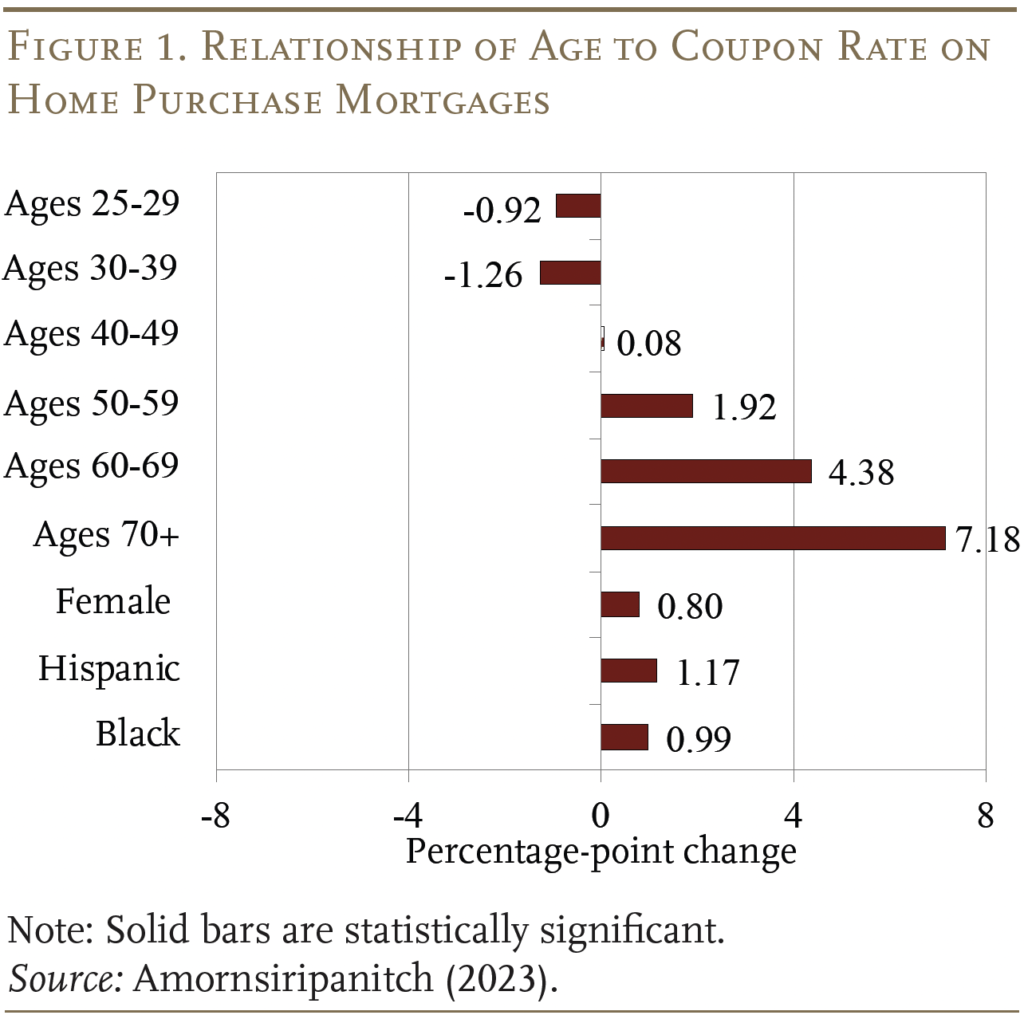
Figure 1 presents the regression results for home purchase loans that were sold to Fannie Mae. Several notable patterns emerge. First, starting from the 30-39 age group, the relationship between borrower age and coupon rate increases monotonically. For example, 70+ borrowers pay, on average, 7.2 basis points more than the reference group or 8.4 basis points more than the 30-39 group. The generally positive relationship between borrower age and coupon rate is robust. The economic magnitudes of the coefficients, however, are not very large when compared to the sample’s unconditional average of 391 basis points.
Separate estimates for Freddie Mac loans produced the same qualitative conclusions. Moreover, regression results using loans that were originated and sold before 2020 suggest that COVID did not affect any of the outcomes.
Comparing the coefficients on the age variables with those on the race and ethnicity variables suggest that age is larger and consistently more statistically significant than race.5In contrast, a study by Bartlett et al. (2022) found that the effect of race and ethnicity on interest rates was about 9 basis points, suggesting that it is equally important to that of age. Interestingly, the coefficient on female is consistently positive and statistically different from zero. That is, female borrowers receive higher coupon rates than male borrowers for reasons beyond the grid.
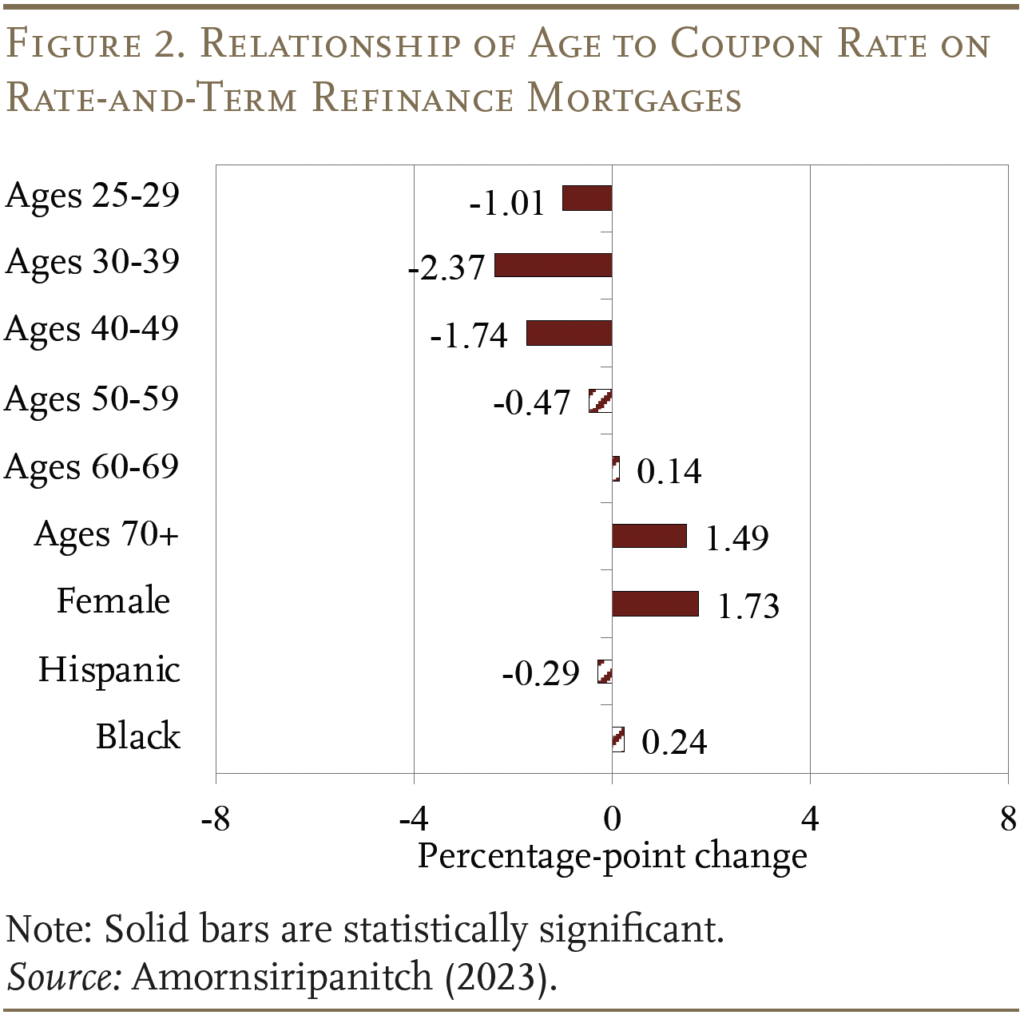
Figure 2 presents the results for rate-and-term refinance loans sold to Fannie Mae. These results show a similar pattern for the relationship between age and coupon rate, with older age groups paying more than younger age groups. However, compared to the home purchase results, the coefficients for the refinance loans are smaller for the older age groups, and the only one that is statistically significant is for those ages 70+. (The results for loans sold to Freddie Mac show a similar pattern, albeit the positive coefficient for those 70+ is no longer statistically significant.) Again, the coefficient on female is positive, statistically significant, and relatively large. In terms of race, the results are not statistically significant.
In short, the relationship between age and coupon rate for home purchase mortgages sold to Fannie Mae and Freddie Mac is strongly positive, and the finding is very robust. The magnitude, however is modest. And, while the results for refinance mortgages show the same general pattern, the effects are weaker. The remaining question is why any relationship should exist between age and coupon rate after controlling for the grid fee.
Possible Explanations
In the case of the earlier brief, which examined the relationship between rejection rates and age, a fairly convincing rationale emerged for the pattern – namely, age-related mortality risk. Having a borrower die can be costly to the lender, because it increases the likelihood of the loan being paid off early (prepayment risk) or entering foreclosure (default and recovery risk). Mortality risk is higher for older borrowers than for younger borrowers. Therefore, a rational and risk-averse lender should consider age-related risks when making lending decisions.
Such an explanation is not relevant for this analysis where the lender does not face any default risk. And the high-overhead/low-overhead explanation across lenders cannot be the reason the coupon rate increases with age because the regression equation controlled for lender.
One possible explanation for the positive correlation between borrower age and coupon rate is differences in shopping behavior across age groups. Since search can be costly, it is plausible that, due to a higher likelihood of physical or mental fatigue and technology aversion, older borrowers perform a less comprehensive search of potential lenders than younger borrowers.6Hortacsu and Syverson (2004). Therefore, older borrowers end up receiving less favorable coupon rates because they cannot provide competing rates for lenders to match.
In principle, taste-based age discrimination could also cause a positive relationship between borrower age and coupon rate, but the analysis provides no information to either rule in or rule out this explanation.7Along similar veins, market segmentation or differences in the degree of competition can also give rise to the coupon rate result. If lenders specialize in different segments of the mortgage market (e.g., by geography, loan amount range, credit score range, etc.) that happen to be correlated with age and if the degree of competition across these market segments varies such that the competition is less intense for mortgages associated with older individuals, then the age gap in mortgage coupon rate result could arise.
Conclusion
In today’s aging society, it is important to understand whether aging affects an individual’s access to credit. The first brief in this series concluded that older mortgage applicants were more likely to be turned down for a loan than their younger counterparts – and this effect was both statistically significant and large. One plausible reason for this relationship is that lenders could be taking into account the costly effects of age-related mortality risk when making loan decisions.
This brief examined whether the interest rates charged on home loans varied by the age of the borrower. It did find that older borrowers paid more but, in this case, the size of the effect was modest. Specifically, for home purchase mortgages, older loan recipients paid an additional 8 basis points, compared to a base cost of 391 basis points. This difference in rates by age could potentially be explained by consumer behavior; for example, older borrowers may do less comparison shopping for the best rate.
One other interesting finding is that women were consistently more likely to pay higher rates than men, which could be a topic for future research.
References
Amornsiripanitch, Natee. 2023. “The Age Gap in Mortgage Access.” Working Paper 23-03. Philadelphia, PA: Federal Reserve Bank of Philadelphia.
Bartlett, Robert, Adair Morse, Richard Stanton, and Nancy Wallace. 2022. “Consumer-lending Discrimination in the Fintech Era.” Journal of Financial Economics 143(1): 30-56.
Fannie Mae. 2022. “Loan-level Price Adjustment Grid.” (Published on April 6). Washington, DC.
Hortacsu, Ali and Chad Syverson. 2004. “Product Differentiation, Search Costs, and Competition in the Mutual Fund Industry: A Case Study Of S&P 500 Index Funds.” The Quarterly Journal of Economics 119(2): 403-456.
Endnotes
- 1Amornsiripanitch (2023).
- 2Only “conforming” loans qualify for purchase by Fannie Mae or Freddie Mac. These loans require a minimum down payment of 3 percent; a minimum credit score of 620; mortgage insurance until equity reaches 20 percent; a maximum debt-to-equity ratio of 45 percent; and a maximum loan-to-value ratio of 97 percent. In 2023, the maximum loan limit is $726,200.
- 3This strategy was originally suggested by Bartlett et al. (2022).
- 4Excluded from the analysis are commercial loans; non-first lien loans; loans with a balloon payment; interest-only loans; loans associated with second homes, investment properties, multi-family properties, or manufactured homes; and loans with uncommon amortizing features.
- 5In contrast, a study by Bartlett et al. (2022) found that the effect of race and ethnicity on interest rates was about 9 basis points, suggesting that it is equally important to that of age.
- 6Hortacsu and Syverson (2004).
- 7Along similar veins, market segmentation or differences in the degree of competition can also give rise to the coupon rate result. If lenders specialize in different segments of the mortgage market (e.g., by geography, loan amount range, credit score range, etc.) that happen to be correlated with age and if the degree of competition across these market segments varies such that the competition is less intense for mortgages associated with older individuals, then the age gap in mortgage coupon rate result could arise.


Amornsiripanitch, Natee. 2023. "Do Older Homeowners Pay More for Mortgages?" Issue in Brief 23-6. Chestnut Hill, MA: Center for Retirement Research at Boston College.