
How Did COVID-19 Affect Household Finances?

Alicia H. Munnell is a columnist for MarketWatch and senior advisor of the Center for Retirement Research at Boston College.
Rising asset markets helped the rich and government payments let the poor break even.
We just finished a study that looks at how the pandemic affected the finances of vulnerable households as well as those with more resources, using data from the Panel Study of Income Dynamics (PSID). The PSID is a panel survey, which allows us to follow the same households over time, that includes in-depth information on household finances.
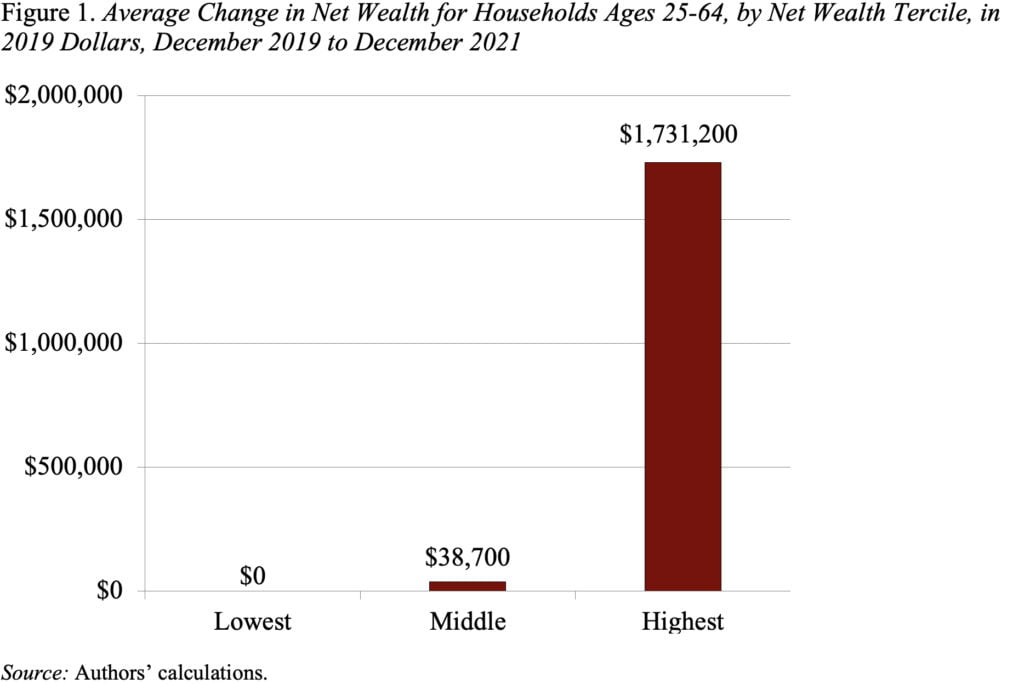
According to a fixed-effects regression based on the PSID, between December 2019 and December 2021, households in the top-wealth third gained an average of $1.7 million and the middle third $38,700. Households in the bottom third, however, showed no statistically significant change over the same period (see Figure 1).
These numbers represent the net of a lot of action over this two-year period – federal support through Economic Impact Payments (EIPs), rising equity/house prices, changes in consumption, and changes in earnings net of Unemployment Insurance (UI) payments. What role did each of these play in the change in net wealth? The first three factors can be estimated from existing data, the fourth – earnings losses not covered by UI – should show up in the residual since it cannot be measured with currently available data.
The easiest component to calculate is the EIPs, which simply vary with household income and number of children. Calculations for the PSID sample show that the lowest-wealth households received an average of $5,400 from these stimulus payments; medium-wealth households $6,000; and the highest-wealth households $4,400.
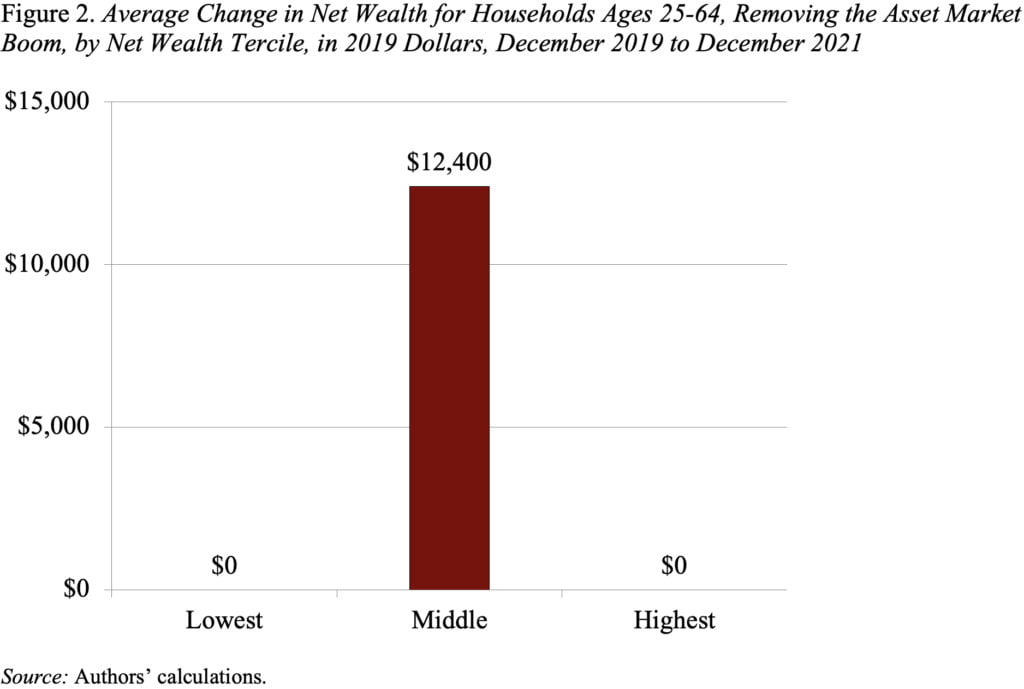
The PSID can also be used to estimate how much of the observed increase in wealth for the middle- and highest-wealth households is due to the spectacular performance of the housing and equity markets. Replacing 2021 housing and equity holdings with 2019 values shows that the gain in net worth for the highest-wealth group is no longer statistically significant (see Figure 2), which means that all the gain can be attributed to increases in house and equity prices. In contrast, households in the middle third see a statistically significant $12,400 increase in their balance sheets in the pandemic period, even after removing asset market gains.
The third factor is changes in consumption, which might help explain why the lowest-wealth households did not see improvements in their wealth. Indeed, data from the Consumer Expenditure Survey confirm this hypothesis (see Figure 3). The lowest-wealth households initially cut their consumption in 2020 but then increased it notably in 2021 for a net increase over the two-year period. Consumption among households in the middle third also increased during the pandemic period, while households in the top third reduced their consumption by $5,300 before they resumed their 2019 spending levels in 2021.
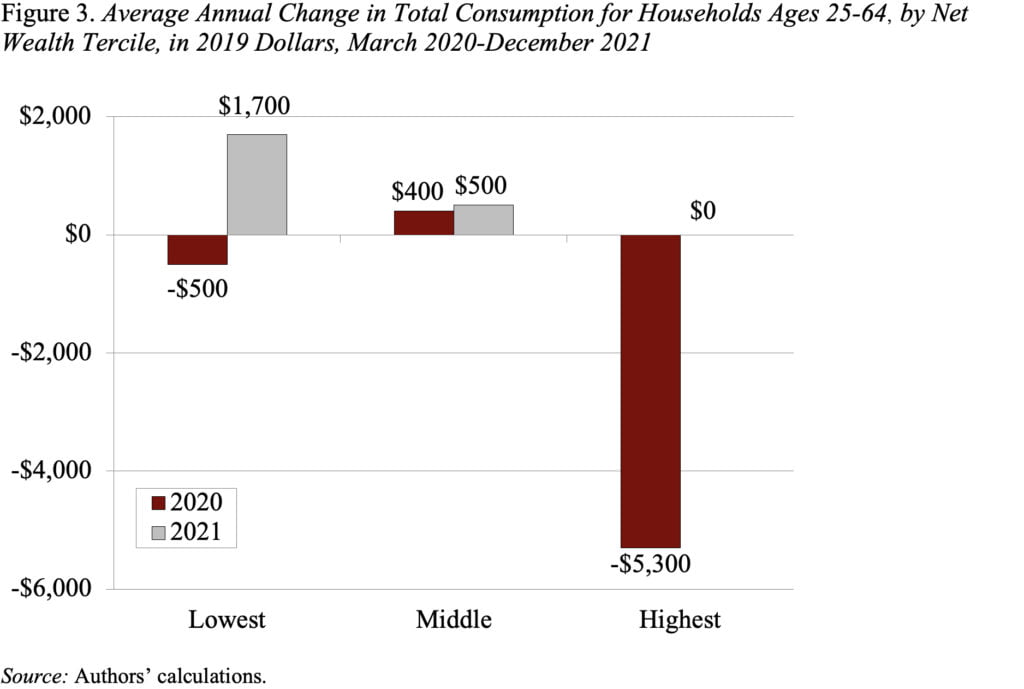
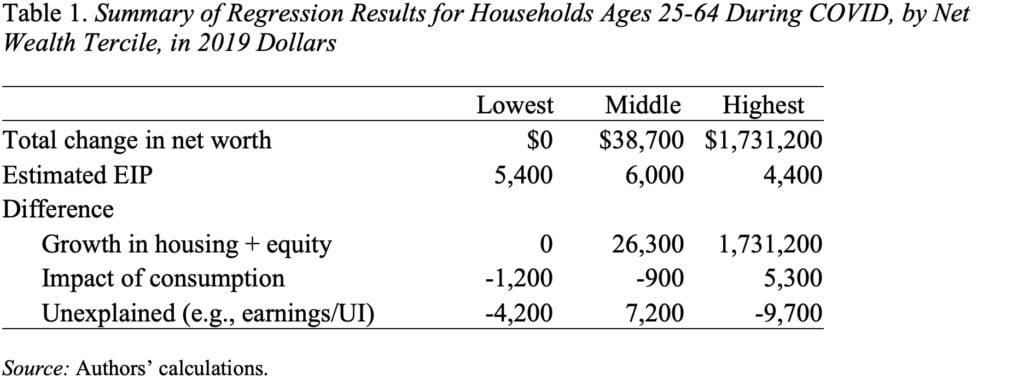
Table 1 summarizes the estimates. Assuming that the unexplained amount – after accounting for EIPs, asset markets, and consumption – does indeed measure the net loss of earnings, then labor market factors explain the loss for the lowest-wealth households, although middle-wealth households appear to have gained from their labor market/UI experience.
This study is only a first pass at explaining the impact of the pandemic on balance sheets. As more and better data on households become available, researchers can better assess total earnings gains and losses and the extent to which UI replaced lost earnings throughout the pandemic.
Despite what is still unknown, these results stand in stark contrast to households’ experiences after the Great Recession, when all households, and particularly the vulnerable, came out way behind.