
How Did the Pandemic Affect Household Balance Sheets?

The brief’s key findings are:
- The COVID recession brought the economy to a halt, but households got robust government support and asset markets soared during 2020-2021.
- Overall, balance sheets showed some improvements during this period:
- high-wealth households saw rapid asset growth from the booming markets; and
- those in the middle got market gains and a boost from government stimulus checks.
- Low-wealth households broke even as the stimulus offset earnings losses, much better than in the Great Recession when they came out way behind.
Introduction
The question is how the COVID-19 pandemic affected the finances of the vulnerable households, as well as those with more resources. On one hand, the shutdown of the economy resulted in salary cuts and job losses. On the other hand, many households received substantial government relief – through stimulus payments and unemployment benefits – and booming housing and equity markets accompanied the rapid economic rebound. Household consumption could also have gone up or down over this topsy turvy period.
This brief, which is based on a recent paper, examines how COVID affected the balance sheets of U.S. households, as measured both by subjective self-assessments and by objective measures of net wealth.1Biggs, Chen, and Munnell (2022). It is only a first look at the issue as the period examined goes from December 2019-December 2021.
The discussion proceeds as follows. The first section describes the financial support provided by the government during the pandemic. The second section discusses the data and methodology used to measure both the change in perceived well-being and changes in actual net worth. The third section presents the results, which include the reported use and perceived effects of the stimulus payments, as well as an assessment of how all of the relevant economic factors affected actual household balance sheets. The final section concludes that high-wealth households gained an enormous amount from the run-up of housing and equity prices during the period we examine; the stimulus payments and market gains helped boost the balance sheets of middle-wealth households; and the stimulus payments allowed low-wealth households to break even – a stark difference from the Great Recession.
Government Support
Many U.S. households, not merely those with low incomes, often feel stretched financially. The pandemic would have worsened this situation as the economy came to a halt and businesses shut down, likely increasing the share of households unable to smooth financial shocks. Fortunately, Congress provided most households, regardless of employment status, with Economic Impact Payments (EIPs) and expanded Unemployment Insurance (UI) benefits for those that experienced a job loss. EIPs provided single households earning less than $75,000 and married households earning less than $150,000 with cash payments totaling up to $3,200 and $6,400 respectively.2A back-of-the-envelope estimate using IRS Statistics on Income W-2 data shows that between 70-80 percent of taxpayers were eligible for the full EIP checks. A higher share was eligible for full or partial checks. Additionally, households with dependent children received up to $2,500 more for each child (see Table 1).
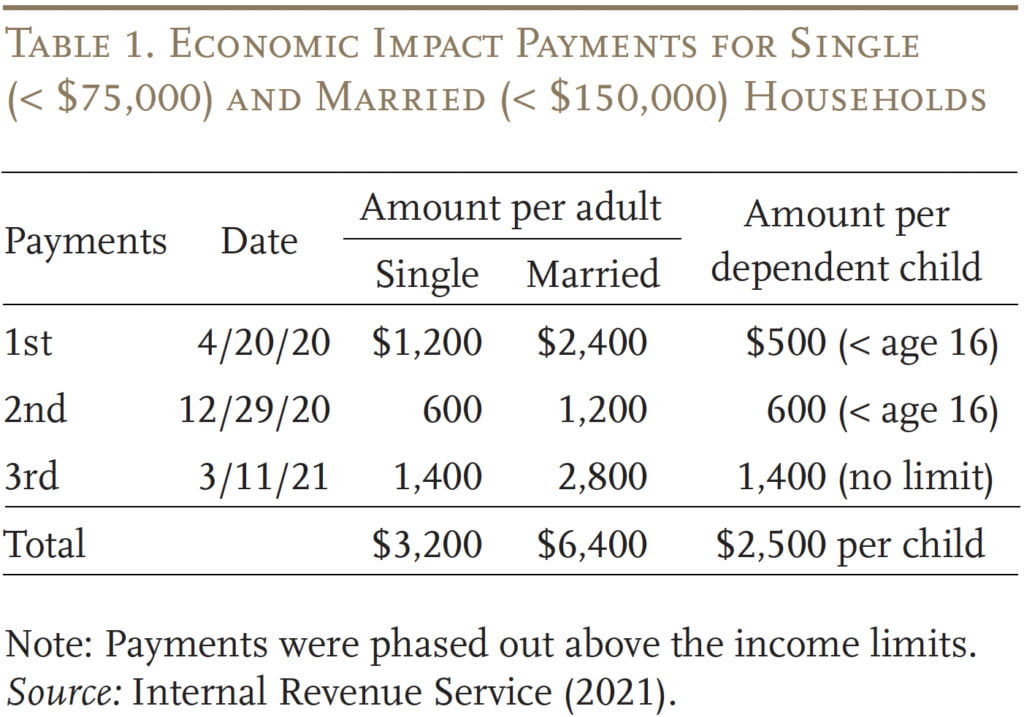
In addition to EIPs, Congress expanded UI eligibility and provided supplementary UI benefits to help smooth income shocks for households with lost earnings.3Several temporary COVID UI programs aided the unemployed. The CARES Act provided most UI claimants with an additional $600 per week. These additional benefits expired on July 25, 2020. The Continuing Assistance Act provided an additional $300 per week from December 27, 2020 to March 14, 2021. There were no Congressionally approved supplemental UI benefits between July and December 2020; however, President Trump issued a memorandum that allowed the Federal Emergency Management Agency to provide grants to states to supplement benefits for certain UI claimants. The grants provided an additional $300 per week. Practically, the impact of the grants was limited as the funding could only provide additional benefits between August 26, 2020 and September 6, 2020.
The American Rescue Plan Act provided an additional $300 per week in benefits starting on March 14, 2021; this provision expired on September 4, 2021. However, 26 states sought to terminate temporary pandemic UI programs by June or July 2021. See Whittaker and Isaacs (2021a, 2021b) and Isaacs and Whittaker (2021) for more details. Specifically, Congress approved a total of 49 additional weeks of UI benefits for workers who exhausted state benefits. In addition, the government provided a total of 75 weeks of temporary UI for workers who are not typically eligible for UI, such as the self-employed, independent contractors, gig workers, the partially employed, those unable to work due to COVID-19, and those unable to telework. In terms of supplemental payments, researchers have estimated that, at least initially, the additional $600 in benefits replaced 100 percent or more of pre-pandemic income for 69 percent of workers (see Table 2).4Ganong, Noel, and Vavra (2020).
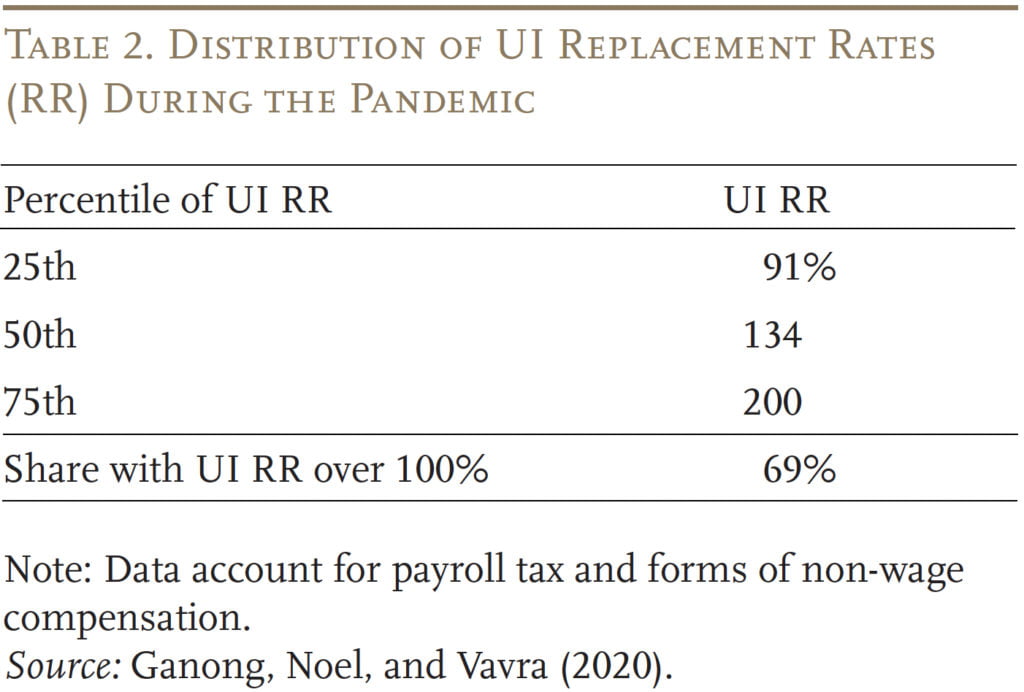
With this level of expanded income support, the hope is that, in addition to supplementing lost income, low- and middle-wealth households would see an improvement in their household balance sheets. However, some early analysis found little improvement among households at the bottom of the income and wealth distributions for three reasons.5For a discussion of the literature to date, see the extended background section in the full paper. First, state UI programs faced administrative challenges in meeting the unemployment surge, often resulting in long delays in payments.6Barnes et al. (2022). Second, the supplemental UI payments were intermittent.7Without the additional $600 (and later $300) in benefits, UI replaces only 41 percent of lost earnings, on average. See Goger, Loh, and Bateman (2020) for more detail. Third, after initial reductions early in the pandemic, households in the bottom half of the income distribution increased their consumption to more than pre-pandemic levels.8Greig, Deadman, and Noel (2021). So, much remains unknown about the impact of the pandemic and EIP payments on household balance sheets.
Data and Methodology
The project examines both households’ perceptions of how EIPs affected their finances and actual changes to their balance sheets. In all cases, the focus is on households ages 25-64.
Perceived Impact
In terms of perceptions about finances, the analysis relies on two data sets. The first, the Survey of Household Economics and Decisionmaking (SHED), focuses directly on how households feel about their finances. This annual survey conducted by the Federal Reserve every year since 2013 asks over 11,000 households subjective and objective questions about their financial well-being. This analysis uses the 2018-2021 SHED as well as the April and July 2020 COVID supplements to answer the question: Did households’ perception of financial stability improve after receiving stimulus payments?
The second dataset is the Household Pulse Survey, a high-frequency survey produced by the U.S. Census Bureau to capture the experiences of households during COVID. The survey, which began on April 23, 2020, interviewed between 40,000 and 110,000 respondents sporadically. This project uses participant data from weeks 1-40, which includes interviews up through December 13, 2021. The analysis focuses on the question: How did households use/plan to use their EIPs? Three regression equations relate the intention to spend, save, or pay down debt to economic, demographic, and state-level variables.
Actual Impact
While the subjective indicators of financial wellness are informative, the goal is to determine the extent to which the stimulus checks actually improved household balance sheets. The main source of data here is the Panel Study of Income Dynamics (PSID). The PSID is a household panel survey, administered every two years since 1968, that collects in-depth information on household finances as well as socioeconomic and demographic characteristics. This analysis focuses on data from the 2015-2019 surveys as well as the 2021 wealth and COVID-19 early release. The final sample includes 6,420 households.
Estimating how much PSID households received in EIP payments is straightforward, because the amount is based on a simple formula that includes marital status, income in 2019, and number of dependent children. But these payments are just one of the factors in play. Determining the net impact of COVID on household balance sheets requires identifying other factors that could have affected household assets – namely, rising equity/housing prices, changes in consumption, and changes in earnings net of UI payments.
This exercise involves estimating three separate equations. The first estimates the change in net wealth between 2019 and 2021. The second estimates the change in net wealth excluding gains due to rising asset prices during the pandemic by replacing 2021 housing and equity holdings with 2019 levels. The third equation then estimates changes in consumption – based on data from the Consumer Expenditure Survey (CEX) – that also could have contributed to changes in net wealth. The residual effect on household balance sheets from combining results from these three equations with EIPs is earnings changes and the extent to which UI replaced lost earnings.9While earnings is the primary factor captured by the residual, a portion of the residual could also be attributed to new purchases of housing or equities – particularly for middle- and high-wealth households. Indeed, homeownership rates increased by 7 percentage points and stock ownership rates by 4 percentage points for the middle-wealth group during the pandemic. The reason that the impact of new asset purchases would show up in the residual is that our method assumes all growth in housing and equity assets is the result of growth in assets holdings in 2019 and does not account for additional or new purchases between 2019 and 2021.
Results
Results are presented separately for households’ perceptions of how EIPs affected their finances and for changes in objective measures of household net wealth.
Perceptions
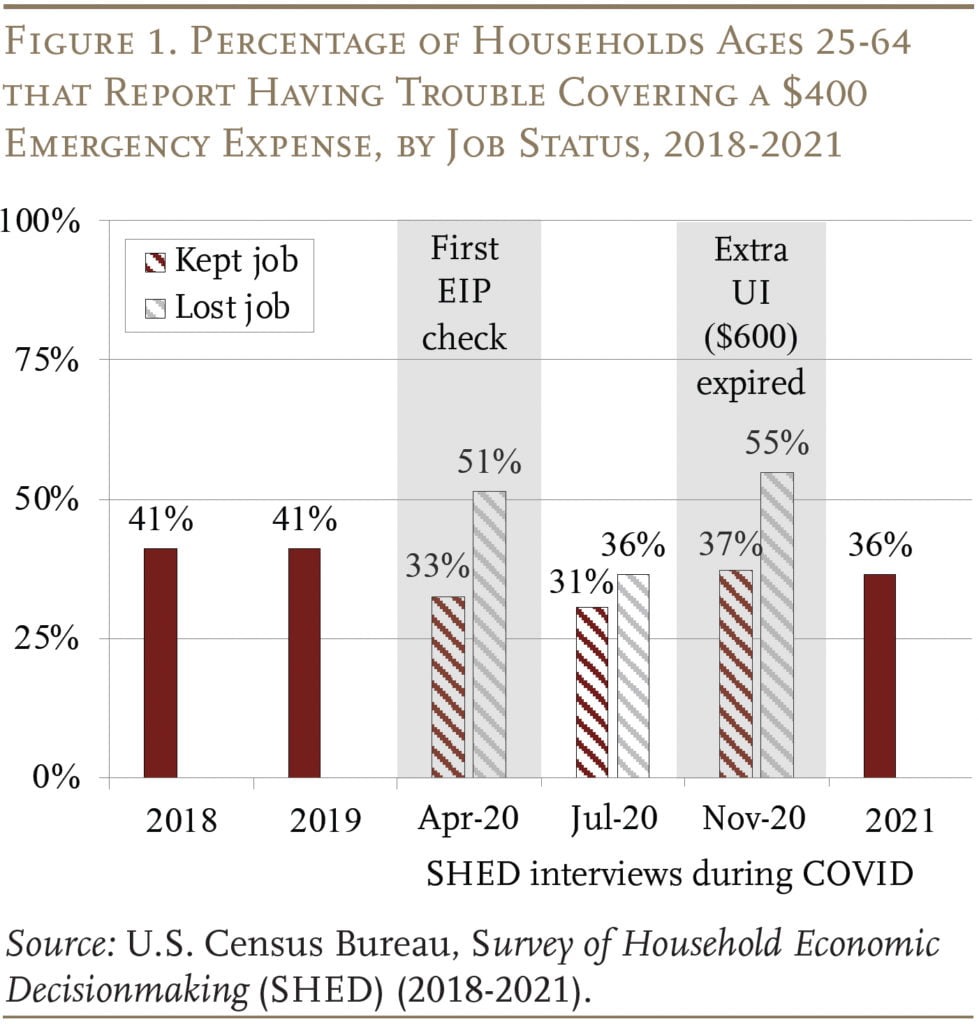
Beginning with the perceived impact of stimulus payments on household financial wellness, the survey results show an improvement in households’ sense of their ability to weather financial shocks. In 2019, 41 percent of households reported that they would have trouble paying for an unexpected expense of $400; in 2021 – after the first EIP payment and expanded UI benefits – that share dropped to 36 percent (see Figure 1).
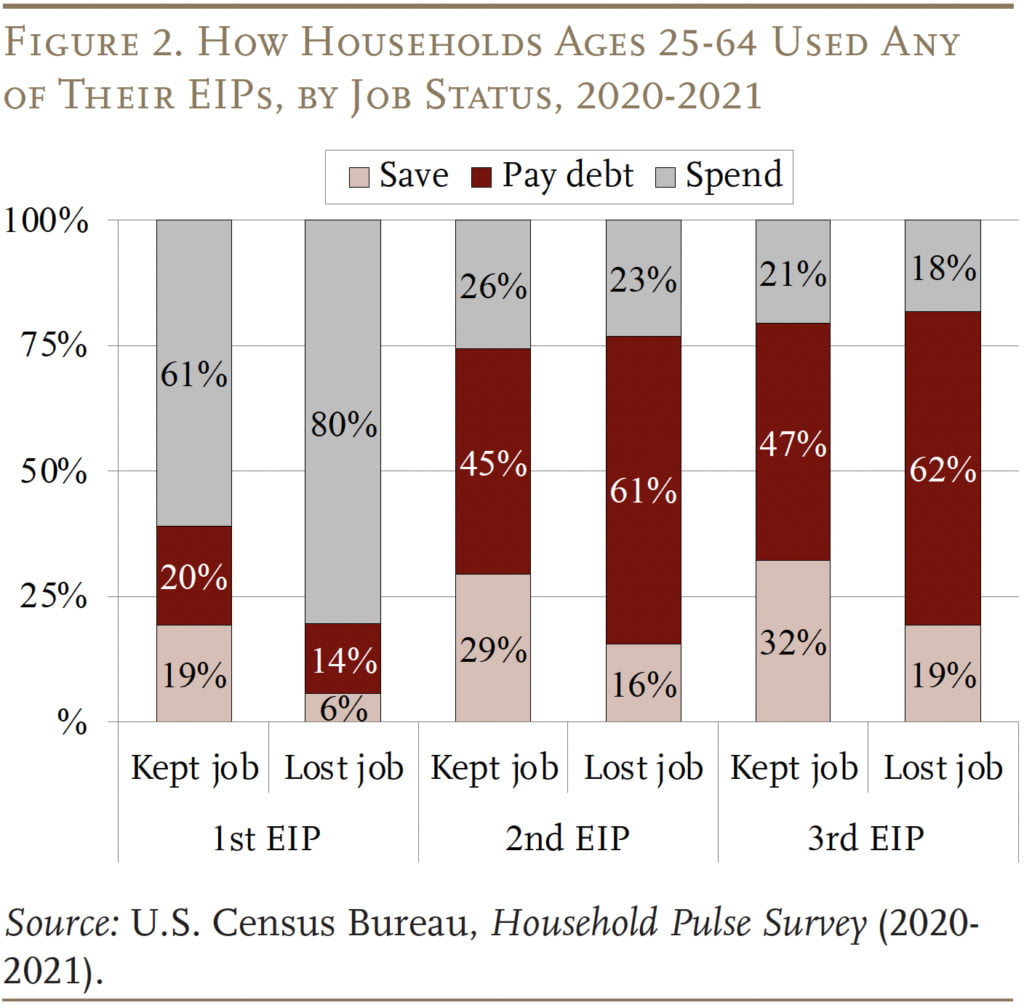
The improvement in perceived well-being corresponds with how households said they used/planned to use their EIP checks. While most households, particularly those that experienced a job loss during the pandemic, spent their first EIP checks, the overwhelming majority of households saved their second and third checks or used them to pay down debt (see Figure 2).
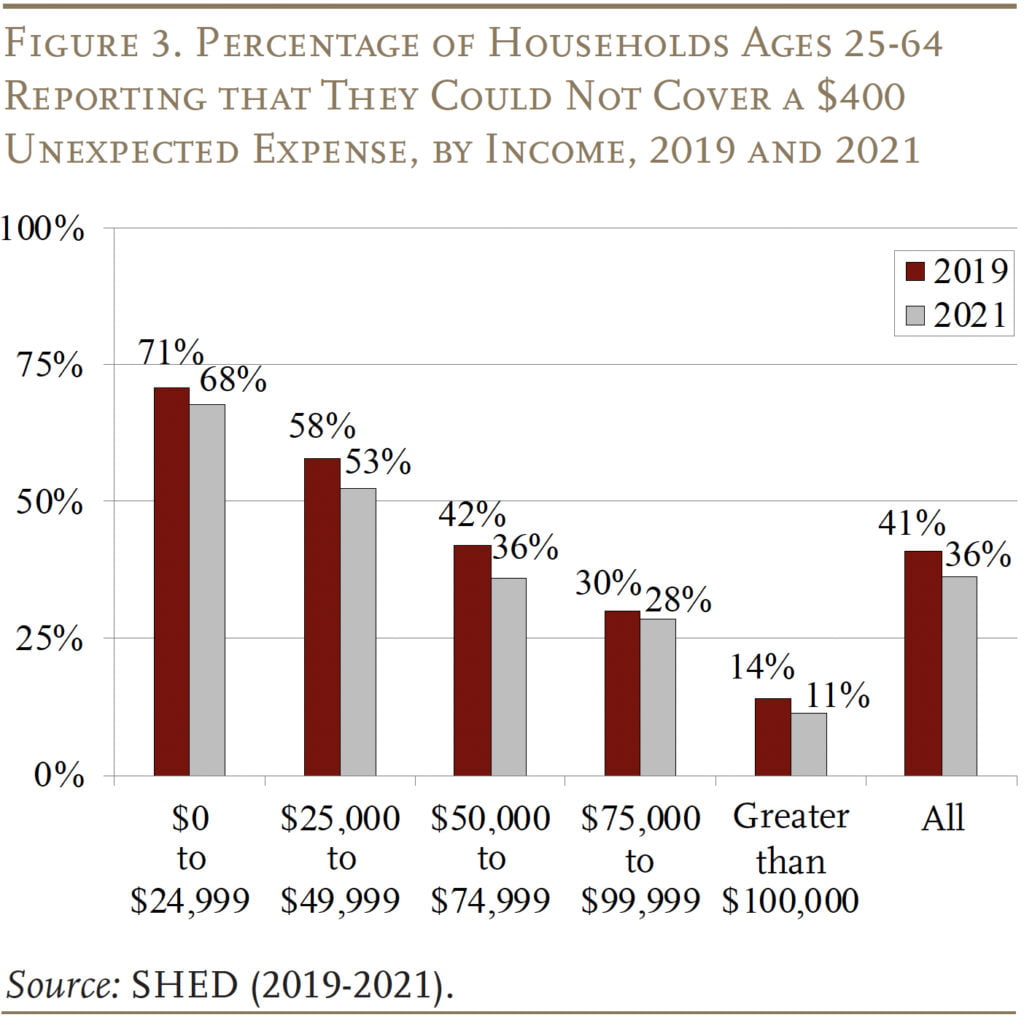
However, how households used their stimulus payments varied substantially by income, with households earning less than $35,000 and between $35,000-$74,999 being 13 percent and 7 percent more likely to spend their stimulus payments than households making more than $150,000.10Households making more than $150,000 did not receive full EIP checks. Despite this pattern, households across the income distribution report some improvements in their ability to handle unexpected expenses in 2021 relative to the pre-pandemic period (see Figure 3).
Reality
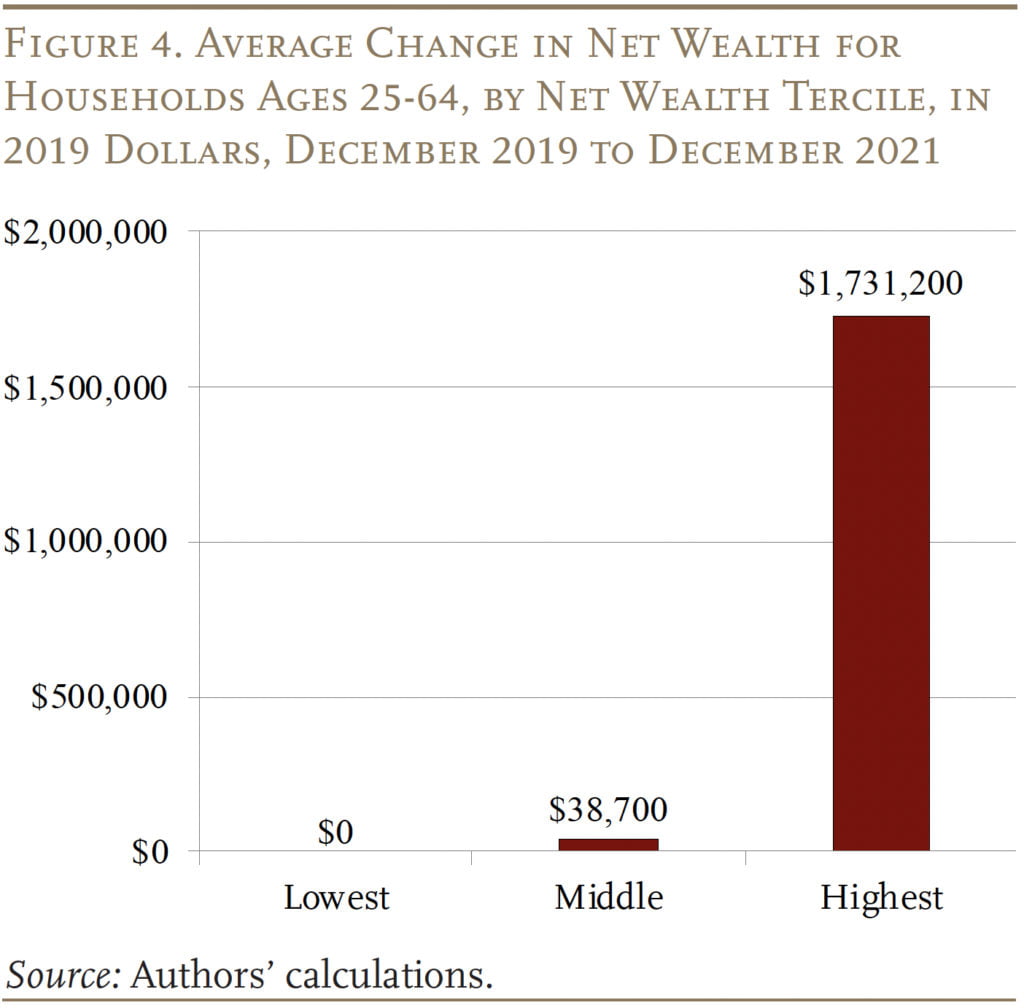
Households perceive that their financial situations have improved since the pandemic, but have they actually improved? A fixed-effect regression of total net wealth shows that households in the middle- and highest-wealth terciles did indeed experience gains in their balance sheets of about $39,000 and $1.7 million, respectively, over the period December 2019- December 2021.11Regression estimates are averages and there is a long tail for the top tercile. Households in the lowest-wealth tercile, however, showed no statistically significant change over the same period (see Figure 4).
During this period, low-wealth households received an average of $5,400 from stimulus checks; medium-wealth households received $6,000; and high-wealth households received $4,400.12Middle-wealth households received more EIP money than low-wealth households because they are much more likely to be married and EIP checks were scaled based on the number of working adults in 2019. Why did the net worth of low-wealth households not improve despite the EIP? And what accounts for the additional money for middle- and high-wealth households?
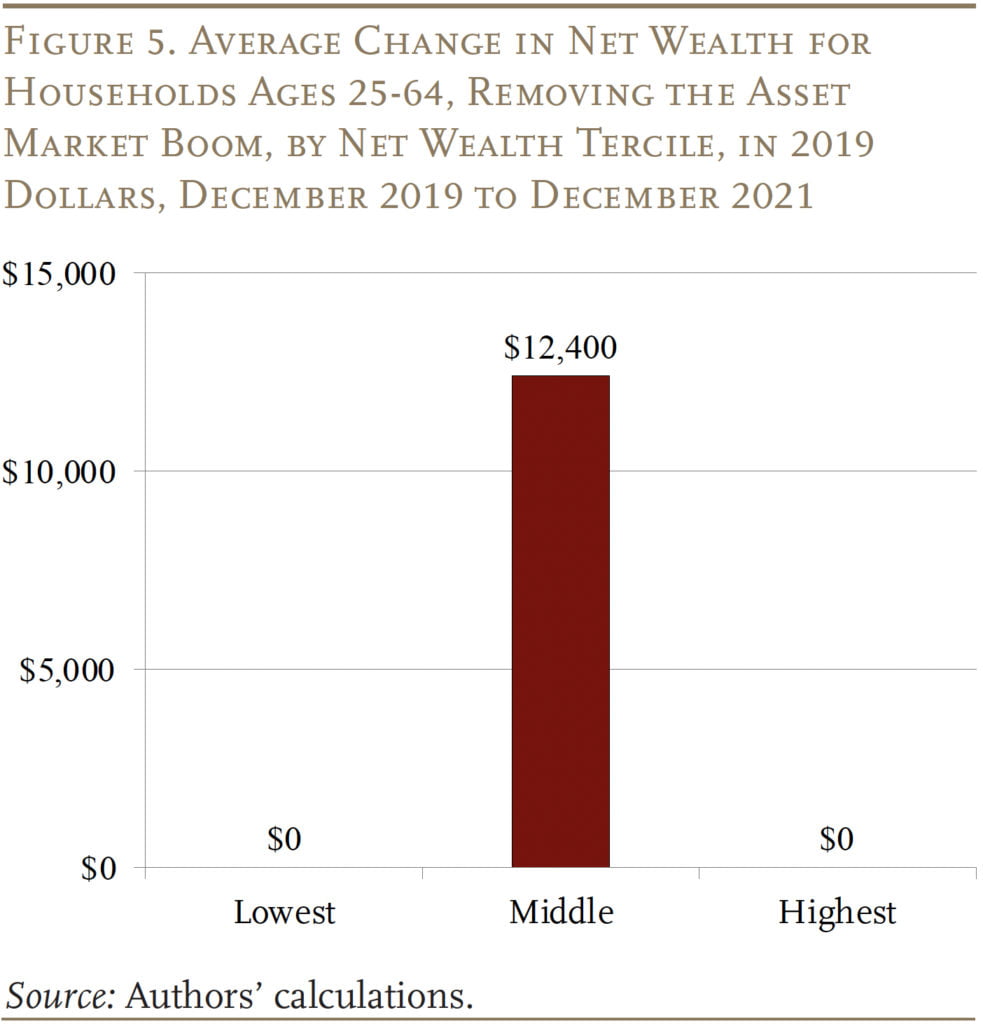
As discussed above, in addition to EIPs, three other factors can result in a change in net wealth: 1) increases in asset prices; 2) changes in consumption; and 3) changes in earnings. Much of the observed increase in wealth for middle-wealth and, particularly, high-wealth households is likely due to the spectacular performance of the housing and equity markets. This assumption is borne out when the same equation is re-estimated, replacing 2021 housing and equity holdings with 2019 values. The gain in net worth for the highest wealth tercile is no longer statistically significant (see Figure 5), which means that all the gain can be attributed to increases in house and equity prices. In contrast, households in the middle tercile see a statistically significant $12,400 increase in their balance sheets in the pandemic period, even after removing asset market gains.
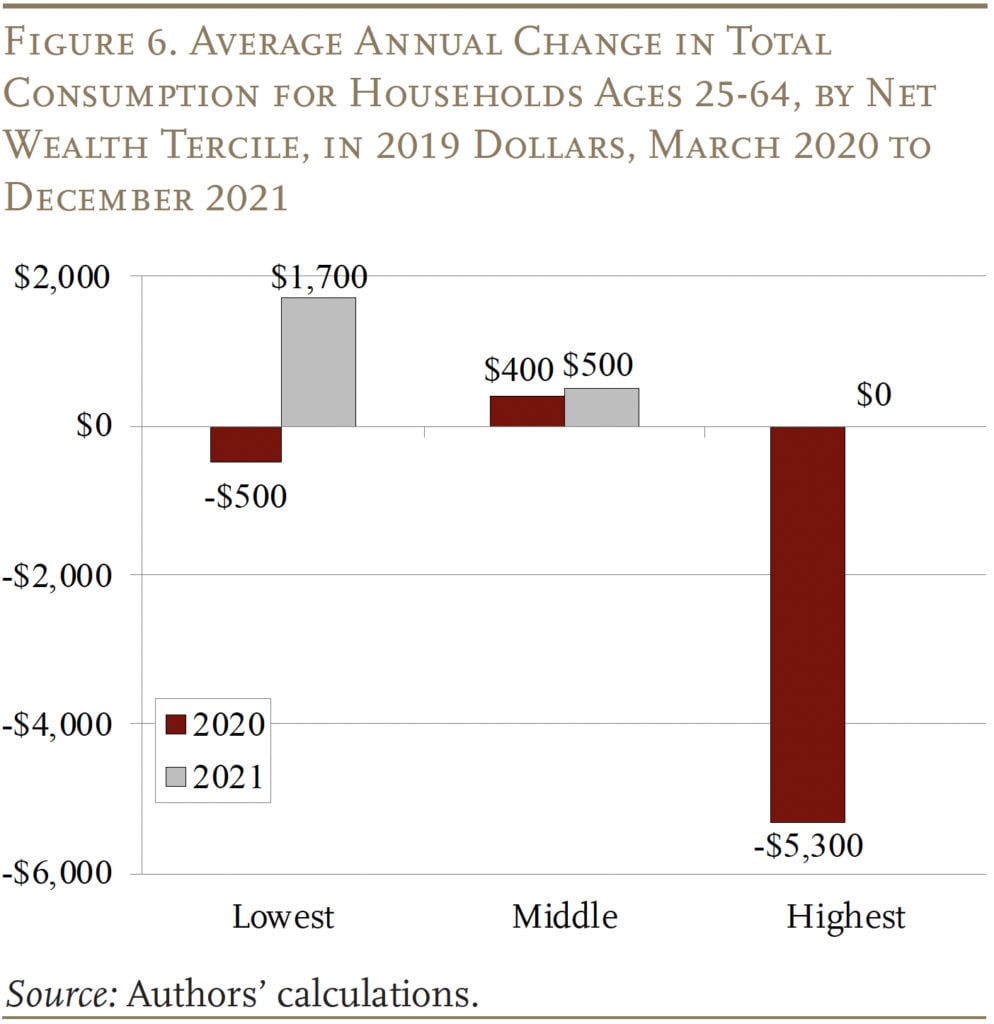
It is surprising that lower-wealth households did not see improvements in their wealth because much of the stimulus and relief payments were aimed at providing the most support for the most vulnerable. One explanation is that lower-wealth households increased their consumption.13A Washington Post analysis of CoStar data shows that rents of low-quality homes increased during the pandemic while rents for high-quality homes decreased (Rampell 2021). Analysis of the CEX shows that their consumption declined in 2020, but then increased notably in 2021 for a net increase over the two-year period (see Figure 6). Further analysis showed that the increases in household expenditures were driven by increases in food and housing.14For a breakdown of different categories of expenditures, see the Appendix section of the full paper. Consumption among households in the middle tercile also increased during the pandemic period, while households in the top tercile reduced their consumption by $5,300 before resuming their 2019 spending levels in 2021.15We only observe households for three quarters in 2021. For the fourth quarter, we assume expenditure changes are the same as the average for the first three quarters.
A summary of all the regression estimates can be found in Table 3. For households across the wealth distribution, a portion of pandemic wealth changes remain unexplained and are likely attributable to changes in earnings (and the extent to which UI replaced lost earnings), which cannot be measured with currently available data.
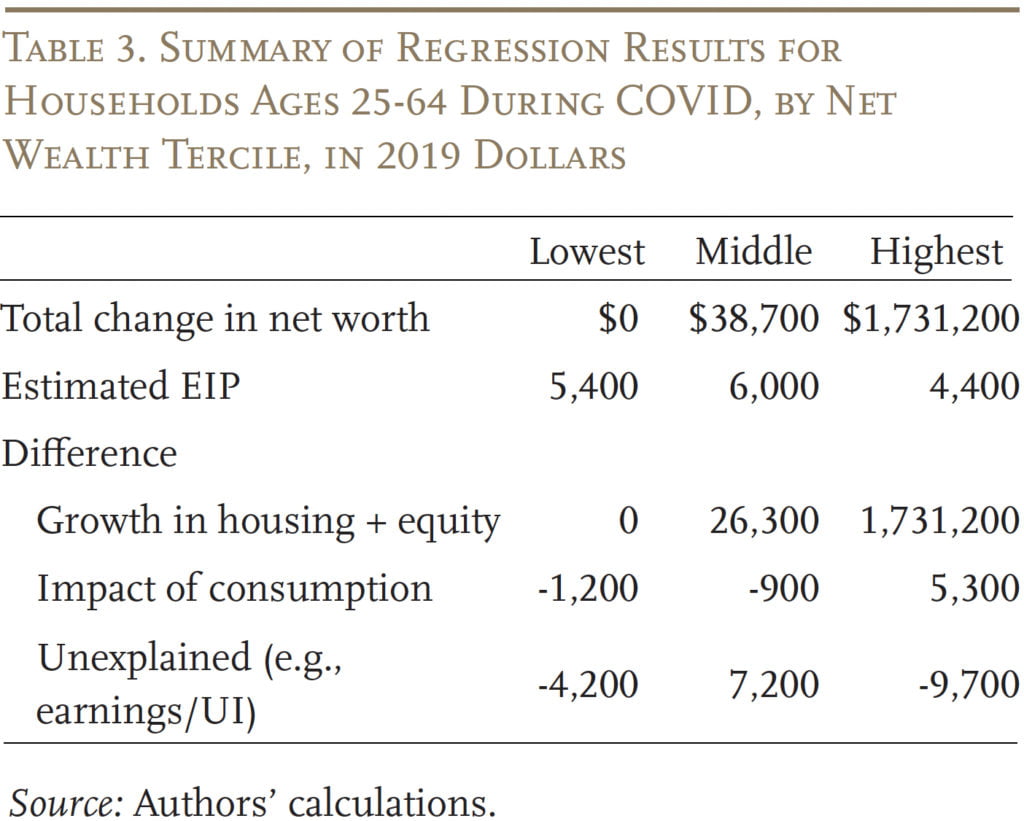
In terms of explaining the overall changes in net worth, for low-wealth households, the negative impact of earnings losses from bad labor market experiences and increases in consumption fully offset the stimulus payments, so they ended up breaking even. Middle-wealth households saw some earnings-related gains, which combined with rising asset markets and stimulus checks propelled their overall increase in net worth. Finally, the very large gains in net worth for high-wealth households were driven almost entirely by the asset markets.16Because the analysis cannot directly measure changes in earnings and new asset purchases, an important component for high-wealth households, the measures are less accurate for these households. While the dollar amount is large, the change is very small relative to their net wealth.
Conclusion
The early COVID period included a shutdown of the economy; robust government support to offset the downturn; and soaring housing and equity markets. This brief examined the net impact of these various factors on household balance sheets.
The good news is that households report saving most of the stimulus payments, and at the end of 2021 more households felt they could handle unexpected expenses than in 2019. Equally important, actual balance sheets showed improvements. The top-wealth group saw tremendous growth in their net wealth, almost all of which was due to the spectacular performance of the housing and equity markets during 2020-2021. Middle-wealth households also benefited from the market gains; and they experienced a boost from EIP payments and higher wages. For low-wealth households, the EIPs supported earnings losses where intermittent UI supplements fell short and also helped cover rising consumption. As more data on households become available, researchers can better assess total earnings gains and losses and the extent to which UI replaced lost earnings throughout the pandemic.
Despite what is still unknown, these results stand in stark contrast to households’ experiences after the Great Recession, when all households and particularly the vulnerable came out way behind, and is evidence of the important role of fiscal support and a speedy labor market recovery in allowing middle-wealth households to potentially build long-term wealth gains and preventing the financial deterioration of low-wealth households.
References
Barnes, Mitchell, Wendy Edelberg, Sara Estep, and Moriah Macklin. 2022. “Bolstered Balance Sheets: Assessing Household Finances since 2019.” Economic Analysis. Washington, DC: Brookings Institution.
Biggs, Andrew G., Anqi Chen, and Alicia H. Munnell. 2022. “Did the Pandemic Improve Household Balance Sheets?” Working Paper 2022-14. Chestnut Hill, MA: Center for Retirement Research at Boston College.
Ganong, Peter, Pascal Noel, and Joseph Vavra. 2020. “US Unemployment Insurance Replacement Rates During the Pandemic.” Journal of Public Economics 191: 104273.
Goger, Annelies, Tracy Hadden Loh, and Nicole Bateman. 2020. “Debunking Myths About COVID-19 Relief’s ‘Unemployment Insurance on Steroids.”’ Washington, DC: Brookings Institution.
Greig, Fiona, Erica Deadman, and Pascal Noel. 2021. “Family Cash Balances, Income, and Expenditures Trends through 2021: A Distributional Perspective.” New York, NY: JPMorgan Chase Institute.
Internal Revenue Service. 2021. “Economic Impact Payments.” Washington, DC.
Isaacs, Kateline P. and Julie M. Whittaker. 2021. “Unemployment Insurance Provisions in the American Rescue Plan Act of 2021.” IF11786. Washington, DC: Congressional Research Service.
Rampell, Catherine. 2021. “Rents for the Rich Are Plummeting. Rents for the Poor Are Rising. Why?” (March 22). Washington, DC: The Washington Post.
U.S. Board of Governors of the Federal Reserve System. Survey of Household Economics and Decisionmaking, 2019-2020. Washington, DC.
U.S. Bureau of Labor Statistics. Consumer Expenditure Survey, 2020-2021. Washington, DC.
U.S. Census Bureau. Household Pulse Survey, 2020-2021. Washington, DC.
Whittaker, Julie M. and Kateline P. Isaacs. 2021a. “Current Status of Unemployment Insurance (UI) Benefits: Permanent-Law Programs and COVID-19 Pandemic Response.” R46687. Washington, DC: Congressional Research Service.
Whittaker, Julie M. and Kateline P. Isaacs. 2021b. “States Opting Out of COVID-19 Unemployment Insurance (UI) Agreements.” IN11679, Updated August 20. Washington, DC: Congressional Research Service.
Endnotes
- 1Biggs, Chen, and Munnell (2022).
- 2A back-of-the-envelope estimate using IRS Statistics on Income W-2 data shows that between 70-80 percent of taxpayers were eligible for the full EIP checks. A higher share was eligible for full or partial checks.
- 3Several temporary COVID UI programs aided the unemployed. The CARES Act provided most UI claimants with an additional $600 per week. These additional benefits expired on July 25, 2020. The Continuing Assistance Act provided an additional $300 per week from December 27, 2020 to March 14, 2021. There were no Congressionally approved supplemental UI benefits between July and December 2020; however, President Trump issued a memorandum that allowed the Federal Emergency Management Agency to provide grants to states to supplement benefits for certain UI claimants. The grants provided an additional $300 per week. Practically, the impact of the grants was limited as the funding could only provide additional benefits between August 26, 2020 and September 6, 2020.
The American Rescue Plan Act provided an additional $300 per week in benefits starting on March 14, 2021; this provision expired on September 4, 2021. However, 26 states sought to terminate temporary pandemic UI programs by June or July 2021. See Whittaker and Isaacs (2021a, 2021b) and Isaacs and Whittaker (2021) for more details. - 4Ganong, Noel, and Vavra (2020).
- 5For a discussion of the literature to date, see the extended background section in the full paper.
- 6Barnes et al. (2022).
- 7Without the additional $600 (and later $300) in benefits, UI replaces only 41 percent of lost earnings, on average. See Goger, Loh, and Bateman (2020) for more detail.
- 8Greig, Deadman, and Noel (2021).
- 9While earnings is the primary factor captured by the residual, a portion of the residual could also be attributed to new purchases of housing or equities – particularly for middle- and high-wealth households. Indeed, homeownership rates increased by 7 percentage points and stock ownership rates by 4 percentage points for the middle-wealth group during the pandemic. The reason that the impact of new asset purchases would show up in the residual is that our method assumes all growth in housing and equity assets is the result of growth in assets holdings in 2019 and does not account for additional or new purchases between 2019 and 2021.
- 10Households making more than $150,000 did not receive full EIP checks.
- 11Regression estimates are averages and there is a long tail for the top tercile.
- 12Middle-wealth households received more EIP money than low-wealth households because they are much more likely to be married and EIP checks were scaled based on the number of working adults in 2019.
- 13A Washington Post analysis of CoStar data shows that rents of low-quality homes increased during the pandemic while rents for high-quality homes decreased (Rampell 2021).
- 14For a breakdown of different categories of expenditures, see the Appendix section of the full paper.
- 15We only observe households for three quarters in 2021. For the fourth quarter, we assume expenditure changes are the same as the average for the first three quarters.
- 16Because the analysis cannot directly measure changes in earnings and new asset purchases, an important component for high-wealth households, the measures are less accurate for these households. While the dollar amount is large, the change is very small relative to their net wealth.


Biggs, Andrew G., Anqi Chen, and Alicia H. Munnell. 2023. "How Did the Pandemic Affect Household Balance Sheets?" Issue in Brief 23-5. Chestnut Hill, MA: Center for Retirement Research at Boston College.