CBO’s Social Security Deficit Exceeds Trustees
Alicia H. Munnell is a columnist for MarketWatch and senior advisor of the Center for Retirement Research at Boston College.
But differing mortality assumptions don’t alter the basic picture
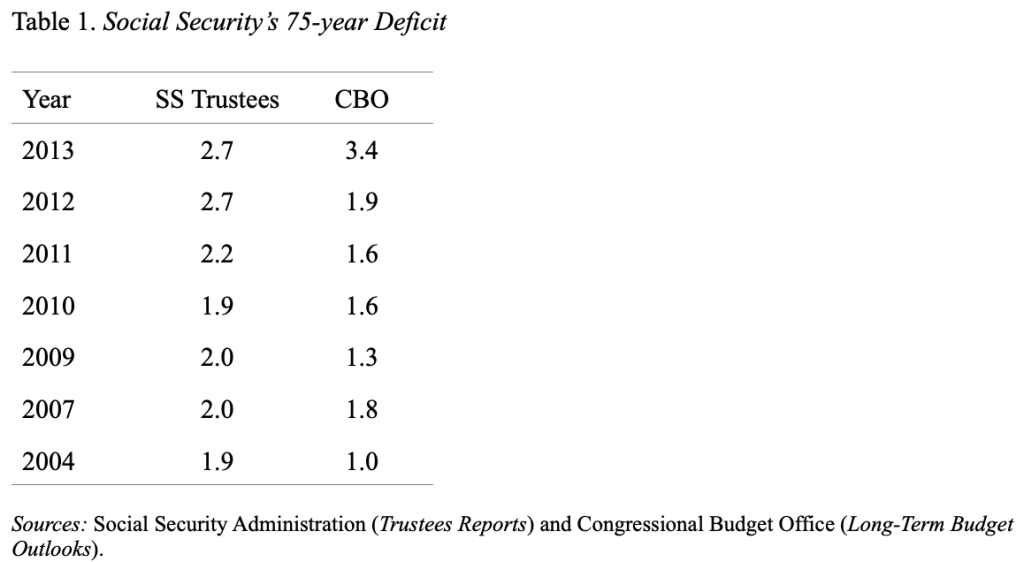
For the past decade, the Congressional Budget Office (CBO) has projected lower 75-year deficits than the Social Security Trustees. That relationship has now reversed, with CBO projecting a larger 75-shortfall (see Table 1). One reason for the reversal is that CBO has switched from relying on the Social Security actuaries’ mortality assumptions and have come up with their own. The question is whether this is an earth-shattering development or another data point.

Both the CBO and the Trustees present almost an identical picture of Social Security relative to the economy. Social Security costs as a percent of GDP are scheduled to rise from about 5 percent today to 6.2 percent around 2040. Therefore, the new life expectancy numbers do not involve exploding Social Security costs.

But CBO’s new life expectancy numbers do explain a big portion of the increase in its previous estimate of Social Security’s 75-year deficit. The Appendix to CBO’s 2013 Long-Term Budget Outlook, and a recent blog, explain the reasons for the new mortality assumptions. The key metric is the average annual decline in mortality rates. Social Security assumes that mortality will decline over the next 75 years at an average pace of 0.80 percent, while CBO assumes an average annual decline of 1.17 percent. The difference between the two produces life expectancies in 2060 of 83.6 for Social Security and 84.9 for CBO. The longer the life expectancy, the greater the Social Security costs.
The CBO points to the fact that Social Security’s assumption is lower than the decline seen in recent decades and lower than that used by the Census Bureau. And CBO cites the work of several demographers who argue that mortality rates will decline faster than assumed by Social Security. For example, Lee and Carter (1992) found that age-specific mortality declined at a relatively constant rate from the early 1930s to the late 1980s, despite changes in individual behavior and improvements in medical technology and public sanitation, suggesting that mortality rates will continue to decline at their current pace. In addition, the four most recent Social Security technical panels, which advise the agency on its assumptions, recommended basing mortality assumptions on the extrapolation of past trends. The CBO has bought this argument and based its mortality rates on the average improvement beginning in 1950.
So what are the Social Security actuaries thinking? Fortunately, they have carefully laid out their thoughts in a background memorandum for the 2013 Trustees Report. Yes, they have read the exhortations to base future improvements on past trends. But they point out that the key to such an approach is to select the “appropriate” historical period to be used as a base. The current assumption is very close to the average for the period since 1900, a span once advocated by Lee and Carter. Using a period since 1950 would produce a faster rate of improvement (as the new CBO estimates show). And using the period 1800-2000 would produce a much slower improvement. Given the variation across time, past trends should be just one component of future projections. People also need to look at the conditions that contributed to the differing rates of decline in mortality rates over the various periods.
So CBO and Social Security are working from the same knowledge base. The two entities simply come to different conclusions about how to proceed. But they probably both agree that projections of mortality improvement are subject to greater uncertainty than any other variable. Given that uncertainty, the debate will continue. But the range of differing assumptions is unlikely to alter the basic picture of Social Security costs over the next 75 years.


