
How Big Are State and Local Retiree Health Benefits?

Alicia H. Munnell is a columnist for MarketWatch and senior advisor of the Center for Retirement Research at Boston College.
New study provides estimates for states, counties, cities, and school districts.
In addition to pensions, most state and local governments provide other post-employment benefits (OPEBs), the largest of which is retiree health insurance. Retiree health plans have received increased attention in recent years due to rapidly rising health costs and new reporting guidelines from the Governmental Accounting Standards Board (GASB). These guidelines now require states and localities to change the way they account for the cost of retiree health plans from a cash to an accrual basis, essentially applying to OPEB plans the standards used for pensions.
The Center has just completed a comprehensive and up-to-date assessment of OPEB liabilities. The assessment is based on a sample that includes plans in 50 states, 160 counties, 173 major cities, and 415 school districts related to the sample cities. By payrolls, the sample accounts for 100 percent of states, 46 percent of counties, 43 percent of cities, and 26 percent of school districts. In addition, the analysis looks beyond the sample of local governments to estimate aggregate OPEB liabilities for local governments excluded from our sample. The analysis also allocates the liabilities of cost-sharing state plans to participating localities based on the methodology described in GASB 75.
The total reported OPEB liabilities in our sample are $702 billion. In comparison, because most plans are financed on a pay-as-you-go basis, the assets are a miniscule $50 billion. Thus, the total unfunded liability that appears in the actuarial reports of plans in our sample is $653 billion (see Table).
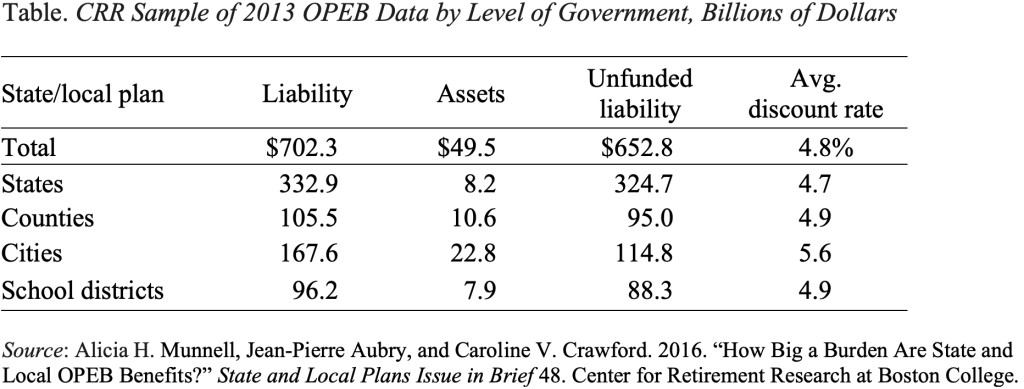
However, many localities are not included in the sample and are not covered by a state OPEB plan. Adding estimates of the assets and liabilities associated with these excluded jurisdictions (based on the ratio of payrolls) increases the total OPEB unfunded liability by $209 billion, producing a total of $862 billion.
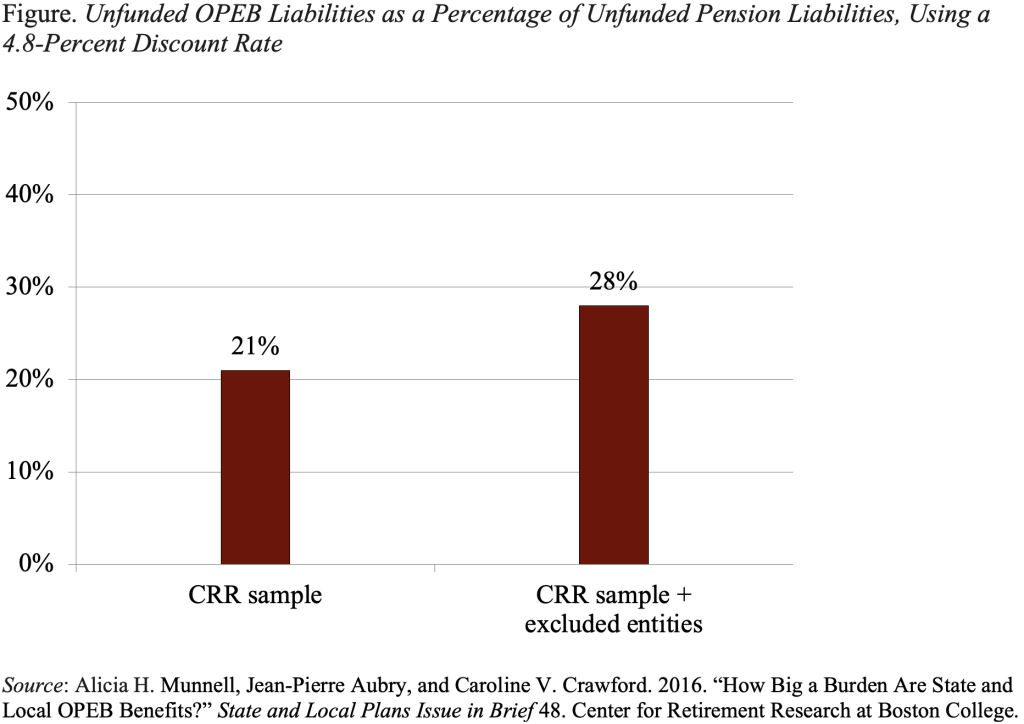
The central question is how big a problem retiree health insurance is for state and local governments. One metric is to compare the unfunded liabilities of the health plans with those of pension plans. Any exercise comparing the size of pension and OPEB liabilities requires using the same discount rate for both. Our comparison relies on the OPEB discount rate, so pension liabilities are adjusted using this rate. Dividing the $653 billion of unfunded liabilities of retiree health plans in our sample by the re-discounted unfunded liabilities of pensions shows that retiree health is equivalent to 21 percent of pensions (see Figure). On the other hand, adding the excluded localities – which increases OPEB, but not pension, liabilities – raises the ratio to 28 percent.
Now that have a clear idea of the size of the problem, next week’s BLOG will attempt to put the OPEB liabilities in perspective.