


How Do Medicaid LTC Policies Impact Jobs and Wages of Nurses and Aides?


The brief’s key findings are:
- With growing demand for long-term care at home, states have used Medicaid waivers to allow more home-and-community-based services for older adults.
- To test if this shift has impacted the jobs and wages of nurses and aides, we use Medicaid data on specific waiver services and Census data on labor outcomes.
- Consistent with the fact that waivers don’t aim to affect formal caregivers’ labor outcomes, only a small fraction of the policies that we tested had any effect.
- That said, most of these effects were negative: fewer jobs and lower wages by allowing recipients to pick providers and pay family members to deliver care.
Introduction
Long-term care (LTC) is a pressing challenge facing an aging society. Today, institutional care has become prohibitively expensive, and, regardless of the cost, no one has ever wanted to go to a nursing home. In response, care delivery has shifted to home-and-community-based services (HCBS). Medicaid, which covers almost half of all spending on formal long-term care, plays a major role in determining how and where care is provided. Facing a growing demand for non-institutional care, states have increasingly sought federal waivers from Medicaid rules in order to allow more spending on HCBS for specific populations, such as the aged. The question is how these waivers have affected the three key stakeholder groups: formal caregivers (nurses and aides), informal caregivers (family members), and care recipients.
This brief, which is based on a new study, focuses on the effect of waiver policy on the labor force outcomes of formal caregivers.1 Using newly collected data on the services covered in Medicaid 1915(c) waiver applications and labor force data from the American Community Survey, we test the extent to which reimbursing for services covered by the waivers impacts the jobs and wages of nurses and aides. Upcoming briefs will summarize the effects of waivers on informal caregivers and care recipients.
The discussion proceeds as follows. The first section describes the role of Medicaid waivers in the growth of HCBS. The second section describes the data and methodology for estimating the extent to which Medicaid waiver policy affects the employment and earnings of nurses and aides. The third section presents the results, which show that only a small fraction of the possible causal effects that we examined revealed a significant relationship. This result is not surprising given that Medicaid policies were never aimed at affecting formal caregivers’ employment or pay, and Medicaid generally reimburses at below-market prices, leading to less scope for changes in employment or wages.
That said, from the limited instances where significant relationships do appear, some patterns emerge. In particular, most effects from the waivers were negative – primarily reducing earnings for aides or increasing unemployment for nurses by allowing care recipients to choose their providers (“self-direction”) and pay family members to provide care. Only a few effects from the waiver policies were positive – generating relatively small increases in nurses’ wages and hours.
On balance, these findings suggest further research into the mechanisms by which self-direction and family-care policies – which generally expand demand for care – might unintentionally affect labor force outcomes.
The Changing Nature of Long-term Care
Federal law requires every state Medicaid program to cover some home health services, and 33 states also elect to cover personal care services.2 All these services must be made available to everyone who meets the state’s general Medicaid eligibility rules, including need-based criteria. But as an aging population demands more home care, states have increasingly sought waivers from the Centers for Medicare & Medicaid Services (CMS) to expand Medicaid coverage of HCBS. While waivers were partly intended as experiments to identify best practices, they have taken on greater importance in recent decades as waiver coverage and spending have expanded.3
Each waiver request lists services for which the state seeks to waive existing rules. Waivers are temporary – generally lasting three to five years – and must be renewed. And, because each waiver request should introduce no additional costs to the Medicaid program, states generally request both expansions and restrictions to the basic Medicaid rules. For example, states can relax some of the rules around financial eligibility – allowing a broader swath of the population to be eligible for services listed under the waiver. At the same time, states can restrict availability of waiver services by limiting the number of individuals who can access waiver services and/or targeting the waiver services to specific populations (such as those ages 65+).
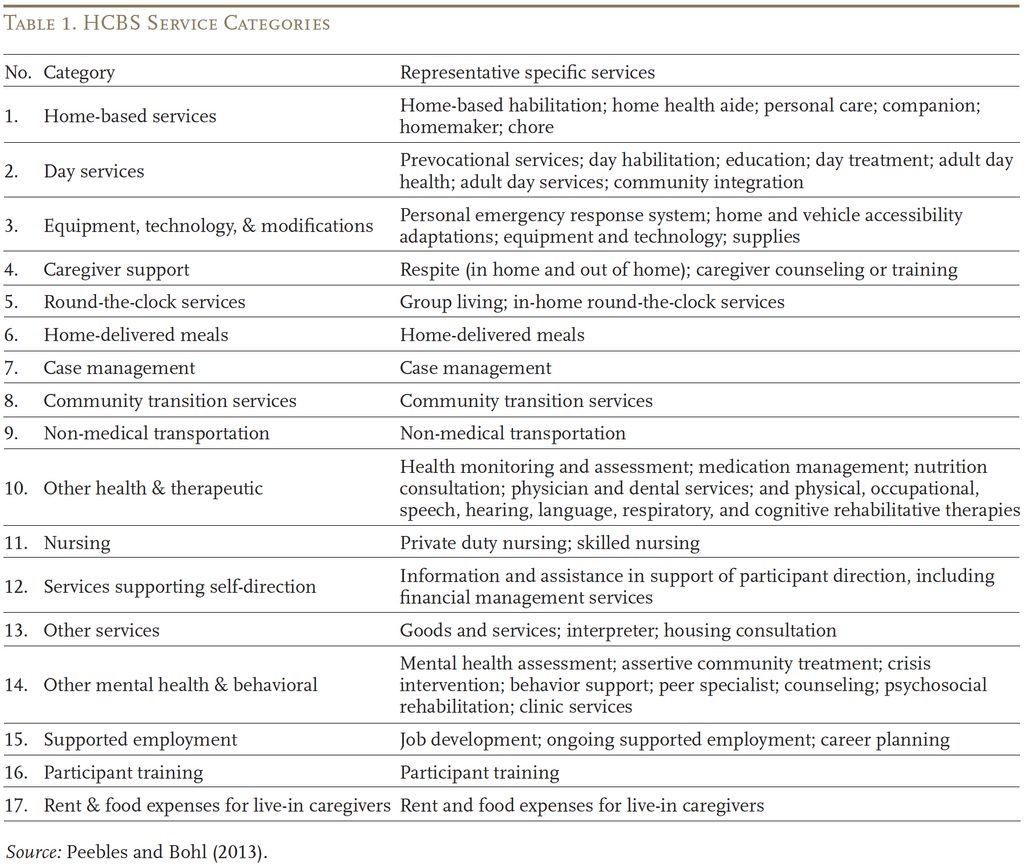
CMS has identified more than 60 HCBS that have been included in waivers and has organized these services into 17 broad categories (see Table 1). These categories range from the commonly provided, such as “home-based services” and “day services” to the rarely offered “rent and food expenses for live-in caregivers.”
In addition to whether a state Medicaid program will cover a specific service, the impact on nurses and aides can also depend on how the care is delivered. The state can allow care recipients to use self-direction, which provides the flexibility to choose their provider for a particular service. In addition, some states extend such self-direction to allow beneficiaries to elect family members as providers for specific services, allowing them to be reimbursed by Medicaid. For example, in 2025, at least 23 states covered non-medical transportation through a waiver; of these states, six allowed self-direction in this service area, and only four of those allowed family members to be reimbursed for offering this service.
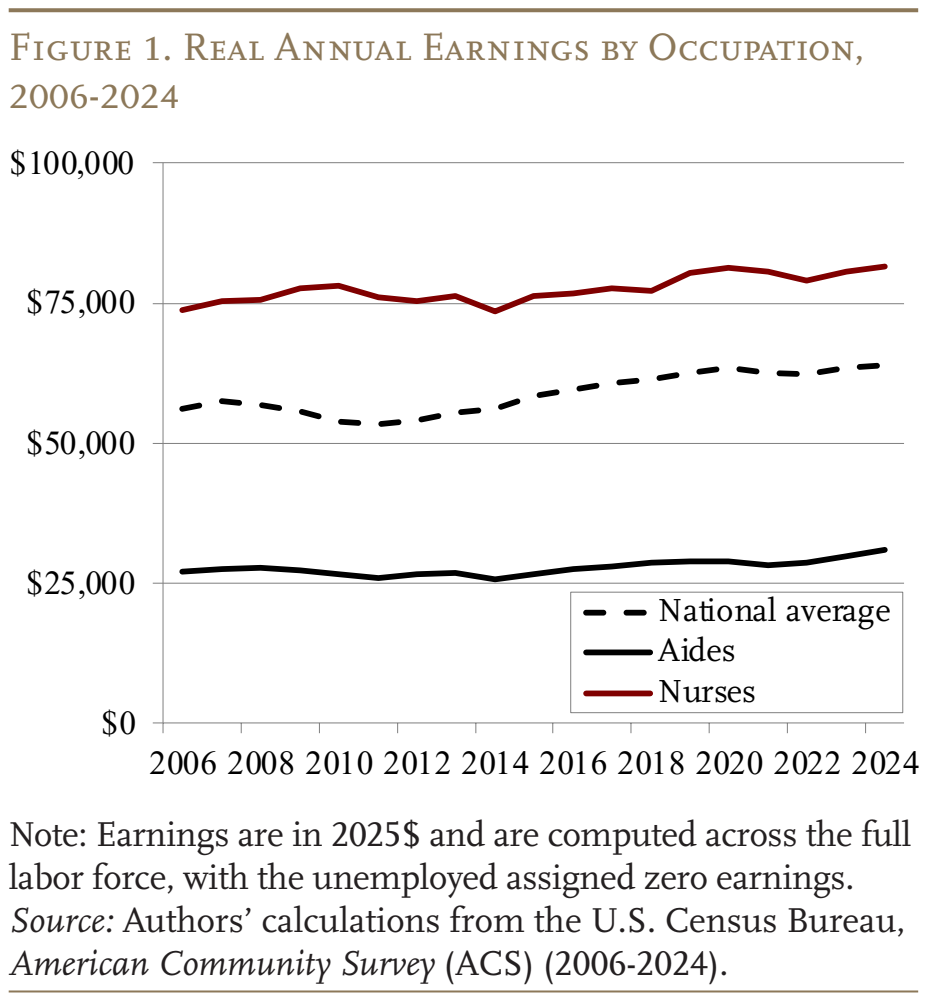
Against this policy backdrop sits a workforce under strain. Medicaid spending on home health and on other health, residential, and personal care more than tripled between 2006 and 2024.4 At the same time, ACS data show that the proportion of aides and nurses only grew from 4 to 5 percent of the national labor force over that period.5 One reason for this divergence is that the relative pay of home-care workers does not seem to have risen much with the increased demand. Real earnings for aides have grown roughly in line with the national average, leaving their pay at just under half the average for all workers (see Figure 1). The wages for nurses have also reflected changes in the national average, although their wages are well above that benchmark.
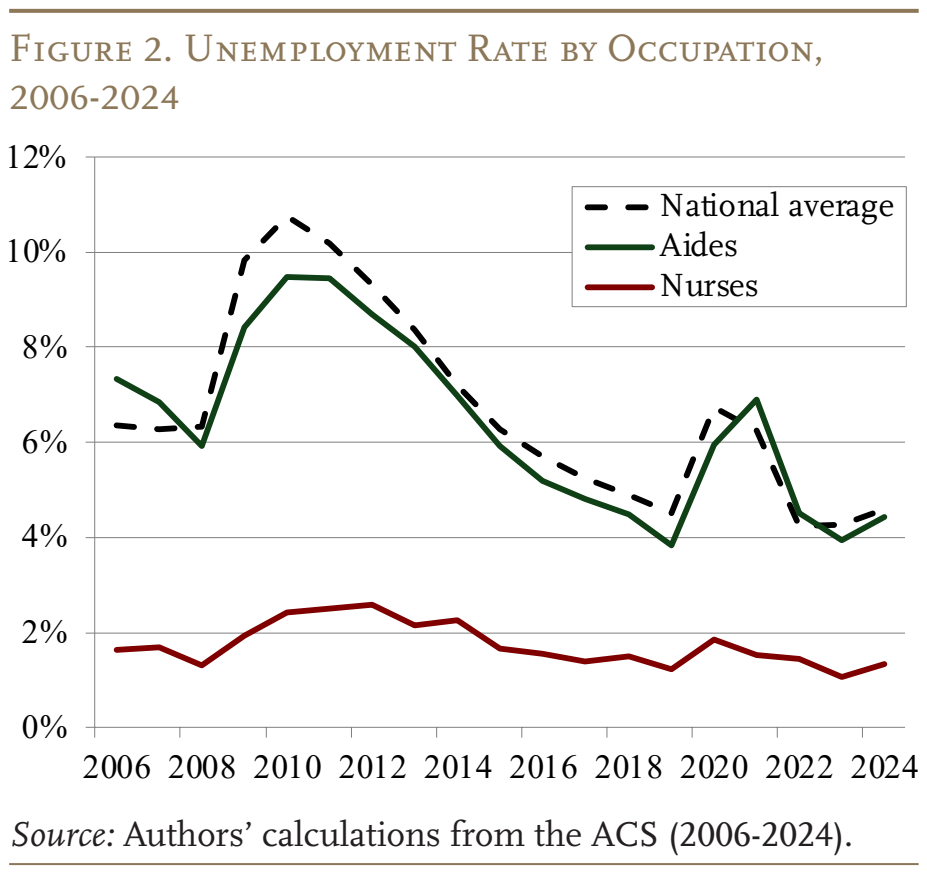
Similarly, the unemployment rate of aides has remained virtually the same as the national average, despite a seeming increase in the demand for their services (see Figure 2). Nurses, on the other hand, have little room for improvement as they have consistently experienced near full employment. The question is the extent to which Medicaid HCBS waiver policies have played any role in the labor force outcomes for these formal caregivers.
Methodology and Data
To answer the research question, the analysis links newly collected longitudinal data on states’ Medicaid HCBS waivers to wage, unemployment, and hours data from the U.S. Census Bureau’s American Community Survey to estimate how changes in HCBS coverage impact labor market outcomes for nurses and aides.
Methodology
The methodology takes advantage of the fact that different states, through waivers, have expanded or contracted their coverage of HCBS at different times. Specifically, the empirical exercise asks: for states in which the service was introduced in year t, how did the labor market outcome of interest change before and after the change, relative to those states in which policies remained unchanged during the same period. Put simply, if the equations show that labor force outcomes in the two groups of states are statistically similar before the policy change and different afterward, this indicates that the policy change impacted labor force outcomes.
In practice, this process involves estimating a separate equation for each of the four years before the change and one year after the change.6 Taken together, the results of the year-by-year equations produce a “path” over time that compares the labor force outcomes in the states with the policy change to those without. The next section describes the data used in this exercise.
Medicaid HCBS Policy Database
To date, studies on the workforce consequences of changing HCBS policies have related outcomes to aggregates – total HCBS expenditures, the HCBS share of long-term care spending, or the share of direct care workers employed in home settings. Those measures cannot distinguish between a state that adds round-the-clock services and a state that adds home-delivered meals, even though the two might have opposite implications for the demand for paid hands-on assistance. This study fills the gap by extracting detailed service data from 750 applications for 1915(c) waiver programs targeted to the aged and disabled, which span 45 states (plus DC) going back to 2006.7 The policy content is extracted from each waiver application using a trained AI-assisted process. (This new database is publicly available on the CRR website.8)
From each waiver application, the first step is to relate each service covered to one of the 17 broad HCBS categories in Table 1.9 Then, we make a determination of whether each service could be self-directed by the participant and whether a relative could provide the service under participant self-direction.
The second step is to convert application-level data into year-by-year data for each state. This effort requires assigning each waiver application a start and end date, constructed from a combination of its approved effective date, submission date, and scheduled duration. The state is counted as covering a category if any of its waiver applications cover a service in that category during the given year. In addition, the flexibility of beneficiaries to choose their formal provider or family members to provide the service is also established on a year-by-year basis by state.
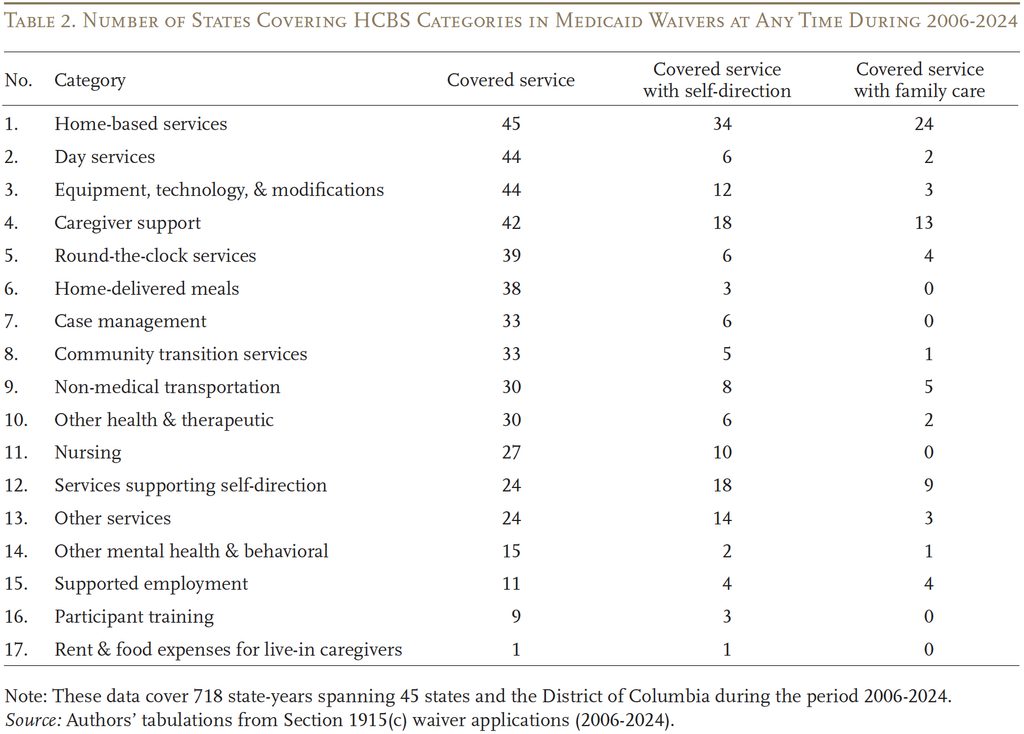
While the year-by-year data for each state are central to the empirical analysis, the easiest way to see the importance of various categories is to look at the number of states that included a service in one of the 17 categories at any time during the period 2006-2024 (see Table 2). More than 40 states provided coverage for four service categories – home-based services (45 states), day services (44 states), equipment, technology, and modifications (44 states), and caregiver support (42 states). In sharp contrast, only 9 states ever offered services for participant training, and only 1 state covered rent and food expenses for live-in caregivers. Allowing self-direction of covered services is less common than coverage: home-based services were self-directed in 34 states; caregiver support and services supporting self-direction were offered in only 18 states; and most other categories involved fewer than 10 states. Finally, self-directed family care is even less common and concentrated in the same few categories as self-direction.
Labor Market Data
Labor force outcomes for nurses and personal care aides come from the ACS for the years 2006 through 2024. Nurses include registered nurses, nurse practitioners and anesthetists, and licensed practical and vocational nurses. Aides include home health aides, personal care aides, nursing assistants, and orderlies, together with the closely related medical assistant and phlebotomist occupations.10 The analysis focused on three labor force outcomes – the share of labor force participants who are unemployed, the usual hours worked, and labor income (in real 2025 dollars).
Results
As structured, the analysis requires examining 306 “paths” to determine the relationship between six labor force outcomes (unemployment, hours, and labor earnings for both nurses and aides) on the one hand, and 51 service-level policies (coverage, self-direction, and family care for 17 services) on the other. In fact, only 234 paths could be created because of limited policy variation. Of those 234 paths, only 12 revealed a causal relationship between a specific waiver service policy and the labor market outcomes – four for aides and eight for nurses.11
This finding should not be surprising. Changes in Medicaid waiver policies were never aimed at increasing employment or earnings in the healthcare sector, but rather to enable patients to choose the setting for their care. Furthermore, Medicaid already reimburses service providers at below market-clearing rates, which means that a shift in demand is unlikely to affect wages or employment.
That said, some patterns do emerge from the small number of instances where a statistically significant causal relationship was found. Specifically, the majority of waiver policy effects tended to negatively impact labor force outcomes by either reducing earnings for aides or increasing unemployment for nurses – and stemmed primarily from self-direction and family-care waiver policies. Only three effects were positive – producing relatively small increases in nurses’ wages and hours.
For aides, all of the policy effects negatively impacted labor market outcomes – with three reducing earnings and one increasing unemployment (see Table 3). Simply providing training to care recipients (“participants”) reduces aides’ earnings by $2,043, presumably because making participants more self-sufficient reduces their need for health aides. Similarly, aides’ wages dropped when waivers covered self-directed home-delivered meals or family-provided equipment, technology, and modifications; these policies make certain tasks done by aides, like meal-prep and helping someone up and down stairs, less necessary. The one policy that impacted aides’ employment was self-directed caregiver support – it increased their unemployment rate by 2 percentage points.
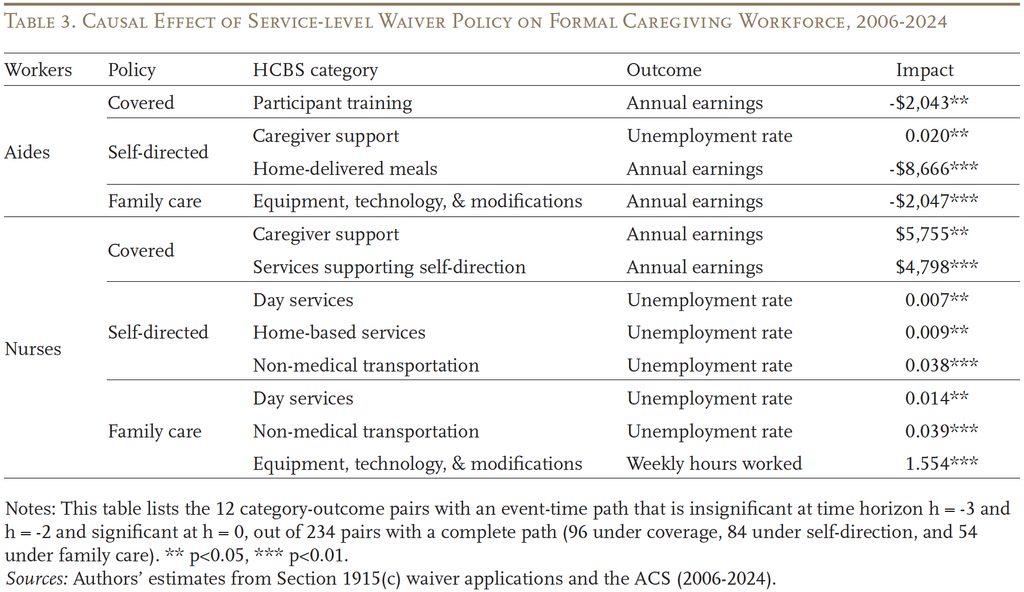
For nurses, the impact of waiver policies was somewhat more mixed – five policies increased unemployment, while two increased earnings and one increased hours. Interestingly, none of the positive effects involved direct care services commonly provided by nurses. This outcome likely reflects the fact that nurses often serve as either the case manager, needs evaluator, or service delegator for waiver participants. For example, home and vehicle modifications often require a documented professional evaluation of need. And, “services supporting self-direction” can often involve nurses doing the initial assessment, developing the service plan, training the participant to function as an employer, and making routine home visits.12 For these reasons, non-direct-care services could still result in the positive labor force outcomes for nurses.
Still, most of the services that had an effect negatively impacted nurses’ labor force outcomes – increasing their unemployment rate by between roughly 1 and 4 percentage points due to self-directed and/or family-provided policies. One reason for this pattern could be that these service policies allow some individuals, who would otherwise have gone to a nursing home, to remain at home, which reduces nursing staff requirements.
Overall, looking across the two occupations, the results suggest that nurses’ labor force outcomes are slightly more sensitive to waiver policies than those of aides; the labor force outcomes of aides respond to different waiver policies than those of nurses; and covering self-directed and family-provided services tends to negatively impact labor force outcomes for both. This final finding suggests further research into the mechanisms by which self-direction and family-care policies – which generally expand demand for care by making it less expensive to obtain from either a formal or informal caregiver – might negatively impact labor force outcomes for formal care workers.
Conclusion
This study addresses whether the service policies a state writes into its Medicaid waivers affect the labor market for formal caregivers: nurses and aides. To answer that question required creating a new dataset that specifies not only the share of total spending covered by waivers but also the specific services covered. Conceptually, the analysis also required examining 306 paths, as a result of combining across six labor force outcomes (unemployment, hours, and labor earnings for both nurses and aides) and 51 service-level policies (coverage, self-direction, and family care for 17 services). Because of a lack of policy activity, only 234 equations were estimated.
The results show that – of the 234 equations – only 12 displayed a causal relationship between waiver service policies and the labor market outcomes for nurses and aides. This finding should not be surprising. Changes in Medicaid policies were never aimed at increasing employment or earnings in the healthcare sector, but rather to enable patients to choose the setting for their care and preserve their dignity. In addition, Medicaid generally reimburses at below-market prices, leading to less scope for changes in employment or wages.
That said, from the limited number of instances where effects do appear, some patterns emerged. Most of the effects were negative – primarily reducing earnings for aides or increasing unemployment for nurses through self-direction and family-care policies. Only three effects were positive – generating relatively small increases in nurses’ wages and hours. These findings suggest further research into the mechanisms by which self-direction and family-care policies – which generally expand demand for Medicaid-covered care – might impact labor force outcomes for nurses and aides (who have very different levels of compensation and specialization) in different ways.
References
Aubry, Jean-Pierre, Gal Wettstein, and Nilufer Gok. 2026. “How Do Medicaid Policies for Home- and Community-Based Services Impact the Jobs and Wages of the Formal Care Workforce?” Working Paper 2026-3. Chestnut Hill, MA: Center for Retirement Research at Boston College.
Centers for Medicare & Medicaid Services. National Health Expenditure Accounts, 2024. Baltimore, MD.
Center for Retirement Research at Boston College. Medicaid HCBS Waiver Dataset, 2006-2025. Chestnut Hill, MA.
Kreider, Amanda R. and Rachel M. Werner. 2023. “The Home Care Workforce Has Not Kept Pace with Growth in Home and Community-Based Services.” Health Affairs 42(5): 650-657.
Mohamed, Maiss, Alice Burns, and Molly O’Malley Watts. 2026. “Medicaid Home Care (HCBS) in 2025.” San Francisco, CA: KFF.
Peebles, Victoria and Alex Bohl. 2013. “The HCBS Taxonomy: A New Language for Classifying Home- and Community-Based Services.” Medicare & Medicaid Research Review 4(3).
Skira, Meghan M., Zhuo Wang, and R. Tamara Konetzka. 2022. “Trends in Medicaid Home and Community-Based Services Waivers for Older Adults.” Health Affairs 41(8): 1176-1181.
U.S. Census Bureau. American Community Survey, 2006-2024. Washington, DC.
Endnotes
- Aubry, Wettstein, and Gok (2026). ↩︎
- Mohamed, Burns, and Watts (2026). ↩︎
- Skira, Wang, and Konetzka (2022). ↩︎
- Authors’ calculations from Centers for Medicare & Medicaid Services (2024), Tables 13, 14, and 15. ↩︎
- Unsurprisingly, the number of home care workers per 100 HCBS participants fell by 11.6 percent between 2013 and 2019 (Kreider and Werner 2023). ↩︎
- The coefficient of interest is the effect of a policy change. The equation also includes controls for several state-specific statistics that change over time, such as state revenue, the federal Medicaid reimbursement rate to the state, the state unemployment rate, and the average wage in the state. ↩︎
- Five states (Arizona, Hawaii, Rhode Island, Tennessee, and Vermont) provide HCBS for older and physically disabled people mainly through Section 1115 demonstrations rather than 1915(c) waivers. Four states (Delaware, New Jersey, New Mexico, and Texas) moved these services into Section 1115 waivers between 2012 and 2014, and are in the data only prior to the transition. ↩︎
- https://crr.bc.edu/HCBS ↩︎
- Fields for the broad HCBS categories were added to the 1915(c) waiver application partway through our analysis period, so only about half of the 10,895 service records in the raw data contain an explicit category code. We assign the rest in two steps: first by taking, for each service title, the modal category among the records that do carry a code, and then by hand-coding the remaining service titles that no coded record matches. As a result, every service listed in each waiver is classified into one of the 17 broad HCBS service categories. ↩︎
- Individuals are assigned their occupation at the time of the interview, which would include their last occupation if they are not working at that time. ↩︎
- In addition, to meet our own standard of what constitutes a valid causal estimate for this analysis, we require that the treatment and control states have similar patterns in terms of the formal care labor market outcomes before the policy change was made in the treatment state. ↩︎
- In particular, self-directed attendant models rely on a nurse’s delegation of certain health maintenance tasks to other unlicensed attendants, with the nurse assessing, training, and periodically re-evaluating. ↩︎



Aubry, Jean-Pierre, Gal Wettstein, and Nilufer Gok. 2026. "How Do Medicaid LTC Policies Impact Jobs and Wages of Nurses and Aides?" Issue in Brief 26-21. Chestnut Hill, MA: Center for Retirement Research at Boston College.