
How Does Inflation Impact Near Retirees and Retirees?

The brief’s key findings are:
- High inflation generally harms older households, but the impact varies by retirement status and wealth.
- Retirees are hurt more than near retirees because, outside of Social Security, their income is less indexed to prices and they hold less fixed-rate debt.
- Higher-wealth households – both retirees and near retirees – are more protected because they invest in assets that grow with inflation.
- Next, the authors will use new survey data to assess how older households’ responses to inflation influence these outcomes.
Introduction
In June 2022, U.S. inflation peaked at 8.9 percent – a dramatically high level after nearly three decades of relatively stable prices. Because inflation has been so low for so long, the risks of inflation have been generally overlooked and recent history does not offer much practical insight on its impact. But a shock of the magnitude just experienced must surely have affected the retirement security of near retirees and those already retired.
This brief, which is the first of two based on a new study, illustrates the financial consequences of high inflation by using economic theory and hypothetical households to trace possible paths of consumption and wealth under different macroeconomic scenarios.1The full-length study is Aubry and Quinby (2024). The findings in this first brief assume no behavioral response by the households. The second brief will present results from a new survey that explores the extent to which older workers and retirees changed their labor supply, saving, and investment allocation in response to inflation and will incorporate those responses into the scenario analysis.
For this brief, the discussion proceeds as follows. The first section summarizes what we know to date about the impact of an inflation shock on household finances. The second section describes the macroeconomic scenarios. The third section presents the results, which show that the magnitude of the impact depends on two offsetting factors: 1) the extent to which income and investments keep pace with rising prices; and 2) the amount of fixed-rate debt held by the household.
The final section concludes that while inflation harms most older households, the risks vary across the age and wealth distribution. Specifically, inflation harms retirees more than near retirees because – outside of Social Security – retiree income is less indexed to prices, and retirees hold less fixed-rate debt. Similarly, top-wealth households see a smaller reduction in financial assets than their lower-wealth counterparts because they are more heavily invested in equities and businesses that grow with inflation. On the other hand, top-wealth retirees ultimately end up with a bigger drop in consumption than their lower-wealth counterparts living off Social Security.
What We Know about Inflation and Household Finances
Studies of inflation’s impact on retirement security generally fall into two camps: pre- and post-COVID-19. Prior to the pandemic, the United States and many Western European countries had not seen a major rise in price levels since the late 1970s and early 1980s. Thus, researchers interested in this question used statistical analysis to relate small changes in inflation and interest rates during the 1990s and 2000s to the real value of household income, assets, and debt.2Adam and Tzamourani (2016); Albanesi (2007); Au-clert (2019); Bach and Stephenson (1974); Crawford and Oldfield (2002); Doepke and Schneider (2006a, 2006b, and 2006c); Erosa and Ventura (2002); Gurer and Weichenrieder (2020); Hottman and Monarch (2020); Hobijn and Lagakos (2005); Jaravel (2021); Kaplan and Schulhofer-Wohl (2017); Lee, Macaluso, and Schwartzman (2021); McGranahan and Paulson (2005); and Yang (2022). A few post-pandemic papers also take this approach; for example, see Bartscher et al. (2022); Del Canto et al. (2023); Lauper and Mangi-ante (2021); McKay and Wolf (2023); Orchard (2022); and Wolff (2023). Given that the inflation fluctuations during this period were very small, it is difficult to extrapolate these results to 2022. Nevertheless, the pre-pandemic literature confirmed a key insight: that inflation impacts households differently based on the specific sources of their income, the allocation of their assets, and their exposure to fixed-rate mortgage debt.
On the income side, households approaching retirement face the risk that labor earnings do not keep pace with rising prices. Since wages and salaries are often negotiated on a set schedule (typically once per year), earnings tend to lag inflation. And unemployment poses a significant risk if the Federal Reserve’s response to inflation triggers a recession. Similarly, many retirees still rely on defined benefit (DB) pensions, which often do not keep pace with inflation (although these plans are increasingly rare for private sector workers).3While most private sector pensions do not provide any inflation adjustments to benefit payments, a majority of state and local government pensions provide adjustments that account for a portion of the rise in prices. On a more positive note, most retirees also receive fully inflation-indexed income from Social Security.
Regarding wealth, the direct impact of inflation depends on the household’s portfolio and the nature of the shock. For example, financial models predict that bonds and other fixed-income holdings suffer from sudden price increases. Equities fare better, so long as the Federal Reserve avoids a recession.4Specifically, the concern here is whether the Federal Reserve takes overly aggressive action that triggers a recession. Cieslak and Pflueger (2023) provide a nice overview of these models. And while house prices rise with inflation, this growth may be offset by shrinking demand if rising interest rates make it harder for prospective buyers to take out a mortgage.5Glaeser, Gottlieb, and Gyourko (2010). On the other hand, households that already hold fixed-rate mortgage debt benefit from inflation because the monthly mortgage payment stays constant even as household income rises with prices.
Although the existing research is helpful for understanding inflation’s impact on retirement, many questions remain. For instance: how vulnerable were older households to the recent inflation shock, given their income, investment allocation, and debt holdings? Were certain households more vulnerable than others?
How Vulnerable Are Older Households to an Inflation Shock? A Scenario Analysis
Because it is hard to assess the impact of today’s inflation shock from past experience and because inflation continues to be a concern, we turn to scenario analysis. This approach uses economic theory to model the finances of six hypothetical households – of different ages and wealth levels – under a range of possible macroeconomic conditions.
Before diving into the analysis, the following discussion defines the metrics used to assess inflation’s impact on retirement security, introduces the hypothetical households featured in our illustration, and lays out the macroeconomic scenarios.
How Do We Measure Inflation’s Impact on Retirement Security?
Intuitively, the amount of non-housing goods and services that households can consume each year depends on their income, prevailing price levels, and the extent to which they have recurring fixed expenses such as a home mortgage. For working households, this intuition can be expressed with a simple equation:
P * C = I – M – S
Where P denotes the price of goods and services (we assume a single price for illustrative purposes, such as the CPI-U); C reflects the amount of non-housing goods and services consumed; I represents after-tax income; M is the fixed mortgage payment; and S reflects any saving that households are doing to build a stock of wealth.6Note that saving can be negative if households draw down their existing assets or take on additional debt. Households also pay income and consumption taxes that reduce the amount of disposable income. While income tax brackets are indexed for inflation, households might shift brackets as a result of inflation (both because mortgage payments are tax deductible and because household income might not fully keep pace with inflation). We do not model this shift because it is complex and – for most households – has a relatively small impact on average tax rates.
The math is very similar for retired households, who receive income (I) from external sources – such as Social Security or an employer pension – and also fund consumption by drawing down their stock of wealth:
P * C = I + dW – M
Where (d) represents the drawdown rate of wealth (W). From one year to the next, inflation impacts the quantity consumed (C) directly through the price level (P) and indirectly through the growth of income and wealth.
Hence, our scenario analysis focuses on two metrics. First, we look at the real change in current consumption (C) from the beginning of our analysis period to the end.7Conceptually, the real change in consumption accounts for the rise in the price level over time. Second, we also consider potential future consumption by evaluating the stock of household wealth at the end of the period. Since the ultimate goal of this exercise is to understand the impact of recent inflation, we model consumption and wealth from 2021 to 2025, with all values expressed in 2021 dollars.
A Financial Profile of Older Households
The analysis considers two groups of hypothetical households whose starting levels of income and wealth are designed to reflect actual households in the 2019 Survey of Consumer Finances (SCF):8We use the 2019 SCF because the most recent 2022 data reflect households’ experience in 2021, which was still an unusual pandemic year with significant (and transitory) federal stimulus transfers.
- Near retirees: for households in this group, the survey-designated “household head” is age 55 to 61 in 2021 and employed full-time. Sixty-two percent of these households are married, and we stipulate that the spouse is not yet receiving Social Security or pension income. In practice, most of the spouses are employed.9Specifically, 70 percent of spouses are also employed.
- Retirees: households in this group have a head age 62 or over. Both the head and spouse self-identify as retired (46 percent of these households are married); and the household receives Social Security income.
Table 1 shows the components underlying consumption for households near and in retirement, by wealth tercile.10The terciles are based on total wealth excluding Social Security and defined benefit pensions but including housing. Most of the near retirees have few sources of income beyond labor earnings. Those in the top wealth tercile also have investment income and income from “other” sources such as businesses. Additionally, a modest number of working households already receive an employer pension. Importantly, the average household must spend a portion of its income on debt obligations, particularly mortgage payments.11The average mortgage payment amount in Table 1 includes households who no longer have a mortgage (i.e., their mortgage payments are zero).
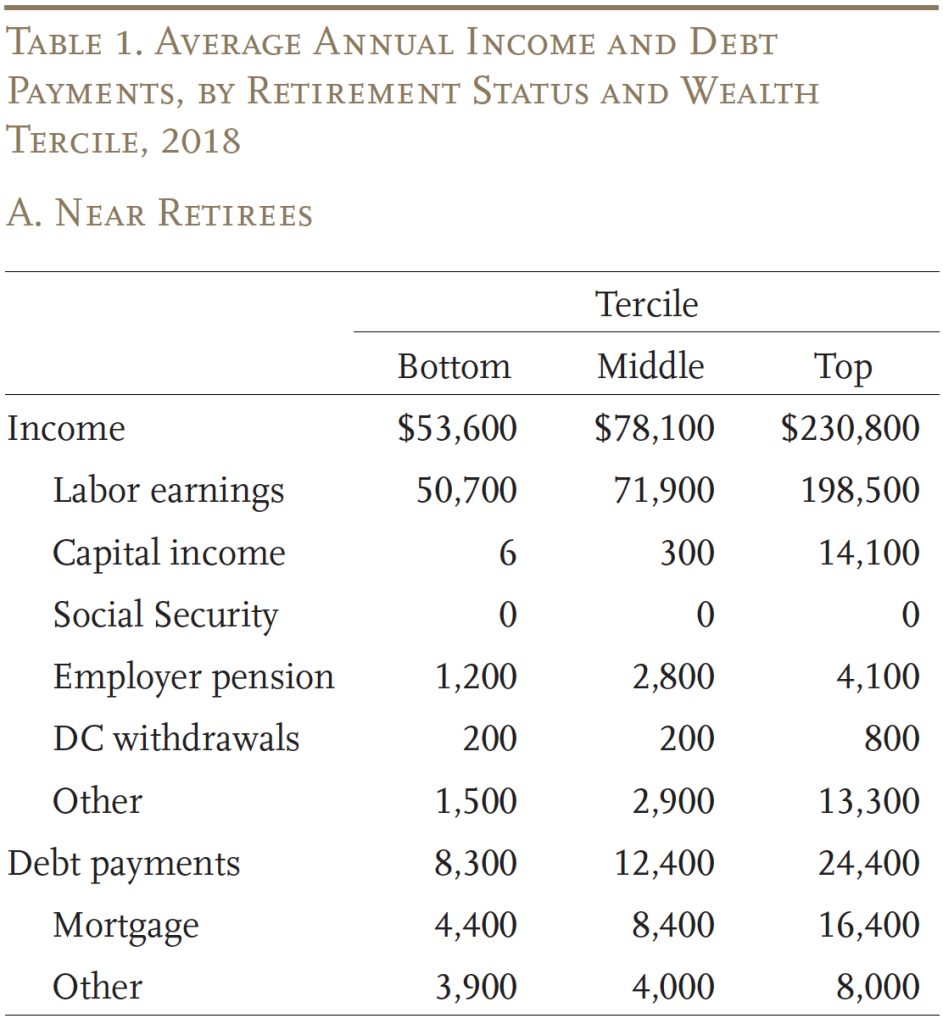
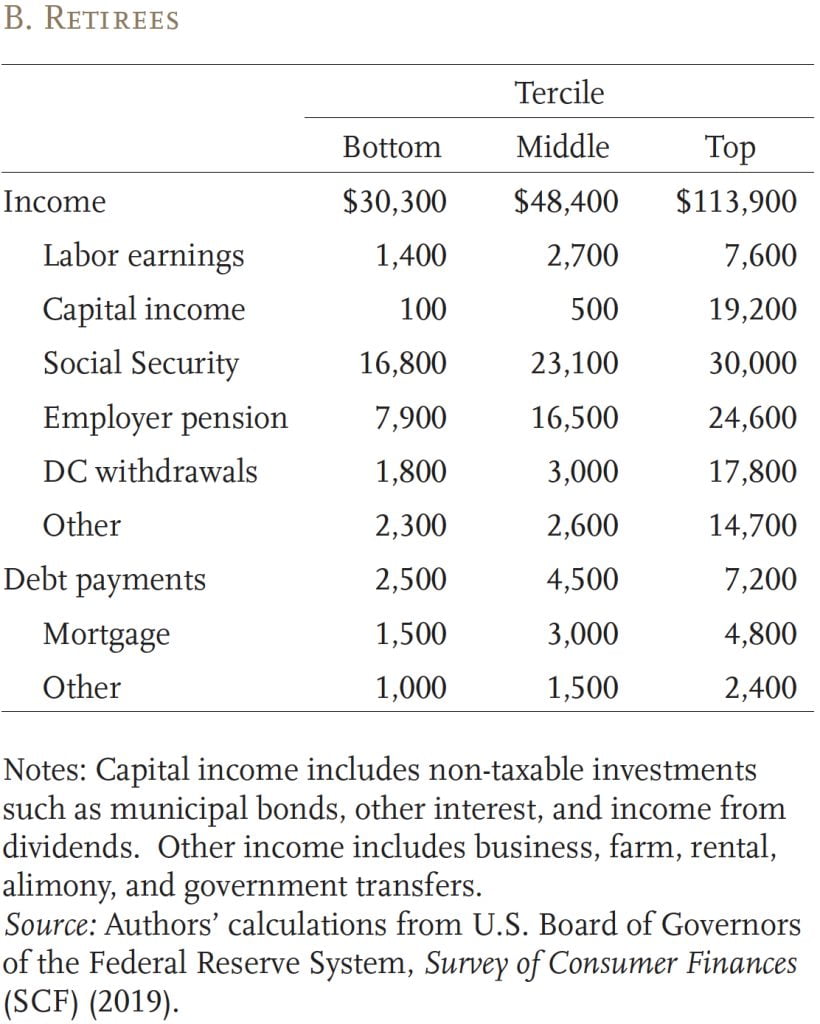
Retirees, meanwhile, receive most of their income from Social Security and DB pensions. Those in the top wealth tercile also make significant withdrawals from their defined contribution (DC) plans (which include IRAs) and have notable income from capital and “other” sources. Retirees are much less likely to be making mortgage payments than near retirees.
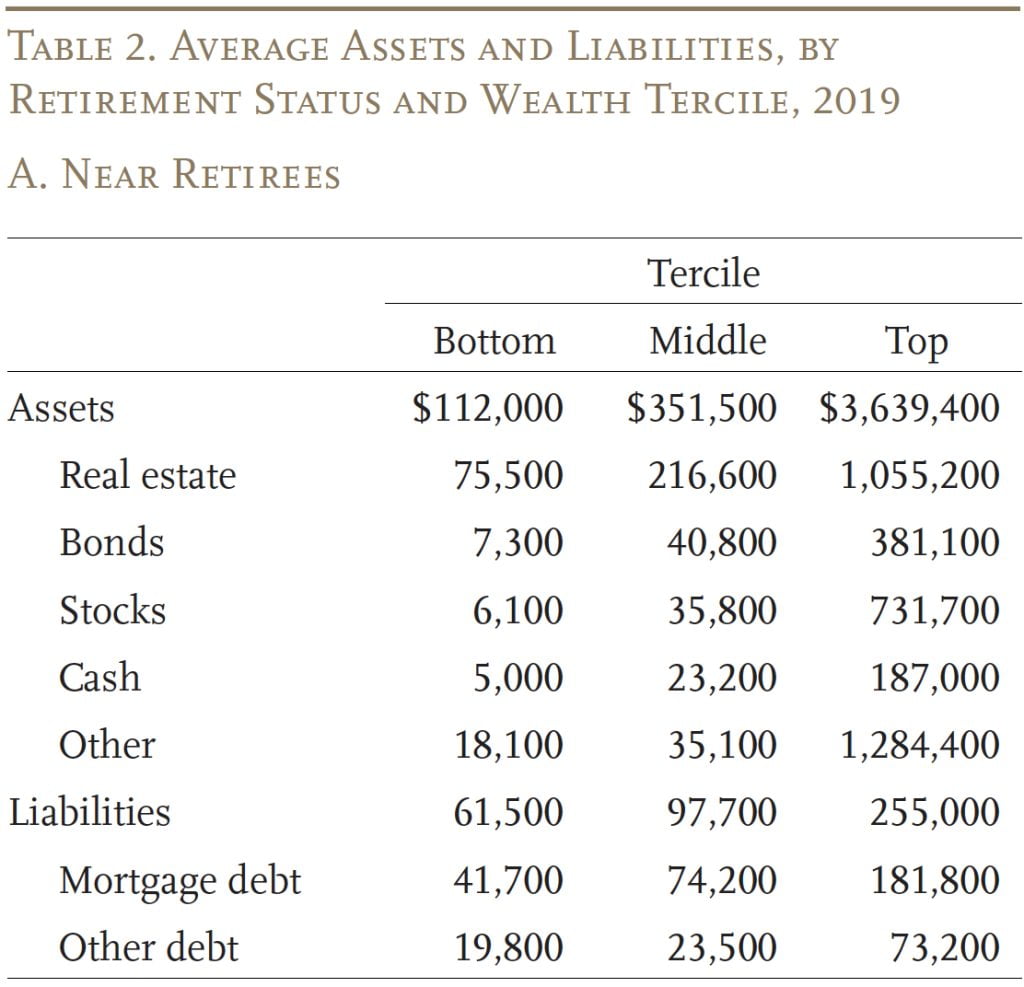
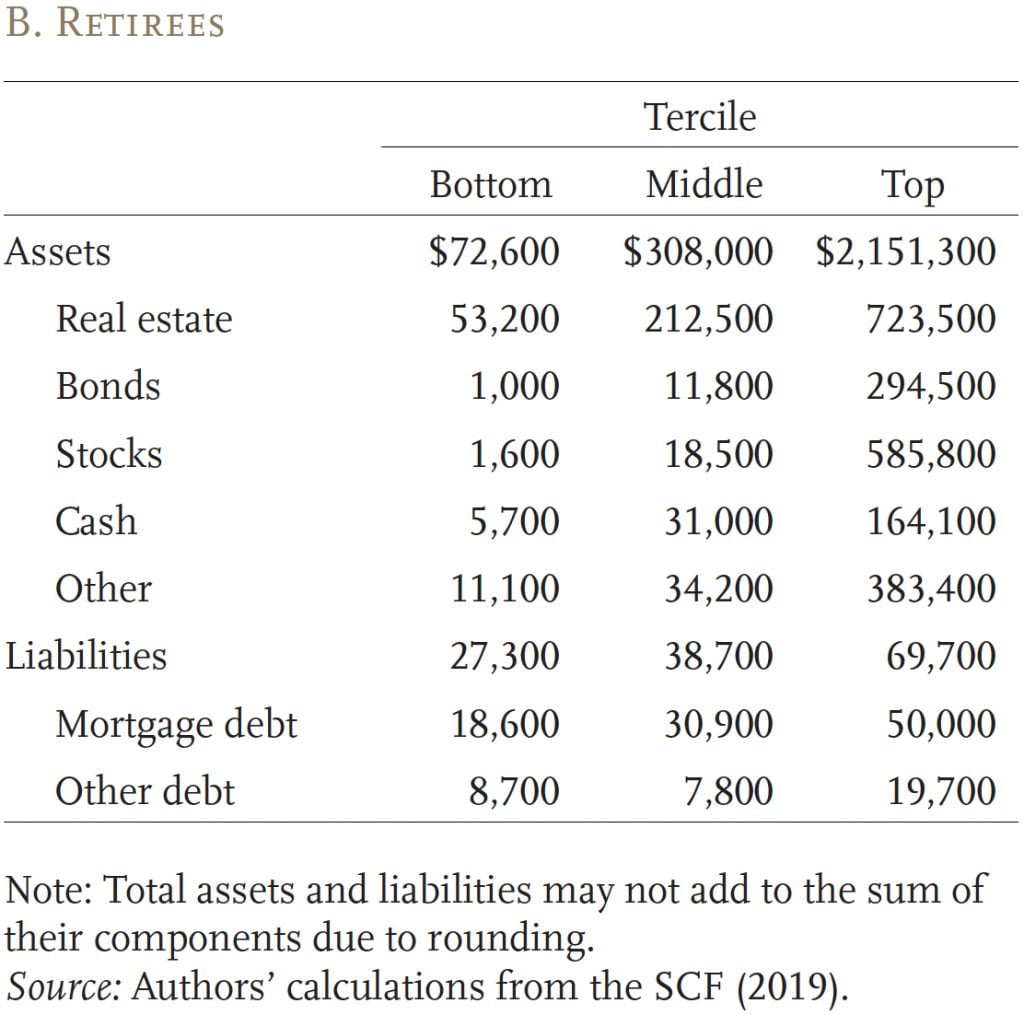
Similarly, Table 2 shows the components of wealth by retirement status and wealth tercile. Housing is the primary asset for all households. However, those in the top tercile also have significant non-housing wealth in the form of stock and bond holdings (primarily through DC plans), cash (which includes certificates of deposit), and “other” assets (including businesses, annuities, vehicles, and life insurance). On the liabilities side of the balance sheet, most households have mortgage debt, although – as noted earlier – this debt is less important for wealthier households and retirees.
Four Macroeconomic Scenarios
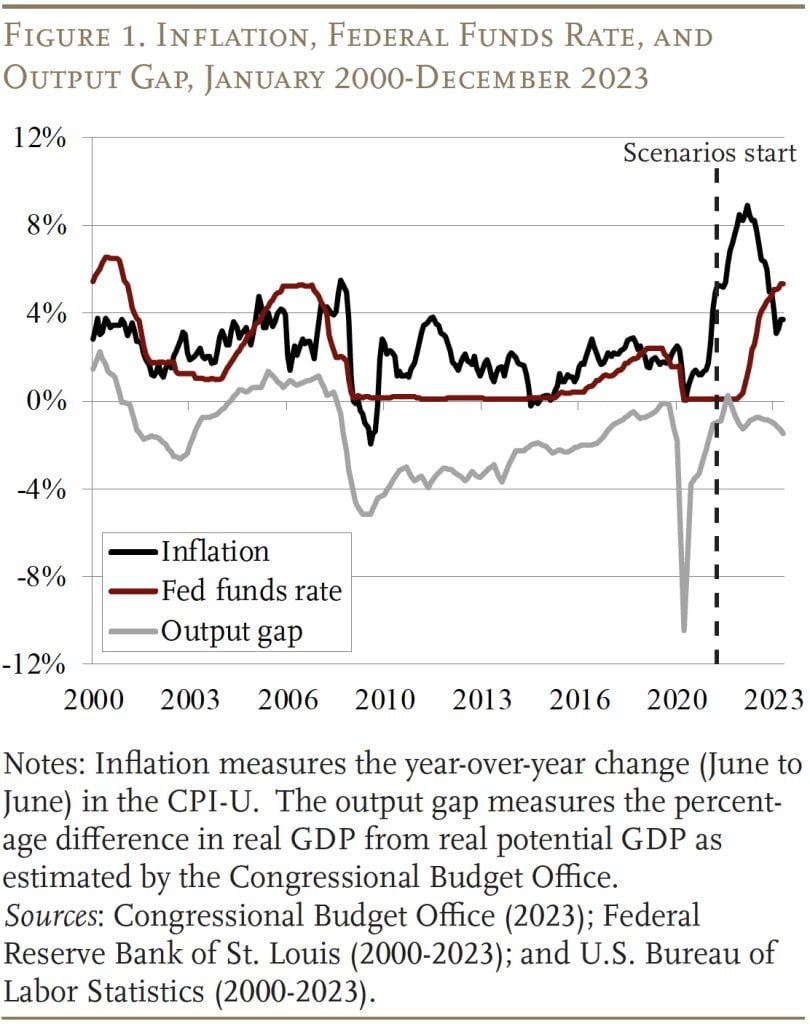
The next step is to determine how inflation impacts the various components of income and wealth. Our analysis runs from January 2021 through December 2025. Inflation and interest rates were still low at the beginning of 2021, reflecting a long period of loose monetary policy (see Figure 1). Although the economy had largely recovered from the brief, but severe, pandemic recession, the output gap (actual versus potential GDP) was still negative.
Inflation can have different effects depending on the Fed’s policy response. For this reason, we consider four hypothetical scenarios:
No inflation. In this baseline scenario, the economy gradually emerges from the long period of below-potential growth and achieves zero output gap by December 2025. To maintain target inflation of 2 percent with no output gap, the Fed incrementally raises interest rates to 4 percent (2 percent above inflation) by December 2025.12The Taylor Rule is an equation specifying the optimal level of the Federal Funds Rate (r) given a level of inflation (p) and output gap (y). Bernanke (2015) demonstrates that the specification: r = p + y + 0.5(p-2) + 2 best fits the Fed’s decision-making in practice. In the financial markets, expected long-term inflation hovers at 2 percent, while the real long-term interest rate rises from roughly zero experienced during the long period of low growth to a more normal 1 percent.
Permanent shock. In this (rather unrealistic) scenario, the “no inflation” scenario is modified so that inflation suddenly spikes at 4 percent in May 2021 – as was actually the case – and remains at that level thereafter. Importantly, under this scenario, the Fed accepts the higher rate of inflation as its new target, and steadily raises the Federal Funds Rate to 6 percent to maintain 4-percent inflation and close the output gap by December 2025.13In the financial markets, expected long-term inflation rises to 4 percent, while the real long-term interest rate rises from roughly zero to 1 percent.
Soft landing. This third scenario considers a more realistic trajectory for the economy. Inflation takes off in May 2021 and the Fed effectively uses monetary policy to reach its target of 2 percent with no output gap by December 2025 – without triggering a recession. Specifically, this scenario mimics actual macroeconomic conditions from 2021 to 2023 – inflation climbing to 9 percent, a jump in the Federal Funds Rate to over 5 percent, and a subsequent decline in inflation to just over 3 percent – and then projects a smooth path forward to 2-percent inflation, a closing of the output gap, and a 4-percent Federal Funds Rate by December 2025.14In the financial markets, expected long-term inflation hovers around 2 percent throughout the analysis period, while the real long-term interest rate rises from roughly zero to 1 percent.
Recession. The last scenario envisions a recession following aggressive Fed policy to tamp down inflation. As in the “soft landing,” this scenario mimics actual macroeconomic conditions from 2021 to 2023. But, rather than a smooth return to normal by 2025, inflation begins to rise again in 2024. The Fed responds by aggressively raising interest rates with the Federal Funds Rate peaking at 8 percent in January 2025. Ultimately, such a high rate triggers a recession (about half as severe as the Great Recession) and an immediate downward trend in inflation. Realizing the costly effects of overly aggressive policy, the Fed quickly brings rates back down; however, the economy does not fully recover by the end of the analysis period.15In the financial markets, expected long-term inflation rises to 3 percent as the Fed struggles to tamp down inflation, but returns to 2 percent after the recession. At the same time, the real long-term interest rate rises from roughly zero to 1 percent by December 2025.
Conceptually, the first scenario represents a benchmark against which to measure the overall impact of inflation. The next two scenarios show how inflation impacts retirement security without the confounding influence of a recession; and the last scenario shows the combined effects of inflation plus a recession.
Projecting Income and Wealth Under Different Scenarios
To illustrate the impact of inflation on consumption and wealth, we must make assumptions about how different types of income and assets evolve in our macroeconomic scenarios between 2021 and 2025.
- Wages: Matching the typical experience of workers over age 50, the first three scenarios assume that wages lag inflation by one year with no productivity growth.16In our initial scenario analysis, we assume that workers do not work more or less due to inflation, so the growth in annual earnings is determined solely by employer wage-setting behavior. In the last scenario (“recession”), wages lag inflation until the recession occurs, after which they freeze.
- Social Security: Social Security benefits are fully indexed for inflation.
- DB pensions: The analysis assumes that private DB plans do not provide cost-of-living (COLA) adjustments, whereas government plans grant a COLA equal to the CPI up to a cap of 3 percent.17Munnell, Aubry, and Cafarelli (2014). In the SCF, just over half of households with pension income report receiving COLA adjustments, and the share with a COLA is increasing over time. These trends are consistent with private DB plans becoming less available. Consequently, we assume that 60 percent of pension income receives an adjustment, with the COLA capped at 3 percent.
- Capital and other income: Capital income is projected to grow with GDP. Other income includes business, farm, and rental income – which are presumed to grow with GDP – and alimony and government transfers – which remain at current levels.
- Saving rate for working households: Based on data in the 2019 SCF, the analysis assumes that 34, 64, and 73 percent of working households in the bottom, middle, and top terciles, respectively, participate in a DC plan. Similarly, wealthier households contribute a larger percentage of their annual labor earnings to their DC plan.
- Drawdown rate for retired households: A growing literature suggests that households use rules of thumb – such as the 4-percent rule or the Required Minimum Distribution (RMD) schedule – to withdraw a set percentage of their retirement accounts each year.18Munnell, Wettstein, and Hou (2020) and citations therein. For our baseline analysis, we assume that retirees take RMDs (which are designed to slowly deplete balances in DC plans over an average lifespan) according to the schedule for 2022 tax returns.19See Internal Revenue Service (2022). This assumption is consistent with a growing body of empirical work suggesting that RMDs have become the default drawdown strategy for many retirees (see, for example, Brown, Poterba, and Richardson 2023).
- Wealth: Mechanically, the change in wealth from one year to the next depends on the growth rate of the various assets held by the household, the share of the portfolio allocated to each asset class, and the decline in debt outstanding.20For a detailed description of our methodology for each asset class, see Aubry and Quinby (2024).
Results of the Scenario Analysis
Ultimately, we are interested in two outcomes – the cumulative change in real consumption from 2021 to 2025 and wealth in 2025 – for two household types – near retirees and retirees – across four macroeconomic scenarios.21Recall that consumption equals monthly income less saving and debt payments. Wealth, meanwhile, equals financial and housing assets minus outstanding debt. We compare the growth in these outcomes to the rise in price levels to understand whether households maintain their standard of living. Put simply, if consumption and/or wealth grow more slowly than inflation, a household is worse off. Throughout, we are mindful that, in the real world, other events that also affected household finances coincided with inflation. To avoid comparing our illustration to real-world outcomes, we present all results relative to the baseline scenario of no inflation.
Table 3 shows the difference in the growth rate of real consumption across scenarios. Two points stand out. First, near retirees experience a smaller decline in consumption than retirees, even enjoying real consumption gains in the “soft landing” scenario. This outcome is due to the decline in the real value of mortgage payments relative to earnings.22Since we assume that wages lag inflation, they decline in real terms when inflation is rising, then grow in real terms when inflation abates. Retirees have less erosion of real debt, and often also lose real income because employer pension benefits are only partially indexed to inflation.
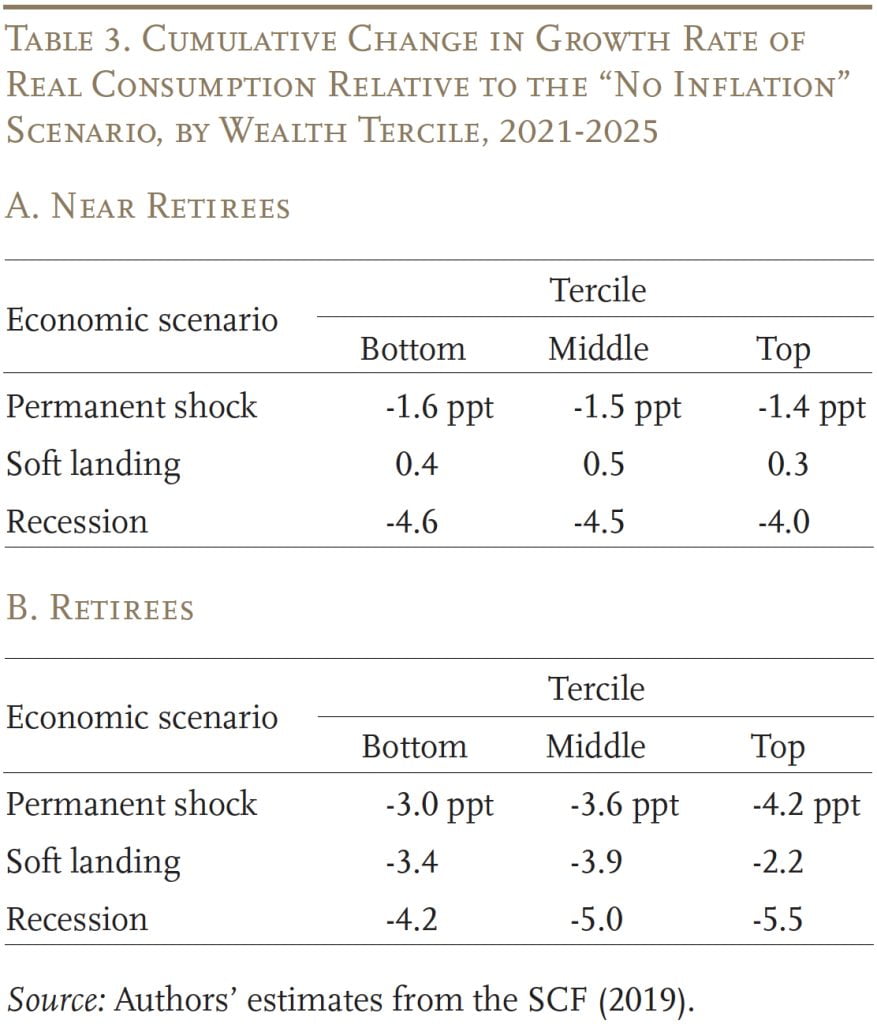
Second, the impact of inflation varies across the wealth distribution. Near retirees in the top wealth tercile generally fare better than same-age households with fewer resources because they derive more of their income from businesses that have real growth. Conversely, retirees in the bottom wealth tercile typically fare best because they are more reliant on Social Security, which in our model is indexed for inflation with no lag.
Turning now to financial (non-housing) wealth in 2025, we see that inflation has an unambiguous negative impact (see Table 4). Top-wealth households, however, always lose less than their lower-wealth counterparts, because they invest more in equities, businesses, and other assets that grow with inflation.
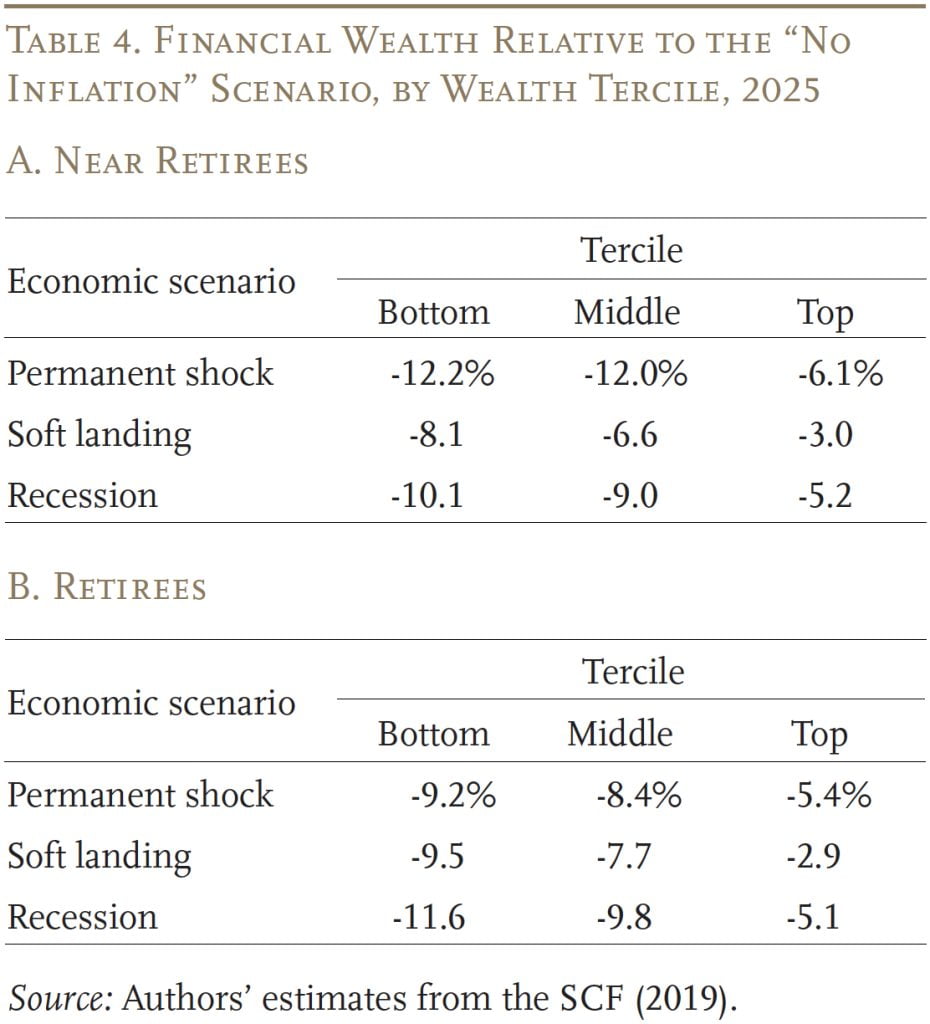
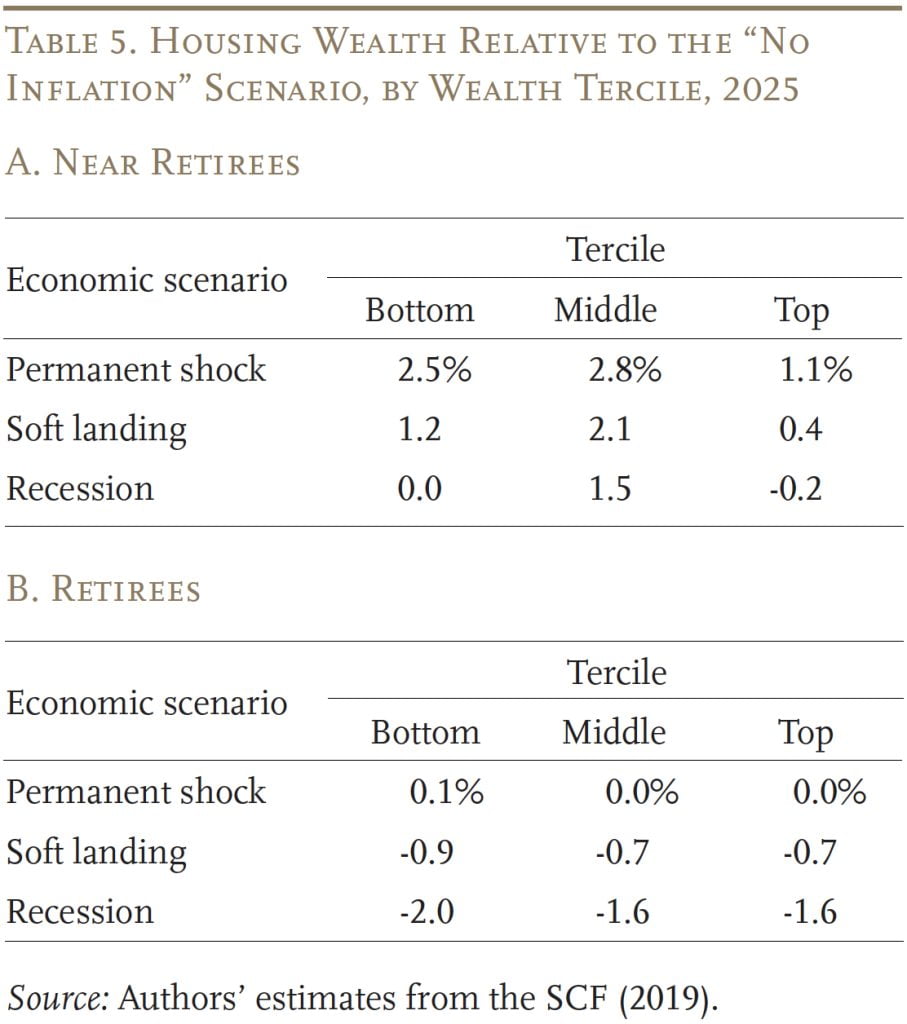
Table 5 illustrates the impact of inflation on housing wealth in 2025, relative to the “no inflation” scenario. Unlike financial wealth, inflation does not have much impact on housing wealth. On the one hand, home prices decline as rising real long-term interest rates weaken demand; on the other hand, inflation erodes the real burden of mortgage debt. For this latter reason, near retirees often come out slightly ahead of retirees because they more likely to still be paying down their mortgage.
In summary, most older households lose real consumption and wealth after an inflation shock. The magnitude of the loss depends on the nature of the shock, the real growth of income and assets, and the household’s exposure to fixed-rate debt.
Conclusion
Older households have just had a sharp reminder that inflation may not be stable throughout retirement. Experiencing a bout of high inflation later in life is generally harmful to financial well-being, but, as expected, the impact varies depending on the household’s specific financial profile: the extent to which income and assets grow with (or lag) inflation, and the amount of debt outstanding.
At this point, the soft landing scenario seems most representative of the current situation. Near retirees in this scenario appear to gain in consumption and housing wealth relative to a no-inflation scenario primarily due to the decline in the real value of mortgages. In contrast, despite fully inflation-adjusted Social Security benefits, retirees lose out due to having less fixed-rate debt and also a decline in real income as employer pension benefits are only partially indexed to inflation.
This brief, however, is only a first look at the impact of inflation on older households. A key question is how near retirees and retirees react to inflation and how their actions affect their consumption over the period and their wealth at the end. This topic will be addressed in our second brief.
References
Adam, Klaus and Panagiota Tzamourani. 2016. “Distributional Consequences of Asset Price Inflation in the Euro Area.” European Economic Review 89: 172-192.
Albanesi, Stefania. 2007. “Inflation and Inequality.” Journal of Monetary Economics 54(4): 1088-1114.
Aubry, Jean-Pierre and Laura D. Quinby. 2024. “What Risks Do Near Retirees and Retirees Face from Inflation, and How Do They React?” Special Report. Chestnut Hill, MA: Center for Retirement Research at Boston College.
Auclert, Adrien. 2019. “Monetary Policy and the Redistribution Channel.” American Economic Review 109(6): 2333-2367.
Bach, G. L. and James B. Stephenson. 1974. “Inflation and the Redistribution of Wealth.” Review of Economics and Statistics 56(1): 1-13.
Bartscher, Alina K., Moritz Schularick, Moritz Kuhn, and Paul Wachtel. 2022. “Monetary Policy and Racial Inequality.” Brookings Papers on Economic Activity (Spring): 1-63.
Bernanke, Ben S. 2015. “The Taylor Rule: A Benchmark for Monetary Policy?” Commentary. Washington, DC: Brookings Institution.
Brown, Jeffrey R., James M. Poterba, and David P. Richardson. 2023. “Trends in Retirement and Retirement Income Choices by TIAA Participants: 2000-2018.” Journal of Pension Economics and Finance.
Cieslak, Anna and Carolin Pflueger. 2023. “Inflation and Asset Returns.” Working Paper 31124. Cambridge, MA: National Bureau of Economic Research.
Congressional Budget Office. 2023. “The 2023 Long-Term Budget Outlook: Data Supplement.” Washington, DC.
Crawford, Ian and Zoe Oldfield. 2002. “Distributional Aspects of Inflation.” London, UK: The Institute for Fiscal Studies.
Del Canto, Felipe N., John R. Grisby, Eric Qian, and Conor Walsh. 2023. “Are Inflationary Shocks Regressive? A Feasible Set Approach.” Working Paper 30982. Cambridge, MA: National Bureau of Economic Research.
Doepke, Matthias and Martin Schneider. 2006a. “Aggregate Implications of Wealth Redistribution: The Case of Inflation.” Journal of the European Economic Association 4(2-3): 493-502.
Doepke, Matthias and Martin Schneider. 2006b. “Inflation as a Redistribution Shock: Effects on Aggregates and Welfare.” Working Paper 12319. Cambridge, MA: National Bureau of Economic Research.
Doepke, Matthias and Martin Schneider. 2006c. “Inflation and the Redistribution of Nominal Wealth.” Journal of Political Economy 114(6): 1069-1097.
Erosa, Andres and Gustavo Ventura. 2002. “On Inflation as Regressive Consumption Tax.” Journal of Monetary Economics 49: 761-795.
Federal Reserve Bank of St. Louis. 2000-2023. “Federal Funds Effective Rate.” St. Louis, MO.
Glaeser, Edward L., Joshua D. Gottlieb, Joseph Gyourko. 2010. “Can Cheap Credit Explain the Housing Boom?” In Housing and the Financial Crisis, edited by Edward L. Glaeser and Todd Sinai, 301-360. Chicago, IL: University of Chicago Press.
Gurer, Eren and Alfons Weichenrieder. 2020. “Pro-rich Inflation in Europe: Implications for the Measurement of Inequality.” German Economic Review 21(1): 107-138.
Hobijn, Bart and David Lagakos. 2005. “Inflation Inequality in the United States.” Review of Income and Wealth 51(4): 581-606.
Hottman, Colin J. and Ryan Monarch. 2020. “A Matter of Taste: Estimating Import Price Inflation across US Income Groups.” Journal of International Economics 127(103382): 1-16.
Internal Revenue Service. 2022. Distributions from Individual Retirement Arrangements (IRAs). Publication 590-B. Washington, DC.
Jaravel, Xavier. 2021. “Inflation Inequality: Measurement, Causes, and Policy Implications.” Annual Review of Economics 13: 599-629.
Kaplan, Greg and Sam Schulhofer-Wohl. 2017. “Inflation at the Household Level.” Journal of Monetary Economics 91: 19-38.
Lauper, Christoph and Giacomo Mangiante. 2021. “Monetary Policy Shocks and Inflation Inequality.” Working Paper.
Lee, Munseob, Claudia Macaluso, and Felipe Schwartzman. 2021. “Minority Unemployment, Inflation, and Monetary Policy.” Working Paper. Minneapolis, MN: Federal Reserve Bank of Minneapolis.
McGranahan, Leslie and Anna Paulson. 2005. “Constructing the Chicago Fed Income Based Economic Index-Consumer Price Index: Inflation Experiences by Demographic Group: 1983-2005.” Working Paper. Chicago, IL: Federal Reserve Bank of Chicago.
McKay, Alisdair and Christian K. Wolf. 2023. “Monetary Policy and Inequality.” Journal of Economic Perspectives 37(1): 121-144.
Munnell, Alicia H., Gal Wettstein, and Wenliang Hou. 2020. “How Best to Annuitize Defined Contribution Assets?” Journal of Risk and Insurance 89(1): 211-235.
Munnell, Alicia H., Jean-Pierre Aubry, and Mark Cafarelli. 2014. “COLA Cuts in State/Local Pensions.” Issue in Brief 38. Chestnut Hill, MA: Center for Retirement Research at Boston College.
Orchard, Jacob. 2022. “Cyclical Demand Shifts and Cost of Living Inequality.” Working Paper.
U.S. Board of Governors of the Federal Reserve System. Survey of Consumer Finances, 2019. Washington, DC.
U.S. Bureau of Labor Statistics. 2000-2023. “Consumer Price Index.” Washington, DC.
Wolff, Edward N. 2023. “Is There Really an Inflation Tax? Not for the Middle Class and the Ultra-Wealthy.” Working Paper 31775. Cambridge, MA: National Bureau of Economic Research.
Yang, Yucheng. 2022. “Redistributive Inflation and Optimal Monetary Policy.” Working Paper.
Endnotes
- 1The full-length study is Aubry and Quinby (2024).
- 2Adam and Tzamourani (2016); Albanesi (2007); Au-clert (2019); Bach and Stephenson (1974); Crawford and Oldfield (2002); Doepke and Schneider (2006a, 2006b, and 2006c); Erosa and Ventura (2002); Gurer and Weichenrieder (2020); Hottman and Monarch (2020); Hobijn and Lagakos (2005); Jaravel (2021); Kaplan and Schulhofer-Wohl (2017); Lee, Macaluso, and Schwartzman (2021); McGranahan and Paulson (2005); and Yang (2022). A few post-pandemic papers also take this approach; for example, see Bartscher et al. (2022); Del Canto et al. (2023); Lauper and Mangi-ante (2021); McKay and Wolf (2023); Orchard (2022); and Wolff (2023).
- 3While most private sector pensions do not provide any inflation adjustments to benefit payments, a majority of state and local government pensions provide adjustments that account for a portion of the rise in prices.
- 4Specifically, the concern here is whether the Federal Reserve takes overly aggressive action that triggers a recession. Cieslak and Pflueger (2023) provide a nice overview of these models.
- 5Glaeser, Gottlieb, and Gyourko (2010).
- 6Note that saving can be negative if households draw down their existing assets or take on additional debt. Households also pay income and consumption taxes that reduce the amount of disposable income. While income tax brackets are indexed for inflation, households might shift brackets as a result of inflation (both because mortgage payments are tax deductible and because household income might not fully keep pace with inflation). We do not model this shift because it is complex and – for most households – has a relatively small impact on average tax rates.
- 7Conceptually, the real change in consumption accounts for the rise in the price level over time.
- 8We use the 2019 SCF because the most recent 2022 data reflect households’ experience in 2021, which was still an unusual pandemic year with significant (and transitory) federal stimulus transfers.
- 9Specifically, 70 percent of spouses are also employed.
- 10The terciles are based on total wealth excluding Social Security and defined benefit pensions but including housing.
- 11The average mortgage payment amount in Table 1 includes households who no longer have a mortgage (i.e., their mortgage payments are zero).
- 12The Taylor Rule is an equation specifying the optimal level of the Federal Funds Rate (r) given a level of inflation (p) and output gap (y). Bernanke (2015) demonstrates that the specification: r = p + y + 0.5(p-2) + 2 best fits the Fed’s decision-making in practice. In the financial markets, expected long-term inflation hovers at 2 percent, while the real long-term interest rate rises from roughly zero experienced during the long period of low growth to a more normal 1 percent.
- 13In the financial markets, expected long-term inflation rises to 4 percent, while the real long-term interest rate rises from roughly zero to 1 percent.
- 14In the financial markets, expected long-term inflation hovers around 2 percent throughout the analysis period, while the real long-term interest rate rises from roughly zero to 1 percent.
- 15In the financial markets, expected long-term inflation rises to 3 percent as the Fed struggles to tamp down inflation, but returns to 2 percent after the recession. At the same time, the real long-term interest rate rises from roughly zero to 1 percent by December 2025.
- 16In our initial scenario analysis, we assume that workers do not work more or less due to inflation, so the growth in annual earnings is determined solely by employer wage-setting behavior.
- 17Munnell, Aubry, and Cafarelli (2014). In the SCF, just over half of households with pension income report receiving COLA adjustments, and the share with a COLA is increasing over time. These trends are consistent with private DB plans becoming less available. Consequently, we assume that 60 percent of pension income receives an adjustment, with the COLA capped at 3 percent.
- 18Munnell, Wettstein, and Hou (2020) and citations therein.
- 19See Internal Revenue Service (2022). This assumption is consistent with a growing body of empirical work suggesting that RMDs have become the default drawdown strategy for many retirees (see, for example, Brown, Poterba, and Richardson 2023).
- 20For a detailed description of our methodology for each asset class, see Aubry and Quinby (2024).
- 21Recall that consumption equals monthly income less saving and debt payments. Wealth, meanwhile, equals financial and housing assets minus outstanding debt. We compare the growth in these outcomes to the rise in price levels to understand whether households maintain their standard of living. Put simply, if consumption and/or wealth grow more slowly than inflation, a household is worse off.
- 22Since we assume that wages lag inflation, they decline in real terms when inflation is rising, then grow in real terms when inflation abates.


Aubry, Jean-Pierre and Laura D. Quinby. 2024. "How Does Inflation Impact Near Retirees and Retirees?" Issue in Brief 24-12. Chestnut Hill, MA: Center for Retirement Research at Boston College.