
How Much Does Health Spending Eat Away at Retirees’ Income? An Update

The brief’s key findings are:
- With concerns about affordability front and center, the burden of out-of-pocket health spending relative to income is a key measure of retirement well-being.
- Even with Medicare coverage and ignoring long-term care, retirees face sizable costs for premiums, copays, and uncovered services.
- After subtracting these costs, the typical retiree has only 71 percent of Social Security and 88 percent of total income left.
- This burden was fairly steady during the period analyzed – 2018 to 2022 – but many retirees may be worried that it could grow in the future.
Introduction
At a time when affordability is the political watchword, the burden of out-of-pocket (OOP) health spending is a key measure of retirement well-being. OOP costs include all premiums and cost sharing related to Medicare and supplemental plans, and the full cost of services not covered by these plans.
t covered by these plans.
Over the last decade, much has changed for Medicare beneficiaries in ways that could affect their OOP costs. On one hand, some changes would tend to push down cost growth. For example, more than half of beneficiaries now opt for Medicare Advantage coverage, and an increasing share of these plans charge no premiums. And Part D’s “donut hole” has been eliminated, with more changes on tap that could further reduce the burden of prescription drugs. On the other hand, premiums in Medicare Part B have risen rapidly, driven in part by coverage for expensive prescription drugs. And that’s not to mention the COVID-19 pandemic, which had a disproportionate impact on the 65+ population that is eligible for Medicare, and led to the highest overall inflation in a generation in its aftermath.
This brief, which updates earlier research, looks at the extent to which OOP medical expenses affect retirees’ finances.1 Specifically, it uses the 2018-2022 waves of the Health and Retirement Study to calculate the share of Social Security benefits and total income available for non-medical spending and explores how this measure – the post-OOP ratio – differs by age, health status, and income and, most importantly, supplemental insurance coverage.
The discussion proceeds as follows. The first section provides background on OOP spending. The second section discusses the data and methodology. The third section presents the results, showing that – for the median retiree – only 71 percent of Social Security benefits and 88 percent of total income are available for non-medical spending, though those figures have been stable from 2018 to 2022, even amidst policy and coverage changes, as well as the pandemic. The final section concludes that, with such a substantial portion of income going to medical costs, retirees’ finances are more precarious than Social Security benefit levels alone might suggest.
Background
The general public and most policy analysts tend to evaluate the adequacy of retirement income, and Social Security benefits in particular, based on the level of retirees’ total income. More relevant to their purchasing power, though, is their income net of OOP medical costs, which are often considered nondiscretionary.2
Even though retirees ages 65+ have Medicare, they still face considerable costs. In the case of Medicare Part A, which covers inpatient hospital care and is financed primarily by payroll taxes, beneficiaries face cost sharing. Medicare Part B, which covers physician and outpatient hospital services, and Part D, which covers prescription drugs, are partly financed by premiums and include further cost sharing. Because Medicare’s OOP costs are often substantial, many enrollees buy supplemental coverage, which may include additional premiums. Finally, retirees without supplemental plans face the full cost of the many services not covered by Medicare, such as dental, vision, and hearing. Spending on long-term care, which can be substantial, is excluded from this analysis in order to focus on the impact of OOP spending in a typical year.3
In recent years, Medicare Advantage plans have become the primary coverage vehicle for Medicare recipients, rising from 37 percent in 2018 to 48 percent in 2022.4 Medicare Advantage enrolls Medicare beneficiaries in private plans that cover the same services as Parts A, B, and D, and often cover services that traditional Medicare does not. In prior years, Medicare Advantage often carried an additional premium, but recent evidence indicates that most of these plans are now offered at no additional cost (beyond the Part B premium).5 On the other hand, these plans use more restrictive provider networks that may limit enrollees’ access to their preferred doctors and hospitals; and they also tend to cost the Medicare program more per enrollee.6
The primary question in this analysis is how OOP spending affects the share of Social Security benefits and total income available for non-medical expenditures, for older Americans overall and by subgroups. Prior work has shown that older retirees, those in the worst health, and the near poor who do not qualify for Medicaid have the lowest post-OOP incomes.7
The relationship between supplemental coverage and the share of income remaining is particularly interesting. The three main types of supplemental insurance are:8
- Medicare Advantage;
- Medicaid, the public program for low-income individuals that covers Medicare cost sharing and premiums as well as services not covered by Medicare; and
- Retiree health insurance (RHI), a form of private group health coverage that some employers offer to former employees after retirement.
When both premiums and other OOP costs are considered, prior work consistently finds that Medicaid enrollees have the highest share of post-OOP income, in most cases followed by Medicare Advantage enrollees, while those with no form of supplemental insurance have the lowest shares.9
Accounting for OOP cost burdens is important, because it is crucial to know how much retirees who rely exclusively on Social Security have remaining for non-medical spending. In addition, understanding how benefit adequacy varies by subgroups helps identify those who may be particularly at risk. Finally, with the growing importance of supplemental insurance, participants need to understand what types of coverage are likely to leave them in the best position. The following analysis addresses all of these issues.
Data and Methodology
The analysis uses the Health and Retirement Study (HRS), which collects information every two years on the financial security, work histories, medical expenditures, insurance coverage, and self-reported Social Security benefits of respondents, who are over age 50. This brief takes advantage of the release of two waves of data since the previous update, featuring data from interviews conducted in 2020 and 2022.10
The sample is limited to respondents who are ages 65+ and are receiving both Social Security and Medicare, and it excludes those who are working or report receiving health insurance from a current employer or spouse’s employer. In other words, the sample is limited to retirees fully detached from the labor force and reliant on Medicare.
The three key components of the study – Social Security benefits, total personal income, and OOP medical expenditures (excluding long-term care) – are derived from self-reported information in the HRS. Since Social Security benefits do not capture the total resources available to retirees, the analysis also examines the percentage of total income – which includes pensions, government transfers, capital income, and income from 401(k)s and IRAs – that remains after spending on medical costs.
In terms of OOP expenditures, the HRS captures prescription drugs, special facilities, surgery, and medical visits to doctors, hospitals, and dentists. It also includes self-reported measures for premiums paid for Medicare Part D, Medicare Advantage, and private supplemental plans. Medicare Part B premiums are imputed from reported income. These components are combined to calculate the share of income remaining after out-of-pocket spending for each beneficiary in each year.
The analysis examines the extent to which outcomes differ by age, health status, and household income. Health status is measured with two separate indicators, whether the respondent: 1) ever had a chronic health condition;11 and 2) reported difficulty with at least two activities of daily living (ADLs).12
Results
This section presents the results first for the entire sample, then by population subgroups, and finally by type of supplemental coverage.
Full Sample
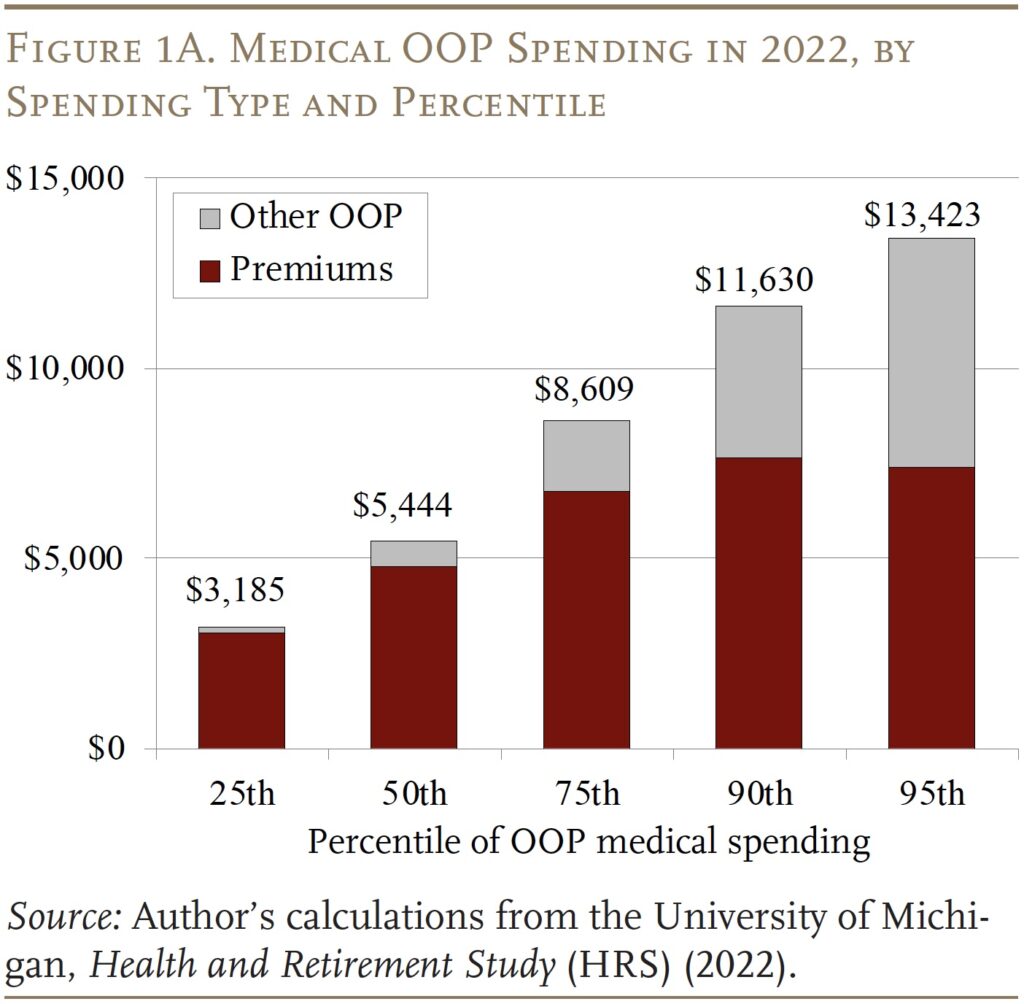
Figure 1A demonstrates the wide breadth of OOP spending among retirees. The median retiree spent $5,444 on medical costs in 2022 (in nominal dollars). Spending at the 95th percentile is more than twice as large. Figure 1A also illustrates that premiums comprise the bulk of OOP costs. The differences between high spenders and others are mostly due to outlays for cost sharing and uncovered services.
But Figure 1B shows that the OOP spending figures – at the 25th, 50th, and 95th percentiles – stayed roughly constant in real 2022 dollars since 2018, indicating that OOP medical spending roughly kept pace with overall inflation, for both premiums and other OOP spending.
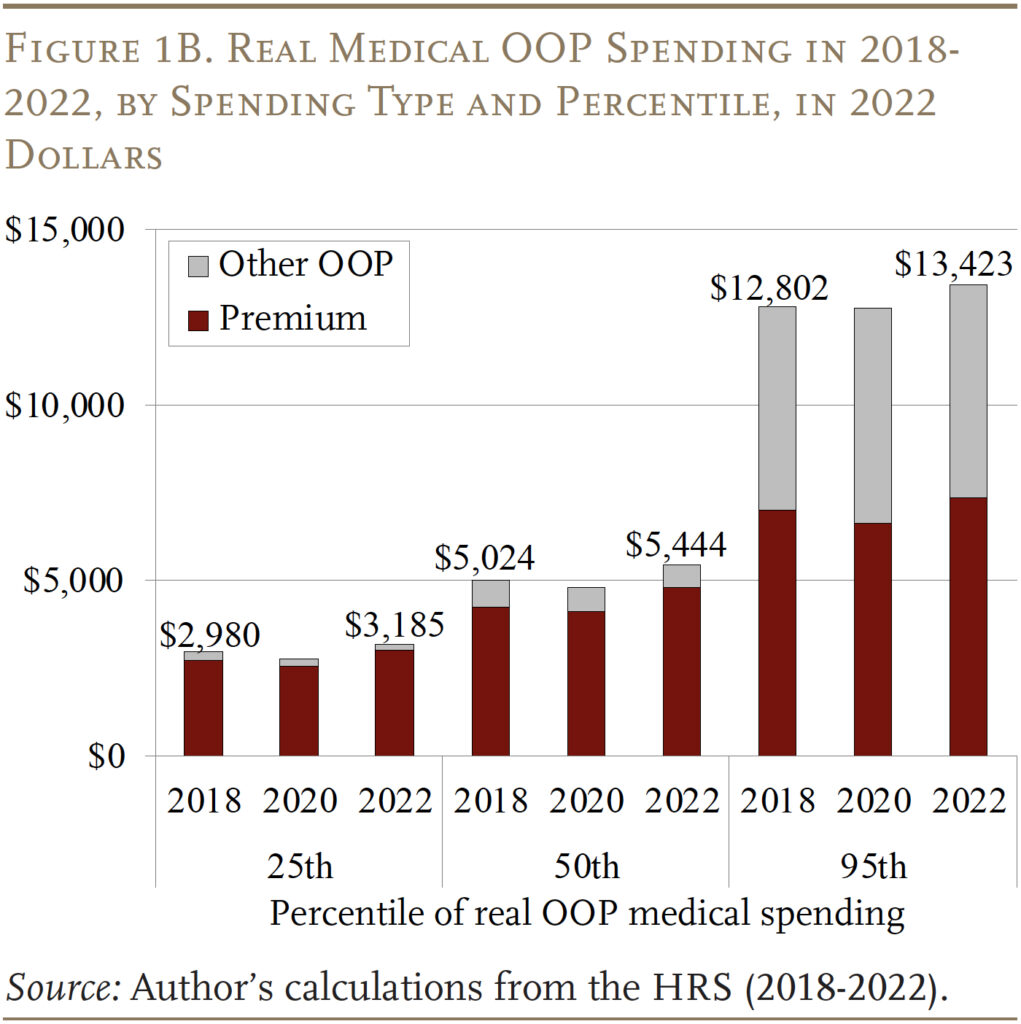
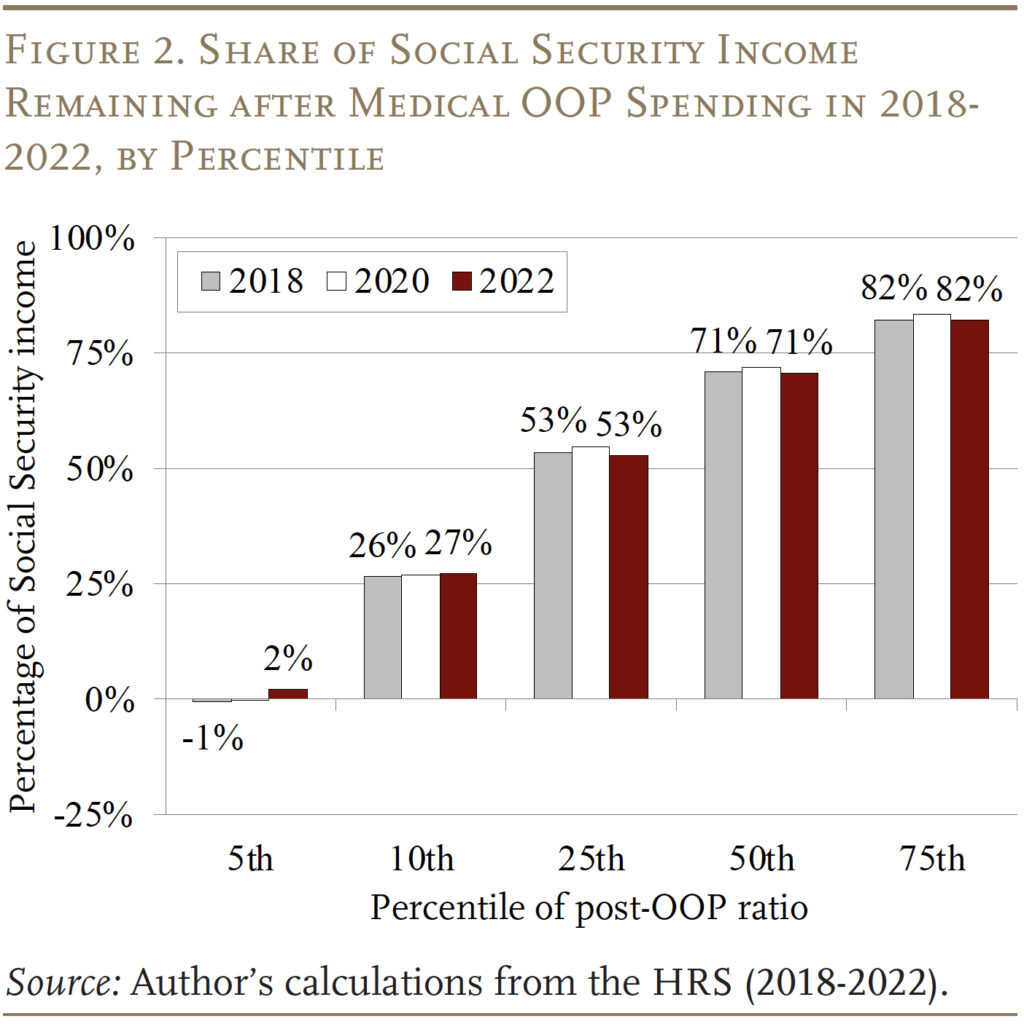
Figure 2 shows – for each of the 2018-2022 HRS waves – the share of Social Security income remaining after OOP expenditures, referred to here as the “post-OOP ratio.”13 For the median retiree in this distribution in 2022, only 71 percent of the Social Security benefit remains after paying premiums and other OOP costs, though this amount is consistent over the four-year period. OOP spending is much more burdensome at lower post-OOP income levels. For example, 5 percent of retirees have essentially none of their benefit left after medical OOP costs. Even at the 10th percentile, retirees spend all but one-quarter of their benefit on medical OOP costs. These results demonstrate that, for a large number of retirees, OOP costs comprise a sizable share of Social Security income.
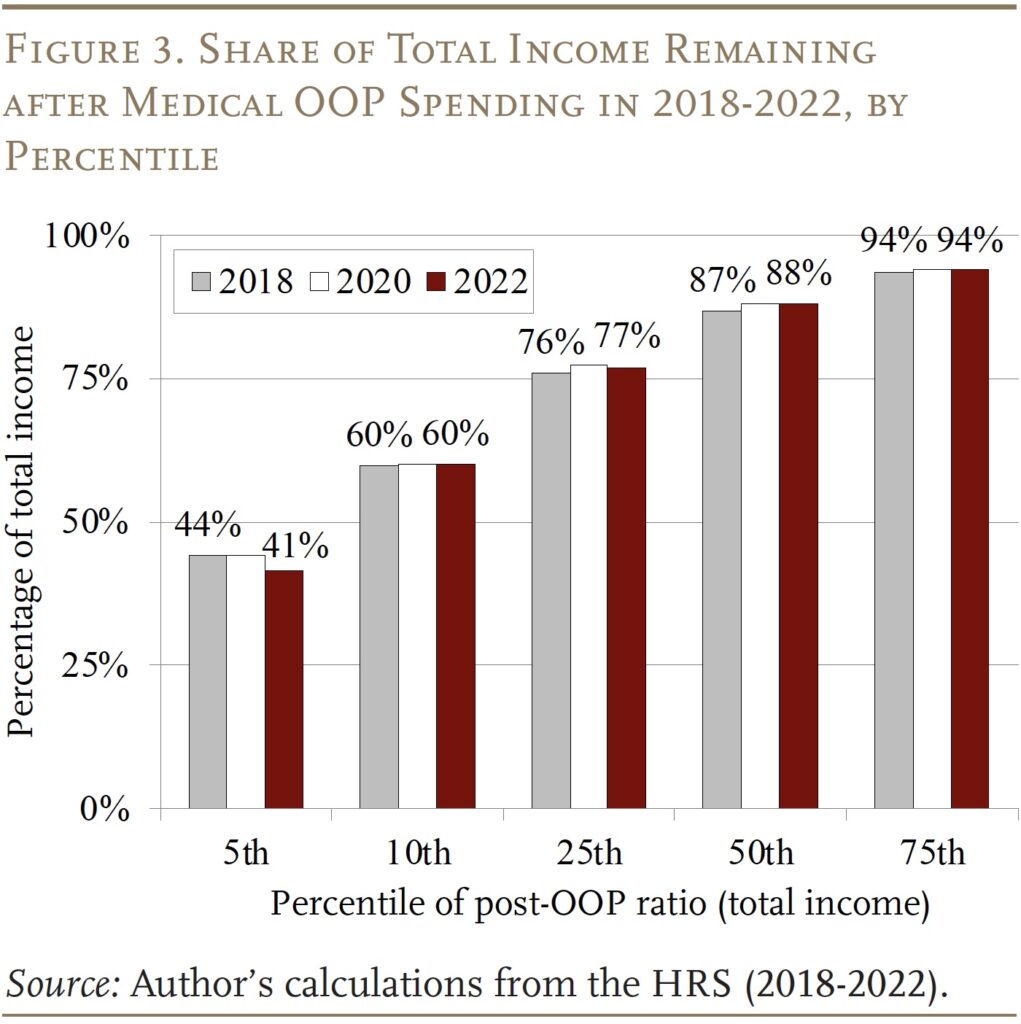
When looking at total income, the share remaining is higher, as expected, but still varies considerably (see Figure 3), though again the picture is stable across years. The median retiree has 88 percent of his total income left over, but 5 percent of the sample is left with as little as 40 percent of total retirement income after medical spending.
Age, Health, and Income
The portion of retirement income left over after OOP costs varies by age, health status, and income. Because the results have been stable over the 2018-2022 period, the remaining figures show only the 2022 results (the most recent HRS data available).
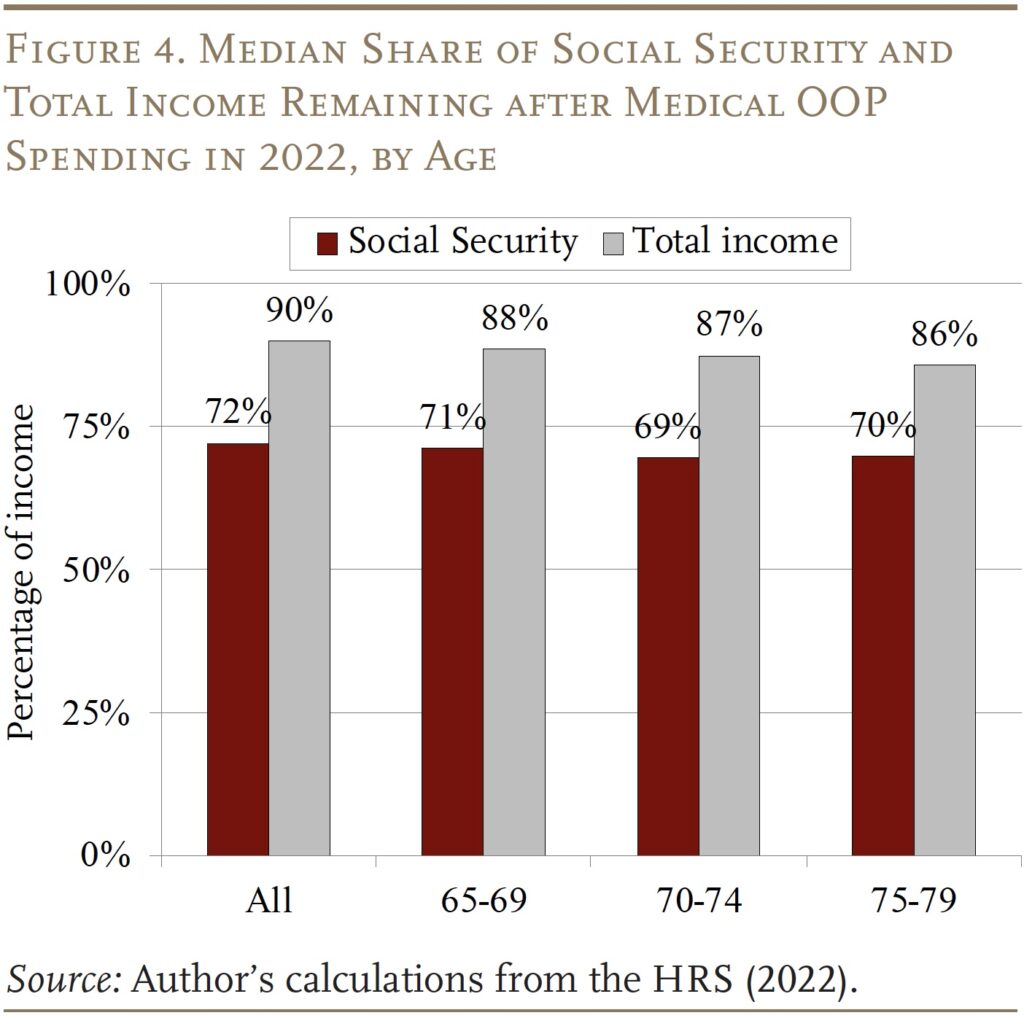
Figure 4 shows that the shares of both Social Security benefits and total income remaining post-OOP changes very little with age – showing just a slight decline as people grow older. At least at the median, these numbers were very stable across the 2018-2022 period despite the pandemic more deeply affecting the oldest groups in this sample.
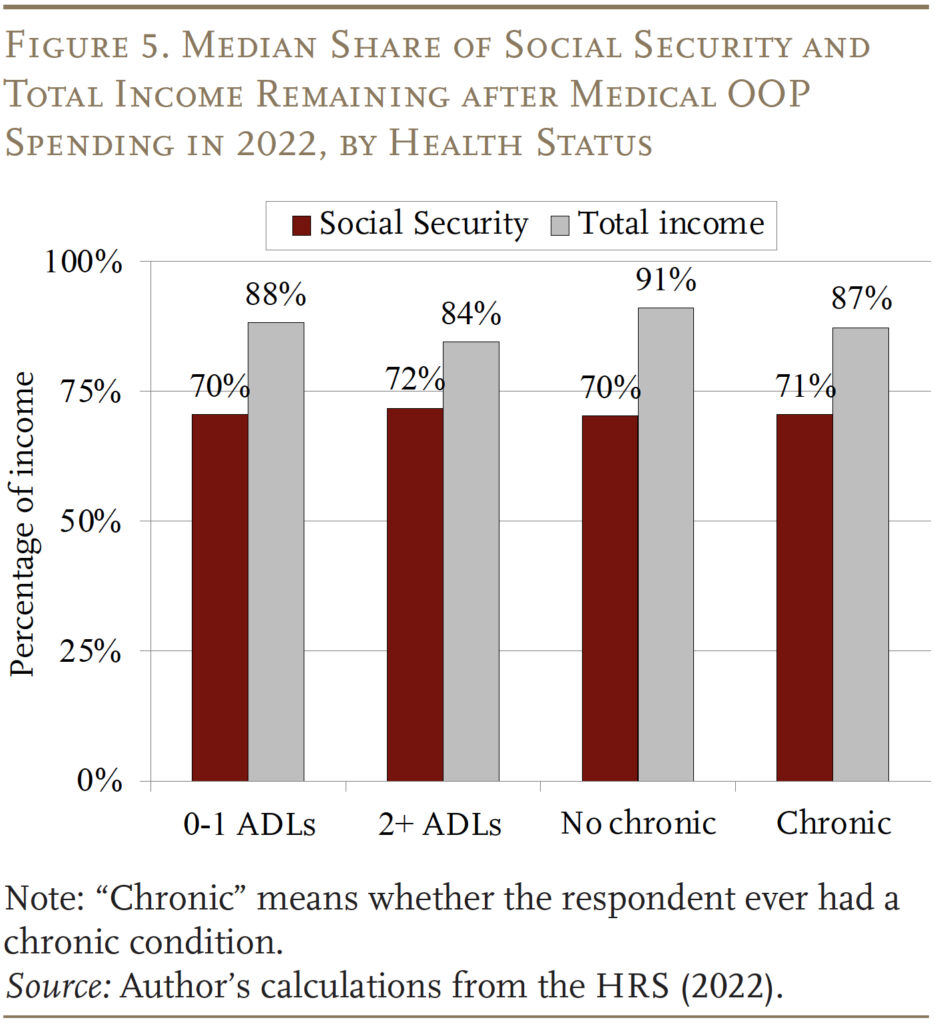
With respect to health status, the share of Social Security benefits or total income available for non-medical spending is surprisingly similar for retirees with and without health concerns (see Figure 5). The exception arises for those never reporting a chronic condition, who have 91 percent of their total income remaining after OOP costs. This outcome occurs because their total retirement income is much higher than for those with any chronic conditions.
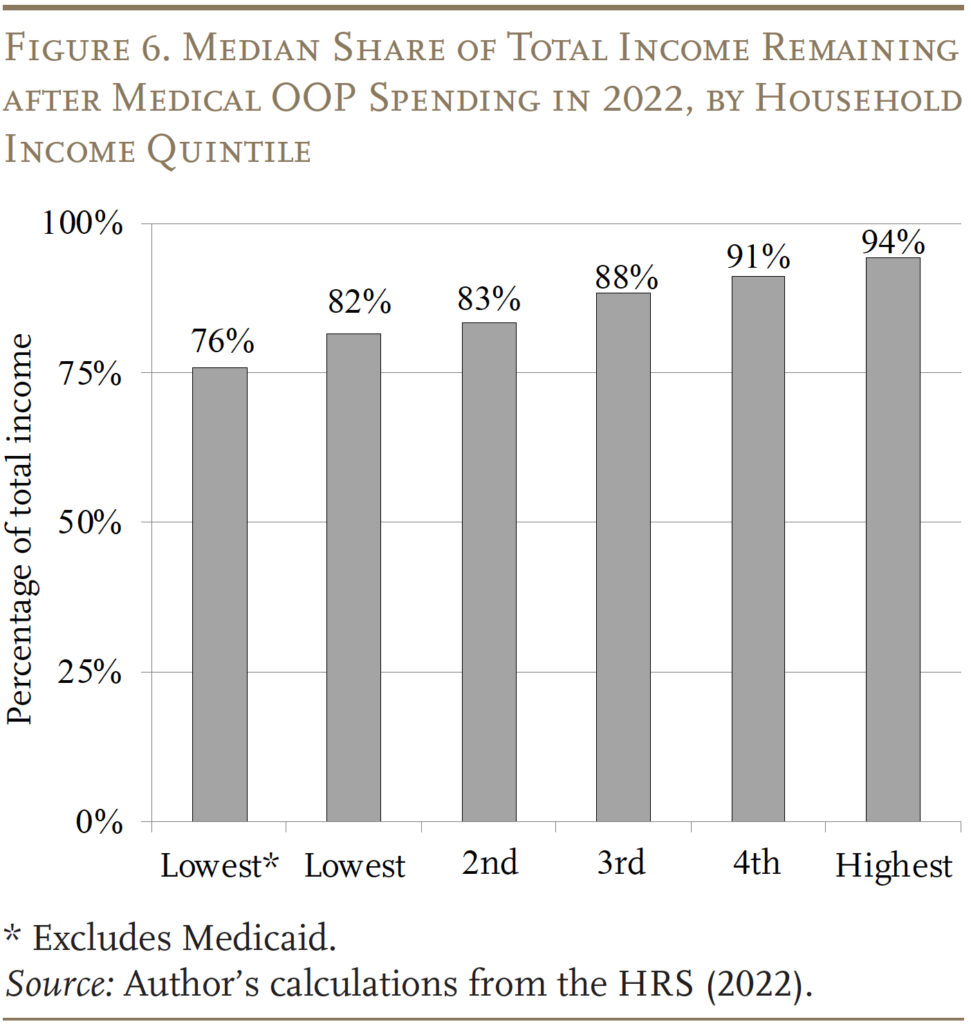
In terms of differences across the income distribution, the pattern is predictable – the share of income remaining after accounting for OOP costs rises with income (see Figure 6). (The focus here is total income because of the relatively little variation in Social Security benefits.) The highest quintile has 94 percent of total income remaining, even after accounting for income-related premium surcharges for Part B. The lowest quintile has 82 percent, which incorporates the beneficial impact of Medicaid. Excluding those who report Medicaid coverage (about half of the lowest quintile’s sample), the post-OOP ratio falls to only 76 percent.
Type of Supplemental Insurance
One of the more important distinctions with respect to OOP spending is the type of supplemental insurance retirees have (see Figure 7).14 Medicaid enrollees have the highest share of income – both Social Security and total – remaining after OOP spending, which is to be expected given that Medicaid often has no premiums and minimal cost sharing.
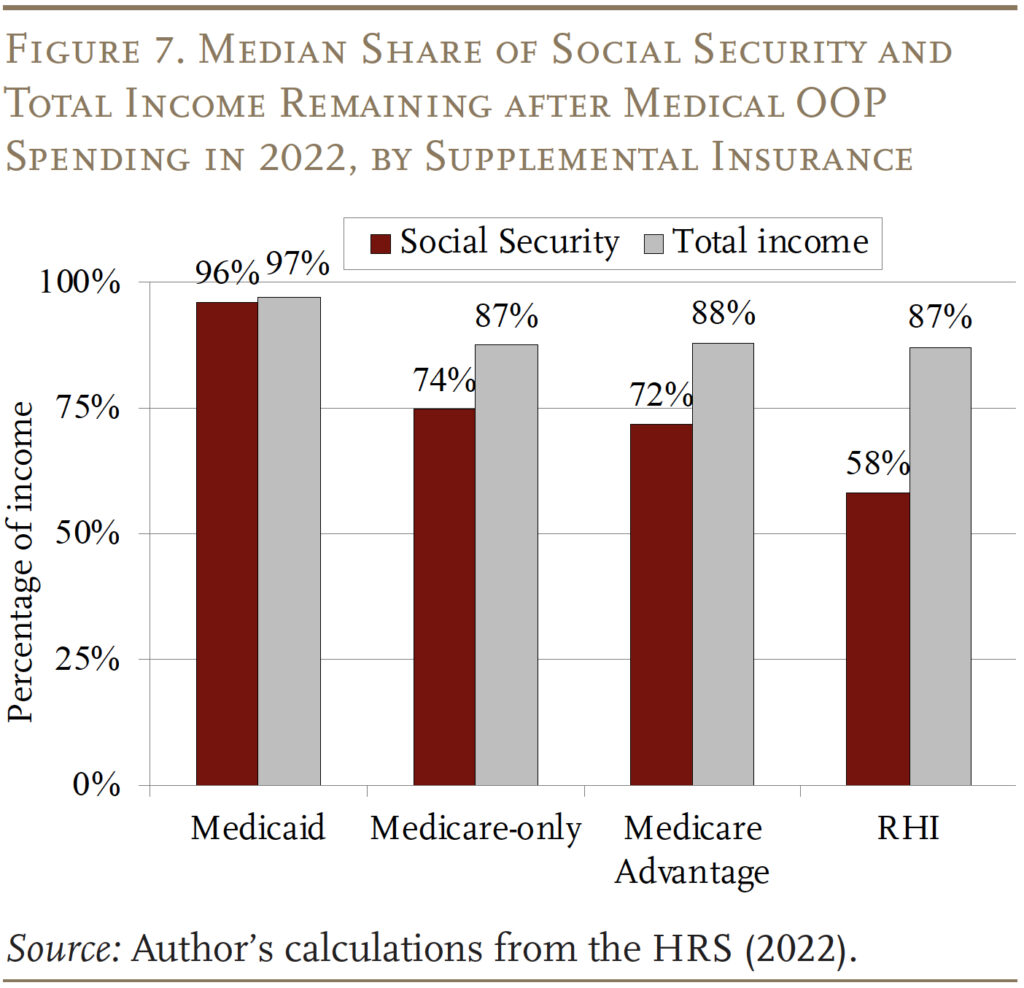
Among the other groups, it is helpful to look by source of income separately. With respect to Social Security, surprisingly, those with just traditional Medicare appear to do the best, at least for the median retiree, followed by those with Medicare Advantage and those with RHI. These differences are due entirely to premiums, despite the growth in zero-premium Medicare Advantage plans. All three groups have similar Social Security income and spend a similar amount on cost sharing and uncovered services, but those with no supplemental insurance pay the least in premiums.15 As a share of total income, all four groups have much more similar post-OOP income available, due to differences in their income levels. For example, respondents with RHI have much higher total incomes in retirement, and only about half of the average RHI enrollee’s income comes from Social Security; as a result, the share remaining after OOP increases to 87 percent.
Conclusion
At the median, OOP medical costs – including premiums, cost sharing, and uncovered services (excluding long-term care) – leave only 71 percent of Social Security benefits available for spending on other items. Premiums for Medicare Parts B and D, Medicare Advantage, and supplemental plans (including RHI) make up the lion’s share of medical spending for most retirees, except those with the highest spending. The share of income remaining after OOP spending is lower for those in poor health and low-income households.
Remarkably, considering the pandemic and changes to policy and coverage markets, very little changed across the 2018-2022 period. However, further changes may still be in the offing. The Inflation Reduction Act of 2022 made several alterations to Part D that had not been instituted by the end of 2022: a $35-per-month cap on insulin starting in 2023; elimination of the 5-percent catastrophic coverage coinsurance in 2024; a $2,000 OOP cap starting in 2025; and the ability to negotiate lower drug prices starting in 2026, though whether the change in administrations will affect those negotiations remains to be seen.16 The analysis also does not account for changes to Medicaid induced by the One Big Beautiful Bill Act of 2025, though Medicare was largely left unaffected.
With OOP health expenditures already eating away at retirement income, and the uncertainty from further health policy changes and Social Security drawing ever closer to trust fund depletion, it is understandable why many retirees feel that making ends meet is difficult.17
References
Akincigil, Ayse and Karen Zurlo. 2015. “The Economic Burden of Out-of-Pocket Medical Expenditures Before and After Implementation of the Medicare Prescription Drug Program.” Working Paper 2015-28. Chestnut Hill, MA: Center for Retirement Research at Boston College.
Belbase, Anek, Anqi Chen, and Alicia H. Munnell. 2021. “What Resources Do Retirees Have for Long-Term Services & Supports?” Issue in Brief 21-16. Chestnut Hill, MA: Center for Retirement Research at Boston College.
Chen, Anqi, Alicia H. Munnell, and Gal Wettstein. 2025. “How Do Retirees Cope with Uninsured Medical and Long-Term Care Costs?” Working Paper 2025-6. Chestnut Hill, MA: Center for Retirement Research at Boston College.
Cubanski, Juliette, Tricia Neuman, Meredith Freed, and Anthony Damico. 2023. “How Will the Prescription Drug Provisions in the Inflation Reduction Act Affect Medicare Beneficiaries?” Menlo Park, CA: Kaiser Family Foundation.
Cubanski, Juliette, Christina Swoope, Anthony Damico, and Tricia Neuman. 2014a. “Health Care on a Budget: The Financial Burden of Health Spending by Medicare Households.” Menlo Park, CA: Kaiser Family Foundation.
Cubanski, Juliette, Christina Swoope, Anthony Damico, and Tricia Neuman. 2014b. “How Much Is Enough? Out-of-Pocket Spending Among Medicare Beneficiaries: A Chartbook.” Working Paper. Menlo Park, CA: Kaiser Family Foundation.
Farrell, Diana and Fiona Greig. 2017. “Coping with Costs: Big Data on Expense Volatility and Medical Payments.” New York, NY: J.P. Morgan Chase Institute.
Freed, Meredith, Jeannie Fuglesten Biniek, Anthony Damico, and Tricia Neuman. 2024a. “Medicare Advantage in 2024: Premiums, Out-of-Pocket Limits, Supplemental Benefits, and Prior Authorization.” Menlo Park, CA: Kaiser Family Foundation.
Freed, Meredith, Nancy Ochieng, Juliette Cubanski, and Tricia Neuman. 2024b. “Key Facts About Medigap Enrollment and Premiums for Medicare Beneficiaries.” Menlo Park, CA: Kaiser Family Foundation.
Jiang, Changchuan, Lesi He, Chuan Angel Lu, Arthur S. Hong, Xin Hu, Joseph H. Joo, Ryan D. Nipp, Ya-Chen Tina Shih, K. Robin Yabroff, and Joshua M. Liao. 2025. “Zero-Premium Medicare Advantage Plans: Trends in Areas with Socioeconomic Vulnerability and Health Needs.” Health Affairs Scholar 3(9): 1-10.
McInerney, Melissa, Matthew S. Rutledge, and Sara Ellen King. 2017. “How Much Does Out-of-Pocket Medical Spending Eat Away at Retirement Income?” Working Paper 2017-13. Chestnut Hill, MA: Center for Retirement Research at Boston College.
McInerney, Melissa, Matthew S. Rutledge, and Sara Ellen King. 2022. “How Much Does Health Spending Eat Away at Retirement Income?” Issue in Brief 2022-12. Chestnut Hill, MA: Center for Retirement Research at Boston College.
Neuman, Patricia, Juliette Cubanski, Katherine A. Desmond, and Thomas H. Rice. 2007. “How Much ‘Skin in the Game’ Do Medicare Beneficiaries Have? The Increasing Financial Burden of Health Care Spending, 1997-2003.” Health Affairs 26(6): 1692-1701.
Noel-Miller, Claire. 2015. “Medicare Beneficiaries’ Out-of-Pocket Spending for Health Care.” Insight on the Issues Brief. Washington, DC: AARP Public Policy Institute.
RAND. Health and Retirement Study Longitudinal File, 2022 (V2). Santa Monica, CA.
Renwick, Trudi and Liana Fox. 2016. “The Supplemental Poverty Measure: 2015.” Report P60- 258. Washington, DC: U.S. Census Bureau.
University of Michigan. Health and Retirement Study, 2018-2022. Ann Arbor, MI.
Van de Water, Paul. 2025. “Growth in Medicare Advantage Raises Concerns.” Washington, DC: Center for Budget and Policy Priorities.
Endnotes
- McInerney, Rutledge, and King (2017, 2022). ↩︎
- For example, the U.S. Census Bureau’s Supplemental Poverty Measure examines family income net of medical spending, because these costs are assumed to be non-discretionary (Renwick and Fox 2016). ↩︎
- Chen, Munnell, and Wettstein (2025), and Belbase, Chen, and Munnell (2021) explore the burden of long-term care costs. McInerney, Rutledge, and King (2017) feature supplemental analysis that includes long-term care, and the results are qualitatively similar. ↩︎
- Freed et al. (2024a). ↩︎
- The share of Medicare Advantage plans offered at a zero-dollar premium rose from 46 percent in 2019 to 66 percent in 2024, according to Jiang et al. (2025), using CMS data. But Freed et al. (2024a), using similar data, find an even higher share with no additional premium: nearly 75 percent. ↩︎
- Van de Water (2025). ↩︎
- Akincigil and Zurlo (2015); Cubanski et al. (2014a); Neuman et al. (2007); and Noel-Miller (2015). ↩︎
- About 21 percent of Medicare beneficiaries buy private supplemental coverage through Medigap (Freed et al. 2024b), but recent waves of the HRS (including 2018-2022) do not ask explicitly about Medigap coverage, so it is not included in the analysis by supplemental insurance category. ↩︎
- Akincigil and Zurlo (2015); Cubanski et al. (2014a); Neuman et al. (2007); and Noel-Miller (2015). ↩︎
- The analysis uses both the raw HRS files from the University of Michigan and the RAND HRS files. ↩︎
- Possible chronic health conditions include cancer, lung disease, stroke, heart problem, diabetes, and high blood pressure. ↩︎
- Specifically, the HRS asks whether the respondent currently has difficulty with six ADLs: walking across a room, getting dressed, eating, bathing, using the bathroom, and getting into/out of bed. ↩︎
- Because the post-OOP ratio subtracts spending from Social Security benefits, someone spending at the 95th percentile in Figure 1B will end up with very little net income, putting them around the 5th percentile of the post-OOP ratio distribution in Figure 2. Similarly, the 90th percentile from Figure 1B roughly corresponds to the 10th percentile in Figure 2, as long as the distribution of Social Security income is not too skewed. ↩︎
- The 31 percent of the sample who report supplemental coverage other than Medicaid, Medicare Advantage, or RHI are not included as a separate group in this figure because they are a heterogeneous group, ranging from individuals with low-cost TRICARE plans to those with self-purchased Medigap plans that carry high premiums. ↩︎
- This premium burden is in line with Cubanski et al. (2014b), who found that respondents to the Medicare Current Beneficiary Survey with RHI supplementing their Medicare coverage spent half of their OOP spending on premiums in 2010. Retirees with no supplemental coverage still face the cost of Medicare Part B and D premiums. Even those with zero-premium Medicare Advantage plans tend to pay Part B premiums, and if their income is greater on average, they are more likely to be subject to the income-related premium surcharges. ↩︎
- Cubanski et al. (2023). ↩︎
- On top of medical spending – which most analyses treat as outside of the individual’s discretion – retirees face a substantial amount of other non-discretionary costs. Farrell and Greig (2017) find that housing expenses, taxes, and non-housing debt consume about 30 percent of retirees’ household income, leaving even less for surprise expenses and any other desired spending. ↩︎


Rutledge, Matthew S.. 2026. "How Much Does Health Spending Eat Away at Retirees' Income? An Update" Issue in Brief 26-3. Chestnut Hill, MA: Center for Retirement Research at Boston College.