
Investment Returns Vary a Lot Across State and Local Pension Plans

Alicia H. Munnell is a columnist for MarketWatch and senior advisor of the Center for Retirement Research at Boston College.
Variance due to returns by asset class more than asset allocation.
The Center for Retirement Research at Boston College just released a study that explores whether the source of variation in returns for state and local pension funds is due to asset allocation or returns by asset class. The short answer is returns by asset class, primarily because public plans tend to have fairly similar asset allocations.
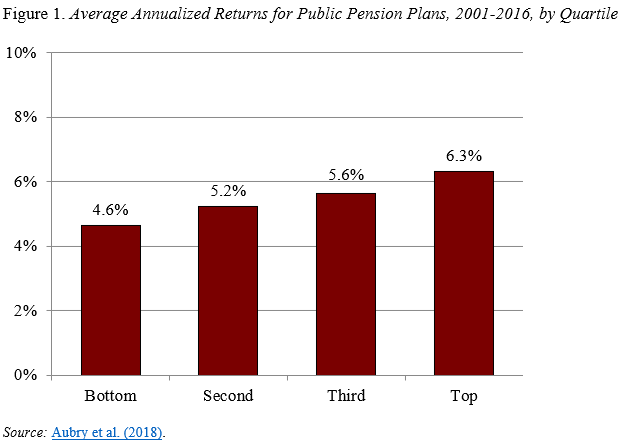
On average, the annualized return – net-of fees – for public plans was 5.5 percent from 2001-2016. But returns varied from 6.3 percent for plans in the top quartile to 4.6 percent for plans in the bottom quartile (see Figure 1).
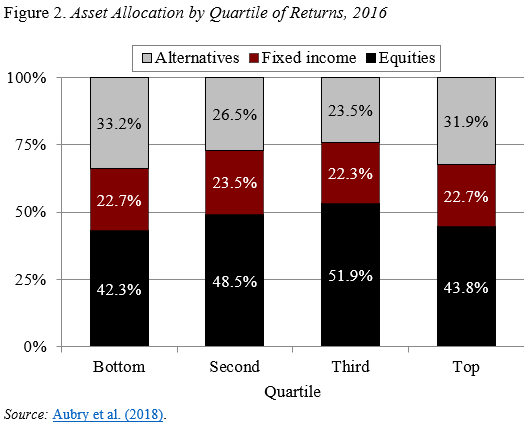
To get a sense of the relative roles of asset allocation and asset class returns, it is helpful to look at how each varied across the plan groups. Figure 2 shows that, at least in 2016, the asset allocation across quartiles of plans is relatively similar – allocations to the three broad asset classes differ by less than 10 percentage points.
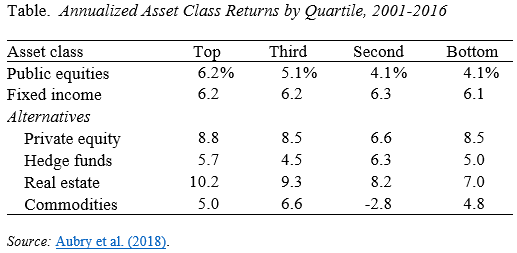
In contrast, the returns by asset class decline fairly systematically as one moves from the top to the bottom performers (see Table).
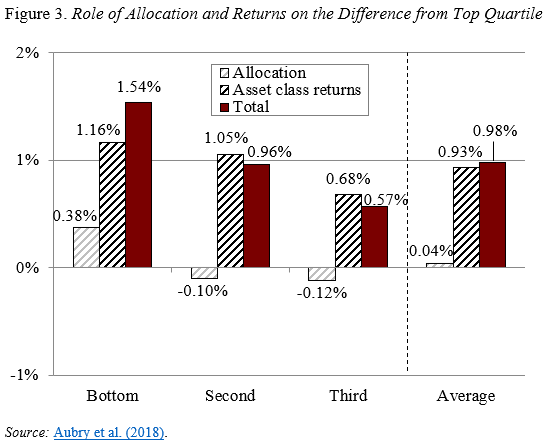
To get a more precise answer involves calculating how the lower performers would have fared if they first had the asset allocation and then the investment returns of the top performer. The results are shown in Figure 3. The difference between the annualized 16-year return for the bottom and top quartile is 1.54 percentage points. Applying the top quartile’s allocation to the bottom quartile increases the bottom quartile’s 16-year return by 0.38 percentage points – accounting for about 25 percent of the overall difference. Applying the top quartile’s asset class returns to the bottom quartile increases the 16-year return by the remaining 1.16 percentage points (1.54 – 0.38 = 1.16). For plans in the second and third quartiles, applying the top quartile’s allocation lowered their return slightly, but most of the difference was due to asset class returns.
While results differ from the conventional wisdom that asset allocation is the key to success, they are understandable given that asset allocation doesn’t vary dramatically across public pension plans.