
Medicaid Is Crucially Important to Older Americans, but Can It Handle a Rapidly Aging Population?
Alicia H. Munnell is a columnist for MarketWatch and senior advisor of the Center for Retirement Research at Boston College.
Needs may be unmet or larger burdens may fall to families.
Medicaid is the nation’s publicly financed health and long-term care program for low-income people. It was originally established to provide benefits to those receiving cash assistance or “welfare.” In the case of older Americans, that source of cash benefits was – and remains – the Supplemental Security Income (SSI) program. Over the years, however, Congress and the states have expanded Medicaid to reach a broad array of uninsured Americans living near or below the poverty level.
Medicaid is financed jointly by state and local governments. The federal government sets some basic requirements, but states have the flexibility to design their own versions of Medicaid within the federal statute’s basic framework. Spending on Medicaid has grown significantly over time as a percentage of GDP and as a percentage of federal and state budgets.
Trying to understand Medicaid actually made my brain hurt. It is crazy complicated with an array of complex pathways to benefits. But, it turns out that Medicaid is a really important program for those 65+.
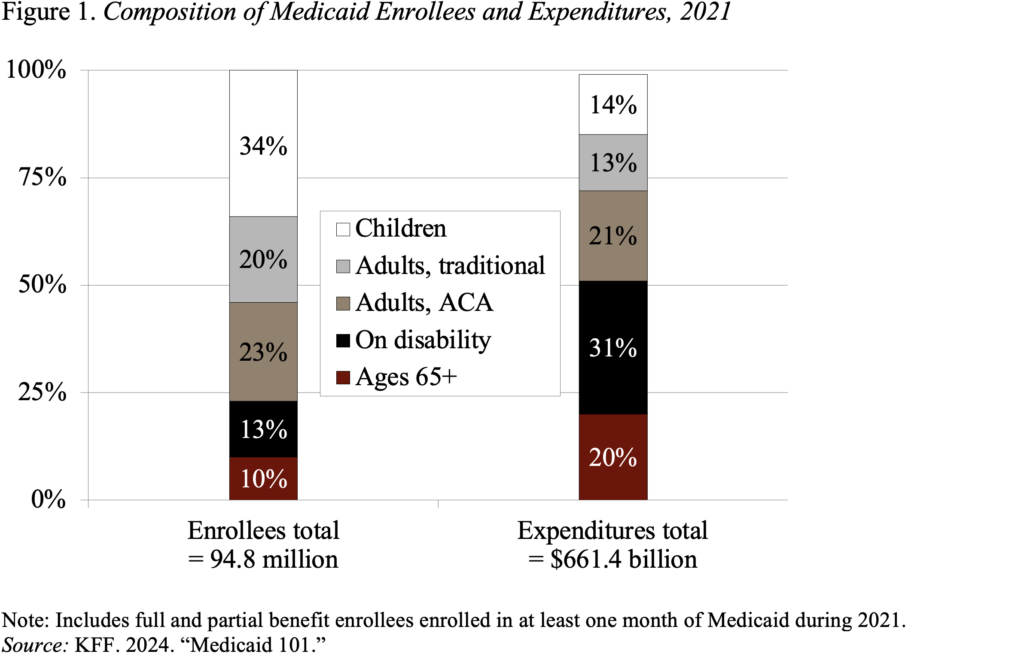
Medicaid provides benefits to five main groups of low-income individuals – children, adults (under 65) in families, adults (under 65) without children included under the Affordable Care Act (ACA), individuals with disabilities, and individuals who qualify based on age (65+). According to the most recent data available – 2021 – the aged 65+ group accounted for 10 percent of beneficiaries and 20 percent of spending (see Figure 1).
Within the Age 65+ group, Medicaid beneficiaries can be classified as “categorically needy” and “medically needy.” As shown in Figure 2, most Medicaid beneficiaries are enrolled through categorically needy pathways – SSI, Special Income Limit, or Poverty Related.
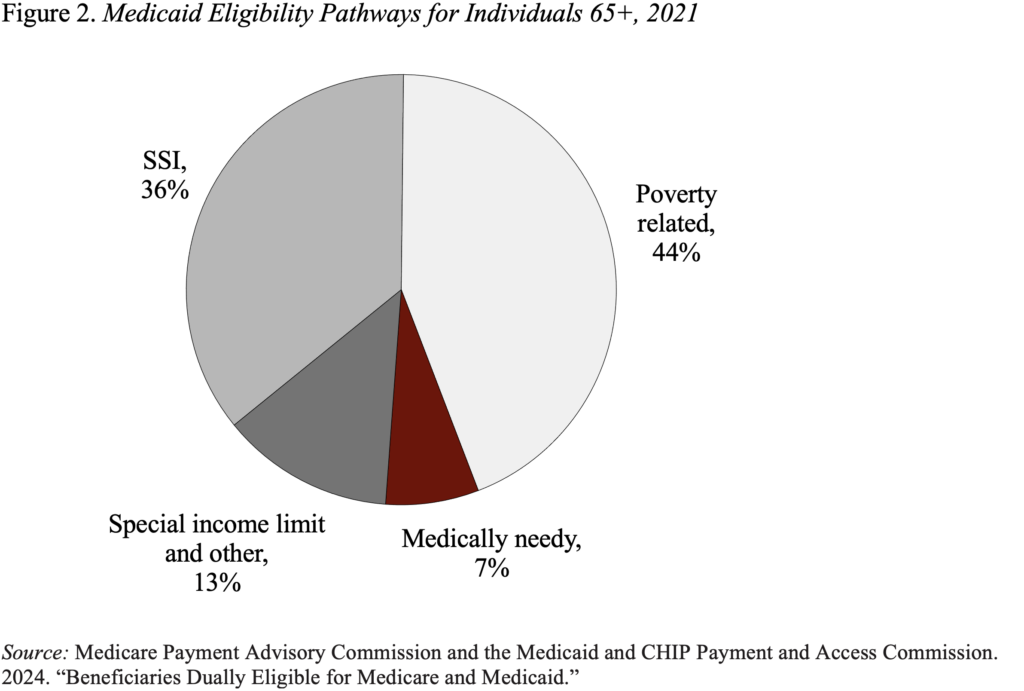
Medicaid provides two major types of benefits for those 65+. The first – for both those eligible through SSI and the poverty-related paths – is Medicare Savings Programs to cover some or all of their Medicare out-of-pocket costs. In addition,states are allowed to offer coverage specifically for people who need long-term services and supports, including nursing home care. One pathway to these benefits – offered by 42 states – is the “special income rule,” which allows individuals with income up to 300 percent of the SSI limits to qualify for benefits. In 2004, the maximum monthly SSI benefit is $943 per month for an individual and $1,415 for a couple, which is 75 percent of the federal poverty level. SSI beneficiaries are also subject to an asset limit of $2,000 for an individual and $3,000 for a couple.
Some states also extend Medicaid to “medically needy” individuals. Recipients must again have assets below limits that vary by state but, under the basic rules, are generally similar to the SSI asset limits. The income test, however, is income net of out-of-pocket medical expenses. Not all states offer this pathway, and medically needy individuals account for only 7 percent of Medicaid beneficiaries ages 65+.
To get some idea of the importance of Medicaid to retirees, Table 1 compares enrollees and expenditures for those 65+ under both Medicaid and Medicare. In terms of both metrics, Medicaid accounts for 16-17 percent of the Medicare figure.

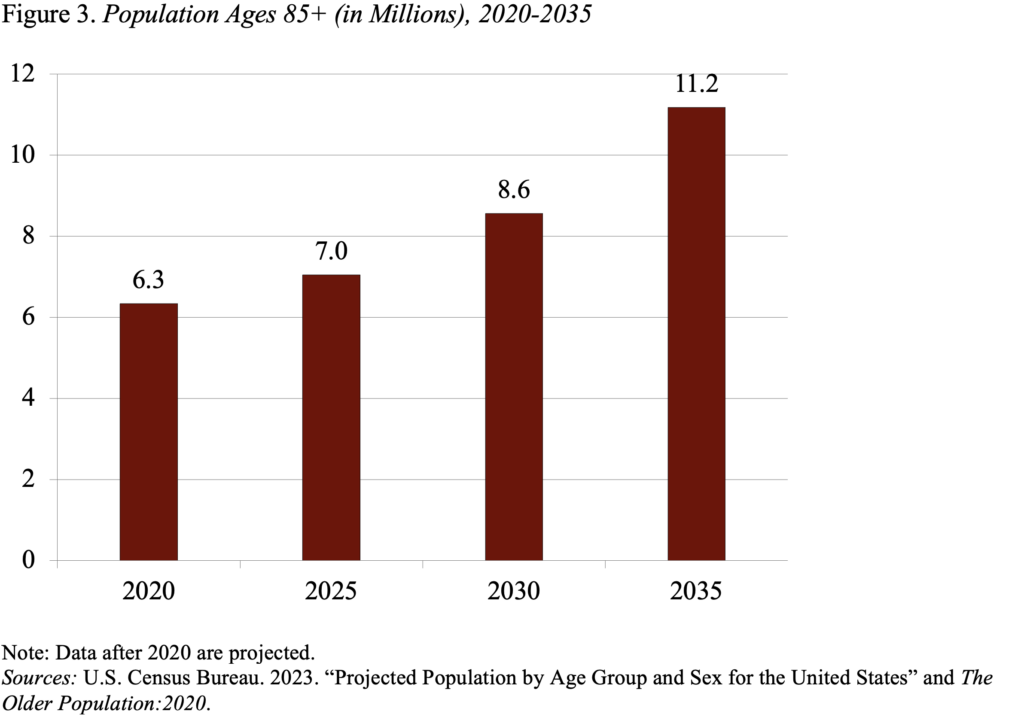
The more important question is what does future Medicaid spending look like, given that the number of people 85+ – a group with substantial needs for long-term care – is projected to increase from about 7 million today to 11 million in 2035 (see Figure 3).
The Congressional Budget Office projects that Medicaid – unlike Medicare – is scheduled to hold steady at 10 percent of non-interest federal spending (see Figure 4). For those 65+, it projects only a 1-million increase in enrollment compared to the 4-million increase for those 85+ and only a relatively modest increase in costs per enrollee – perhaps reflecting the saving on room and board as care moves from nursing facilities to individuals’ homes.
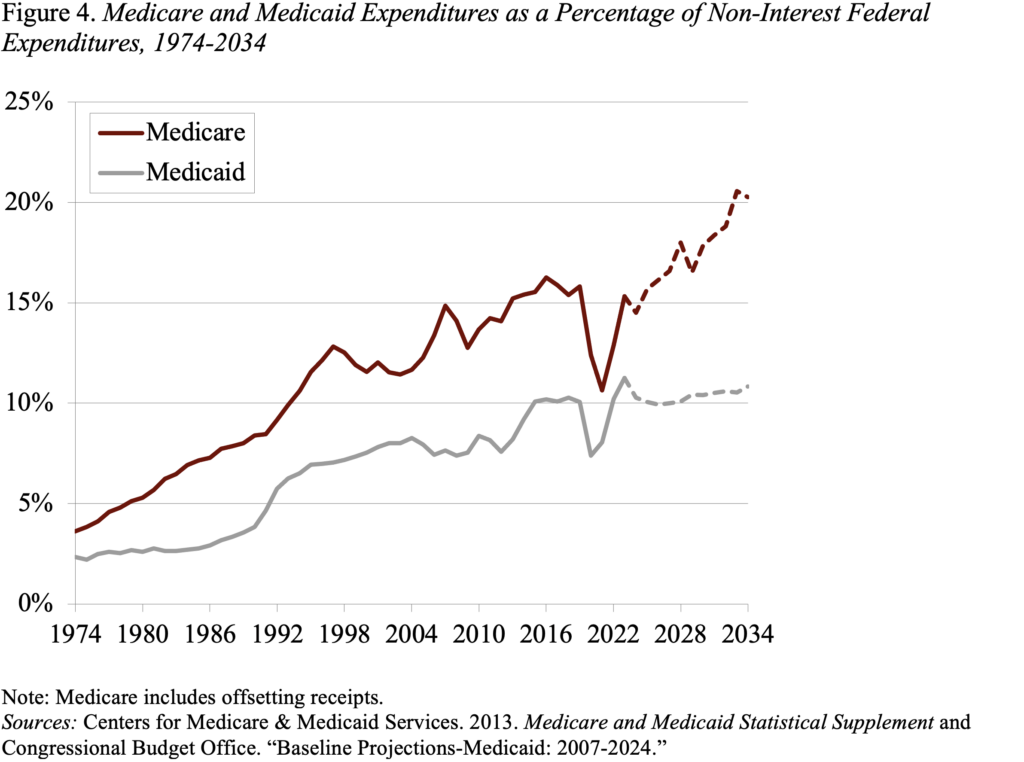
The bottom line, however, is that, despite the aging of the population, Medicaid is not projected to play a larger role in the future than it does today. The flipside of fiscal restraint may be unmet needs or a larger burden on families.


