
Social Security’s COLA: Let’s Not Mess with the Index

Alicia H. Munnell is a columnist for MarketWatch and senior advisor of the Center for Retirement Research at Boston College.
The current index is a good compromise.
It’s “Social Security COLA-speculation” season, and with it comes the annual controversy about whether the government is using the right index to adjust benefits. I would argue that the current index is good enough; it can easily be viewed as a compromise between the two major alternatives – the CPI-E, which reflects the spending of the older population and rises faster, and the Chained CPI, which allows for more substitution and rises more slowly.
The government currently adjusts Social Security benefits to keep pace with the Consumer Price Index for Urban Wage Earners and Clerical Workers (CPI-W). This index, which covers about 29 percent of the population, was the only one available when the Social Security COLA was first introduced in 1972. In 1978, the Bureau of Labor Statistics expanded the sample to all urban residents and created the CPI-U, which covers about 93 percent of the population, including most retirees. Despite the broader coverage and the prominence given the CPI-U in the monthly inflation report, the government has stayed with the CPI-W for the Social Security COLA – most likely because the two indices track each other very closely.
For decades critics have argued that the bundle of goods in the CPI-W does not represent the spending patterns of retirees and therefore understates the inflation actually experienced by older Americans. More specifically, older people spend more on health care than the young and health care prices generally rise faster than other goods, so the CPI-W understates the increase in the cost of living for retirees. In response, in 1988, the BLS introduced the CPI-E, which reflects the spending patterns of persons 62 and over.
Economists, on the other hand, argue that the current CPI overstates inflation, because it does not account for how people change their buying habits in response to a price increase. The theory is that by shifting to a close substitute product or service, people can lessen the increase in their cost of living and be just as happy. Since January 1999, a geometric mean formula has allowed for modest substitution within the 211 item categories (which, combined with 38 geographic areas, total 8,018 basic indexes). But it did not allow for substitution across item categories, such as pork and beef. The “chained CPI” reflects shifts in buying patterns that occur when the price of pork rises and the price of beef does not. In 2018, Congress permanently switched the inflation adjustment for federal income tax provisions to the chained CPI.
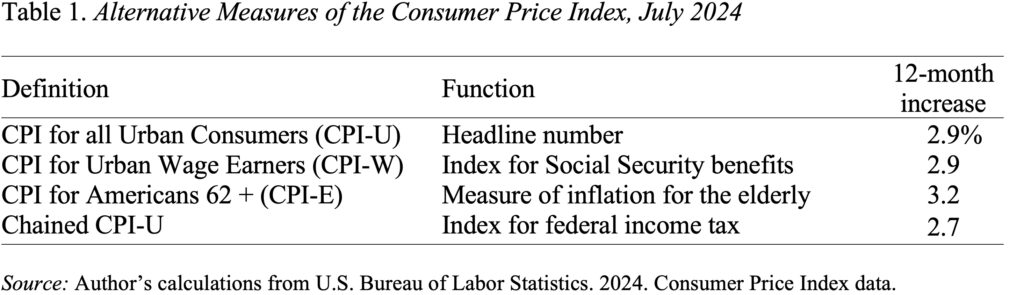
Table 1 shows how each of these measures of consumer prices have changed between July 2023 and July 2024. As expected, the CPI-W and CPI-U are very close (in fact, identical here), the CPI-E rose faster, and the chained CPI increased more slowly.
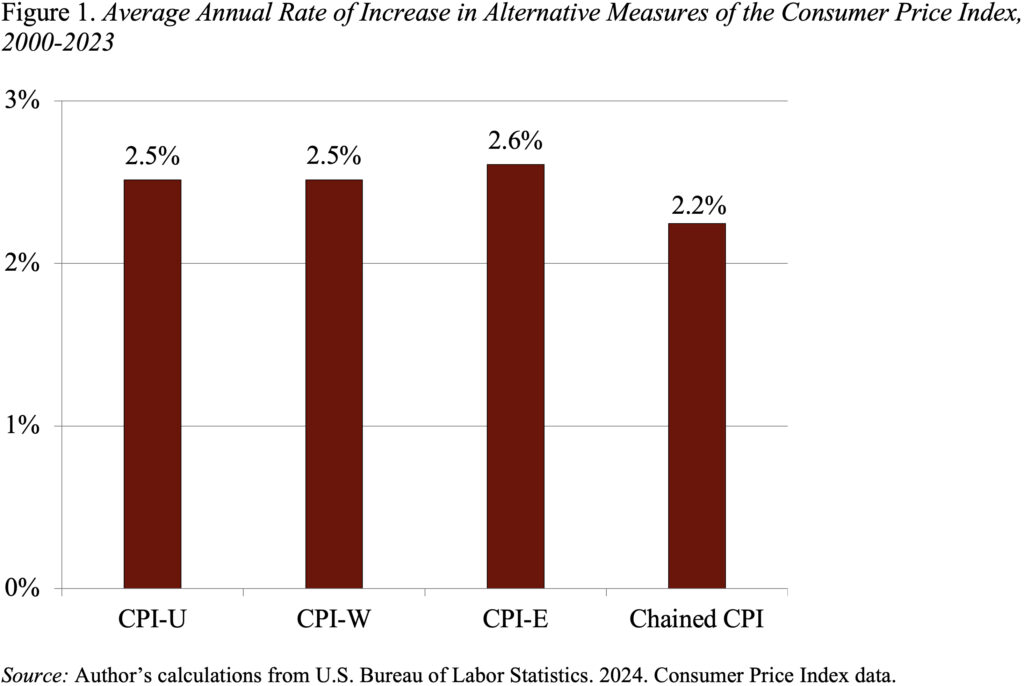
The same pattern is evident when looking at the same indices over a longer period (2000 – the first year for which “chained CPI” data are available – to 2023).
Shifting from the CPI-W to either the CPI-E or the chained CPI would have a noticeable effect on the cost of Social Security benefits over the next 75 years. In calculating these effects, the program’s actuaries assume that the CPI-E would increase the average COLA by 0.2 percentage points and that the chained CPI would reduce the average COLA by 0.3 percentage points. The projections show that moving to the CPI-E would increase the 75-year deficit by 12 percent, while shifting to the chained CPI would reduce the deficit by 17 percent.
One could argue that both the CPI-E and the chained CPI would provide a more accurate measure of the inflation faced by retirees. Thus, if we were starting with a price index that properly reflected the spending patterns of the elderly, then moving to a chained CPI might improve accuracy. (Although some experts question whether low-income elderly live too close to subsistence to change what they buy in response to price changes.) But given that we are not starting with the right measure, the case for switching to a chained CPI is weak. In view of the offsetting effects – a 0.3 percent overstatement of inflation due to not accounting for the substitution effect and the projected 0.2 percent understatement due to not reflecting the spending patterns of the elderly – the current method of adjusting benefits seems just about right.