The 2016 Social Security Trustees Report Contains No Surprises
Alicia H. Munnell is a columnist for MarketWatch and senior advisor of the Center for Retirement Research at Boston College.
Outlook virtually unchanged from last year.
The Social Security program faces a 75-year deficit of 2.66 percent of taxable payrolls – virtually unchanged from last year. Largely because of the Bipartisan Budget Act of 2015, the life of the Disability Insurance trust fund – which was scheduled for exhaustion in 2016 – has been extended by seven years. The combined Old-Age, Survivors and Disability Insurance (OASDI) trust funds continue to be scheduled for exhaustion in 2034.
What does a deficit of 2.66 percent of taxable payrolls mean? That figure means that if payroll taxes were raised immediately by 2.66 percentage points – 1.33 percentage points each for the employee and the employer – the government would be able to pay the current package of benefits for everyone who reaches retirement age at least through 2090. Any package, however, that restores balance only for the next 75 years will show a deficit in the following year, as the projection period picks up a year with a large negative balance. Realistically, eliminating the 75-year shortfall should probably be viewed as the first step toward long-run solvency.
What does exhaustion of the trust funds mean? It does not mean that Social Security is “bankrupt.” Payroll tax revenues keep rolling in and can cover about 75 percent of currently legislated benefits over the remainder of the projection period. Relying on only current tax revenues, however, means that the replacement rate – benefits relative to pre-retirement earnings – for the typical age-65 worker would drop by 25 percent.
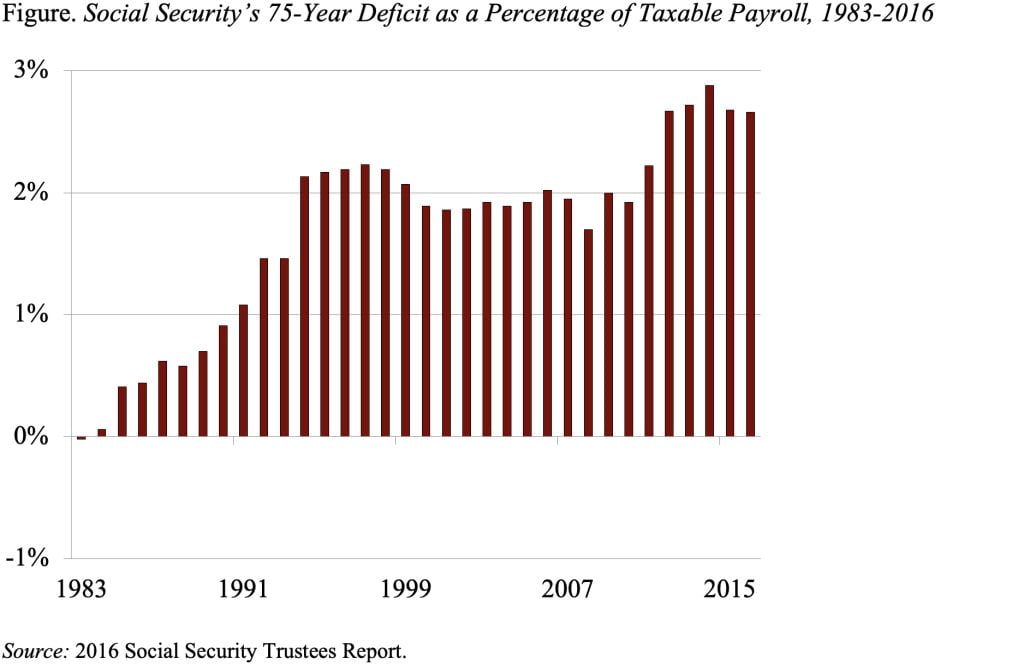
How did we get to a projected deficit in 2016 from a projected 75-year surplus in 1983 when Congress enacted the recommendations of the so-called Greenspan Commission? In fact, deficits appeared almost immediately after the 1983 legislation and increased markedly in the early 1990s (see Figure).

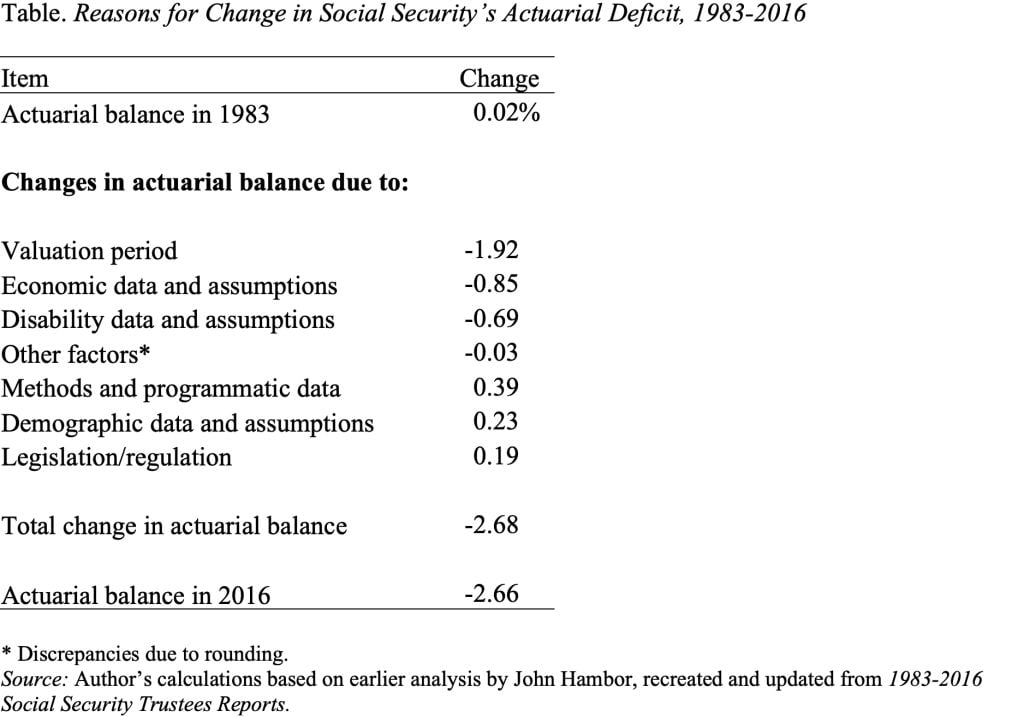
The reasons for the emerging deficits are shown in the Table. Leading the list is the impact of changing the valuation period. That is, the 1983 Report looked at the system’s finances over the period 1983-2057; the projection period for the 2016 Report is 2016-2090. As noted, each time the valuation period moves out one year, it picks up a year with a large negative balance. In addition, a worsening of economic assumptions – primarily a decline in assumed productivity growth and the impact of the Great Recession – has also contributed to the increase in the deficit. Another contributor has been increases in disability rolls.
Offsetting the negative factors has been a reduction in the actuarial deficit due to changes in demographic assumptions – primarily higher mortality for women – and methodological changes. Legislative and regulatory changes have also had a positive impact on the system’s finances. For example, the Affordable Care Act of 2010 was assumed to reduce Social Security’s 75-year deficit through an expected increase in taxable wages as a number of provisions slow the rate of growth in the cost of employer-sponsored group health insurance.

Regardless of how we got here; we are where we are. The bottom line is that Social Security faces a manageable financing shortfall over the next 75 years, which should be addressed soon to share the burden more equitably across cohorts, to restore confidence in the nation’s major retirement program, and to give people time to adjust to needed changes.


