
The Funded Status of Public Plans Keeps Improving – Albeit Modestly

The brief’s key findings are:
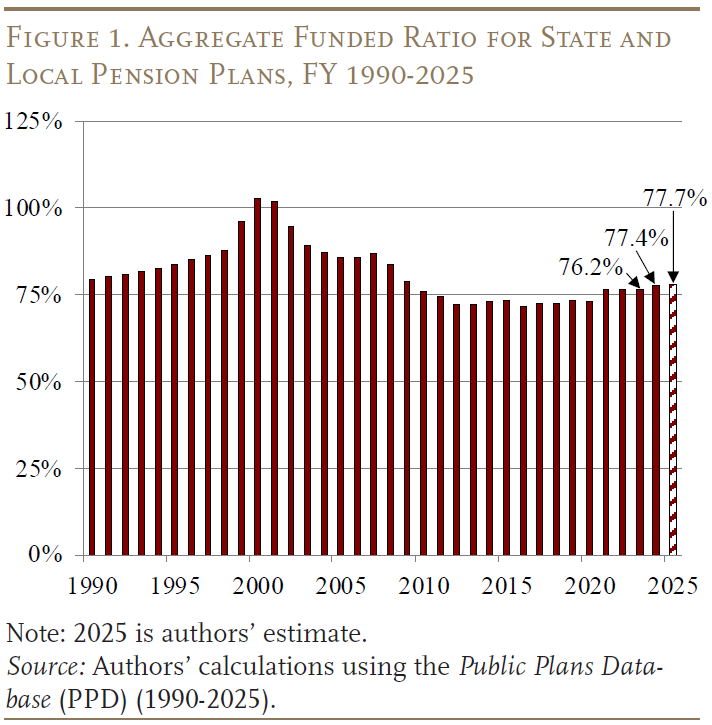
- The estimated ratio of pension assets to promised benefits has increased over the last two years by 1.5 percentage points to 77.7 percent.
- This increase reflects a boost in assets from higher contributions and solid returns, and the realization of benefit cuts scheduled for new employees.
- The impact of these positive fundamentals is partially offset by: 1) negative cash flows associated with maturing plans; and 2) basic growth in benefit liabilities.
Introduction
The projected funded ratio for state and local pension plans in FY 2025 is 77.7 percent, 1.5 percentage points higher than 2023 – the date of our last funding update. These gains seem quite modest, given that the S&P index increased more than 40 percent between June 2023 and June 2025. Moreover, as discussed below, state and local governments have become more diligent in their procedures for funding their plans, and have increasingly realized benefit cuts enacted in the wake of the Great Recession as “new hires” have replaced departing employees.
This brief reports the most recent estimates in the funded status of state and local pension plans. The discussion proceeds as follows. The first section shows that over the two-year period of FY 2024 and FY 2025, the funded ratio increased from 76.2 percent to an estimated 77.7 percent. The second section describes the positive trend in the funding process, such as the adoption of more realistic estimates of the actuarially required contribution and a continued increase in the likelihood of making that contribution. The third section investigates the cost side of the equation, which shows how the increasing share of new hires – and the benefit cuts associated with this group – has checked the growth in liabilities. The fourth section explores why, despite a lot of positive developments, the gains in the funded ratio have been so modest.
The final section concludes that the gradual improvement in the funded status of state and local pensions reflects gains in the fundamentals as a result of policies to both improve plan funding and slow the growth in liabilities. But, even if governments continue to contribute the full actuarially determined contribution and investment performance remains mostly positive, improvements in funded ratios due to two persistent features of pension funds will be modest – the annual growth of liabilities and the impact of negative cash flows, associated with mature plans, on accumulated assets.
Funded Status of Public Plans
As of July 2025, just over half of the roughly 200 major state and local pension plans in the Public Plans Database (PPD) had reported their 2024 funded levels. None had reported 2025 levels. To describe the current status of public plans, this analysis makes plan-by-plan projections using data provided in each plan’s most recently released reports. Based on the 2024 data and projections for 2025, the aggregate actuarial funded ratio increased about 1 percentage point in 2024 and about half a percentage point in 2025 (see Figure 1). Thus, despite the recent growth in the stock market, pension funded ratios have increased only slightly over the last two-year period.
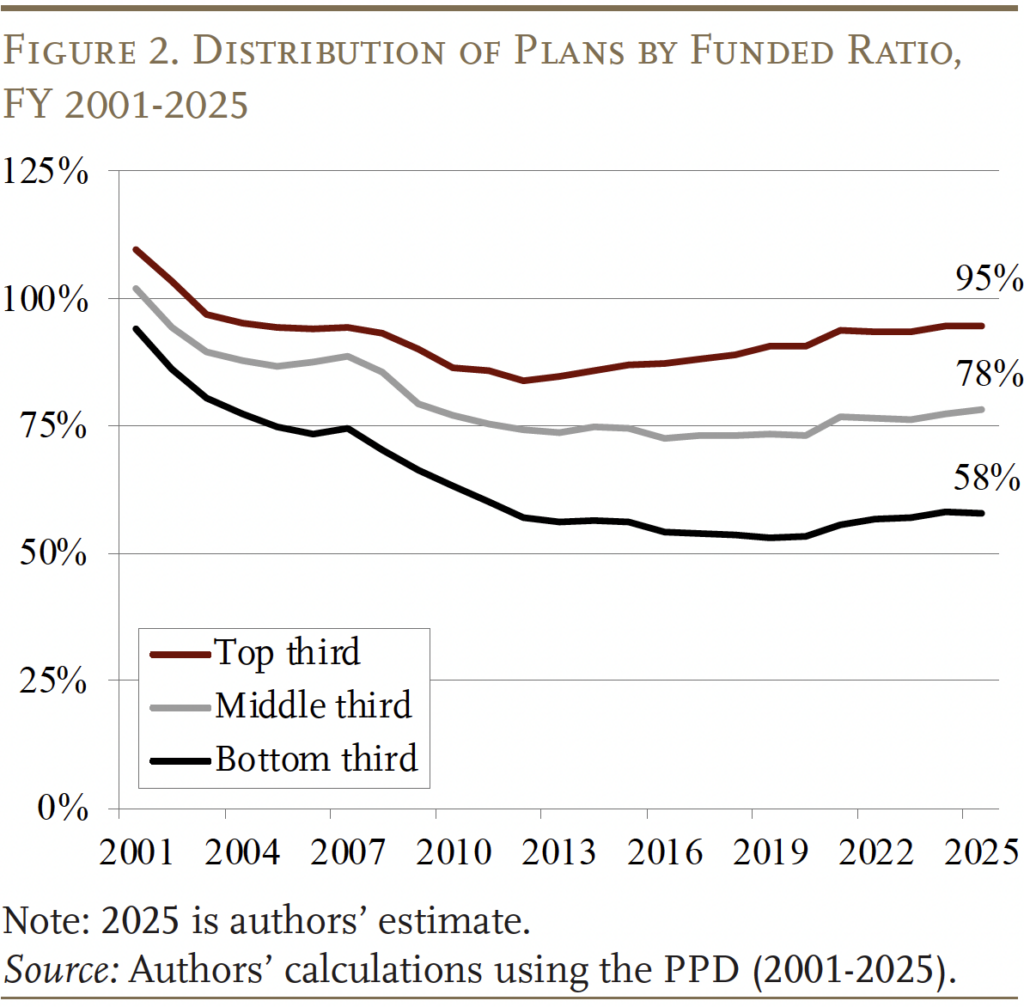
While the aggregate funded ratio provides a useful measure of the public pension landscape at large, it can also obscure variations in funding at the plan level. Figure 2 separates the plans in the PPD into thirds based on their current actuarial funded status and tracks the aggregate funded status for each group from 2001 to 2025. Importantly, each group has experienced a steady increase in funded ratio since 2020, with the aggregate 2025 funded ratio being 58 percent for the bottom third, 78 percent for the middle third, and 95 percent for the top third.
The general improvement in funded status can be ascribed to two positive developments: 1) plans are become more realistic about defining how much they need to contribute and more consistent in paying that amount; and 2) costs have been held in check by reforms adopted in the wake of the Great Recession, as well as the slow growth in employment.
Actuarial Contributions Have Become More Reliable
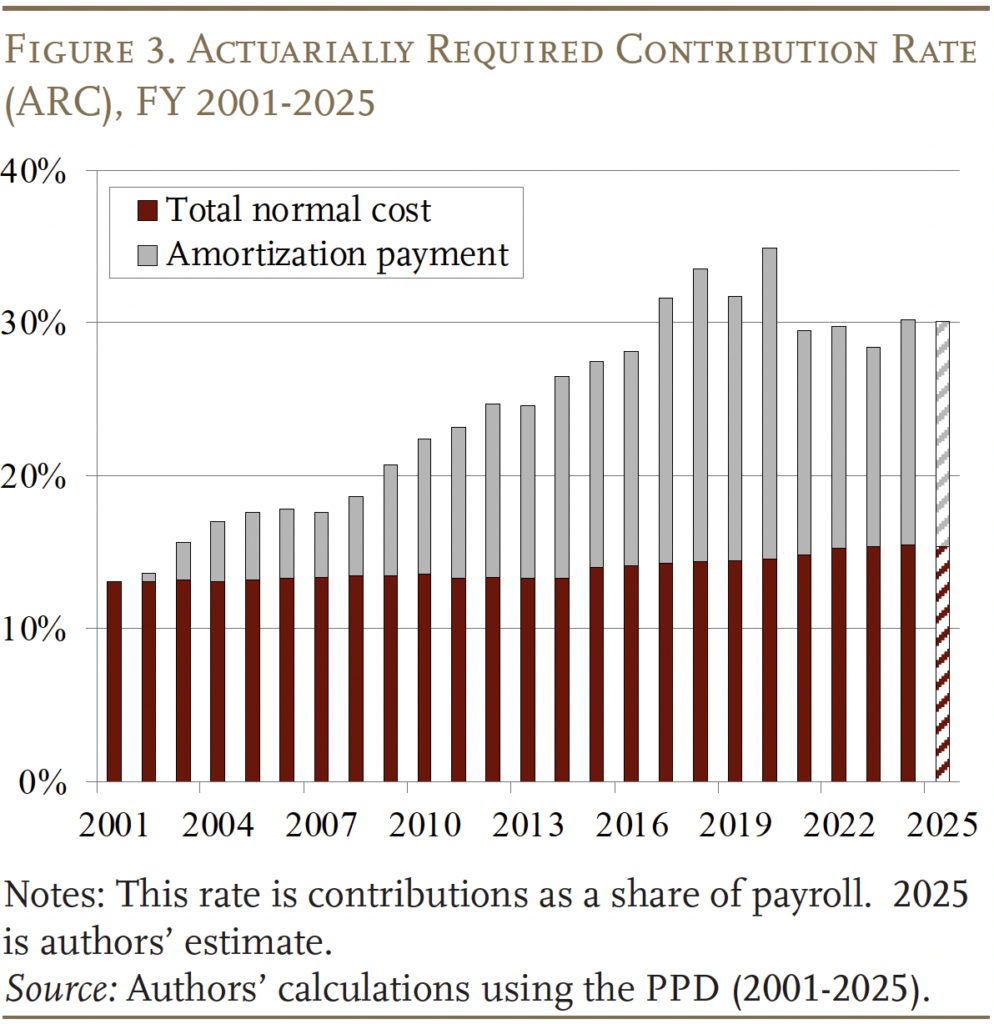
The actuarially required employer contribution rate – the rate required to keep the plan on a steady path toward full funding – appears to have stabilized around 30 percent of payrolls (see Figure 3). Roughly half of these payments cover the ongoing or “normal” cost of the program and the other half goes to paying down the unfunded liability.
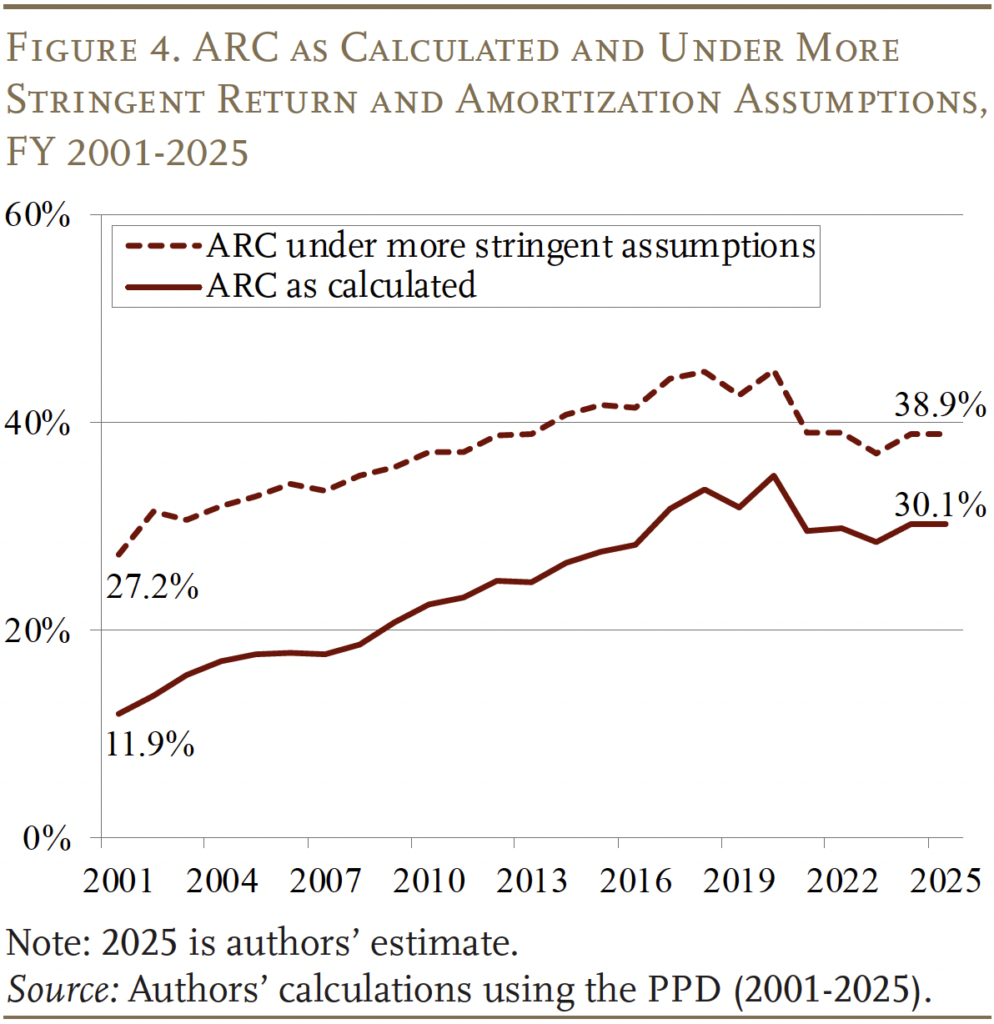
Many pension researchers (and some practitioners) have questioned the adequacy of actuarially required contributions as they are commonly calculated. Critics highlight the use of overly optimistic investment return assumptions and relatively lax methods for amortizing the unfunded liability. If investment return assumptions more closely reflected actual performance since 2001, and plans adopted more stringent approaches to amortizing their unfunded liabilities, the average required contribution in 2025 would have been 39 percent of payroll instead of 30 percent. It is important to note, however, the difference between the actual required contribution and that under more stringent assumptions has narrowed over time (see Figure 4). Two factors have contributed to the convergence of these measures – a gradual lowering of the assumed rate of return from 8.0 percent in 2001 to 6.9 percent in 2024 and a more rapid amortization of the plans’ unfunded liabilities.
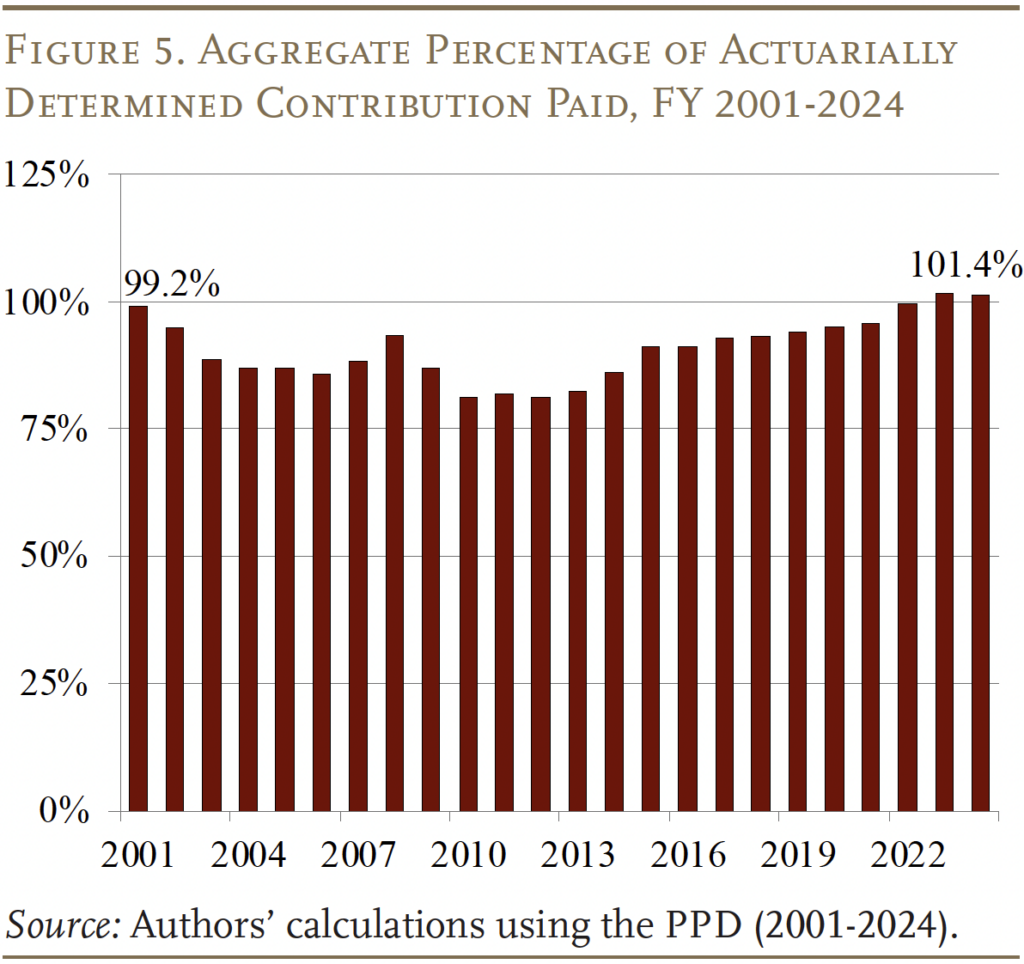
In addition to the required contribution becoming more realistic, the aggregate percentage paid now exceeds 100 percent – above the level before the bursting of the dotcom bubble at the turn of the century (see Figure 5). And, at this point, more than 80 percent of plans are receiving the full actuarially determined contribution.
Benefit Cuts Have Increasingly Taken Hold
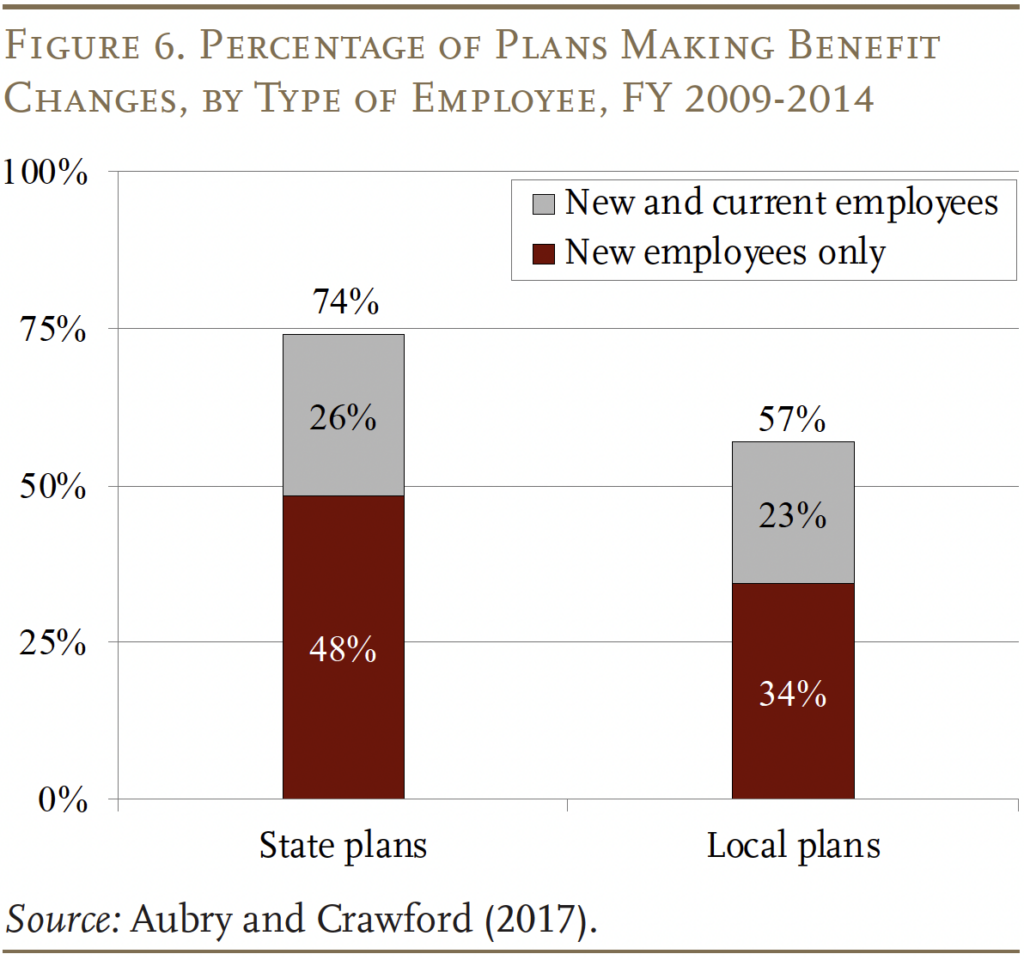
At the same time that plans have become more responsible on the contribution side, many of the benefit cuts enacted in the wake of the Great Recession have taken hold as new hires replace departing employees. Between 2009-2014, 74 percent of state plans and 57 percent of local plans made some type of reduction to their pension benefits. Given that many states have legal protections that constrain their ability to alter benefits, the majority of plans reduced benefits only for new employees, although about one-quarter also cut benefits for current employees (see Figure 6).
The most common benefit reductions for current employees were increases in their pension contributions and reductions to the cost-of-living adjustment (COLA). While the increase in employee contributions does reduce an employee’s net pension benefit, the prevalence of the reform suggested that it is viewed differently than direct reductions to benefits. In terms of the COLA, our prior research revealed that, in many states, COLAs were not viewed as “core” benefits and have less protection under the law. As a result, they appear easier to cut than the benefit factor, the final average salary period, or retirement age and tenure provisions.1
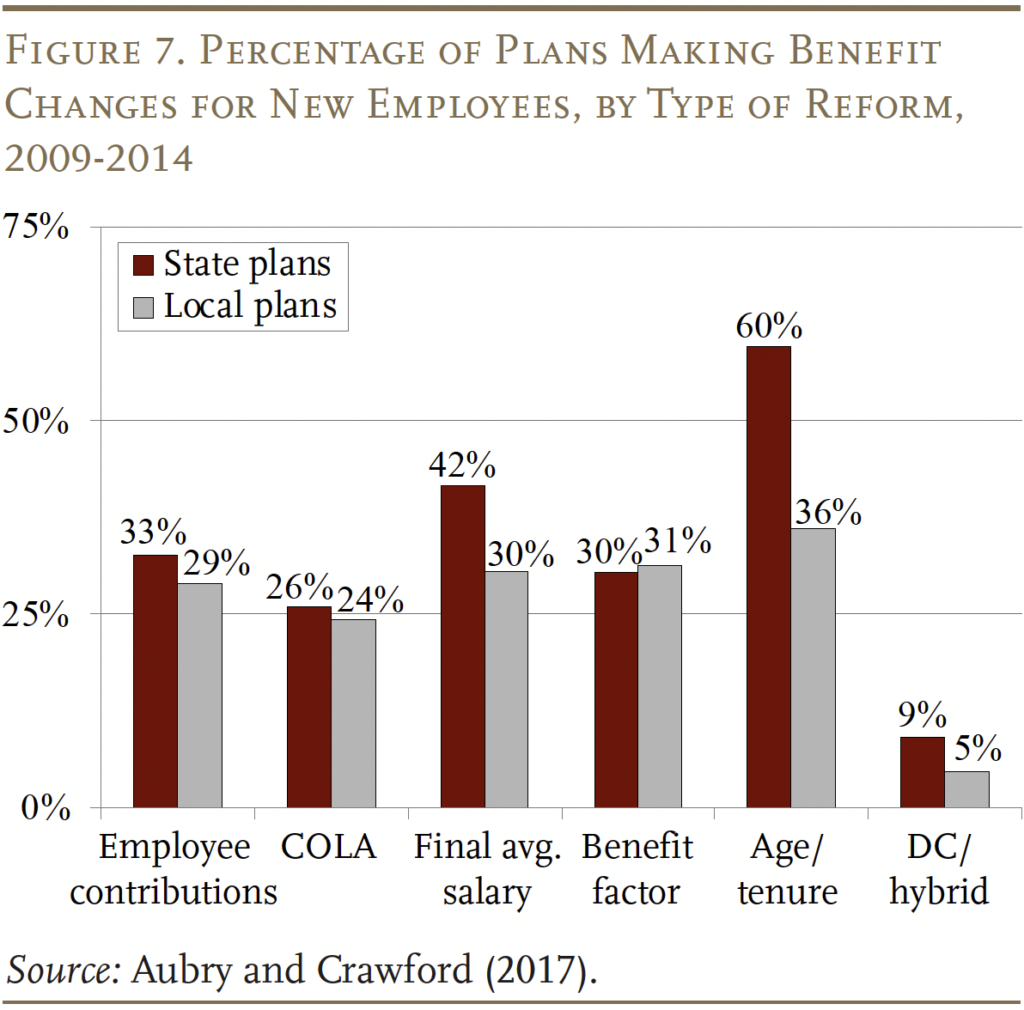
For new employees, reductions to core benefits were much more common (see Figure 7). The most common change was to increase the age and tenure required to claim benefits. The next most prevalent changes were to lengthen the period used to calculate final average salary, increase employee contributions, and reduce the benefit factor. Interestingly, local plans are much less likely to increase age and tenure requirements than state plans. A possible explanation is that most police and fire plans are administered at the local level, and their employee unions are particularly sensitive to altering retirement ages.
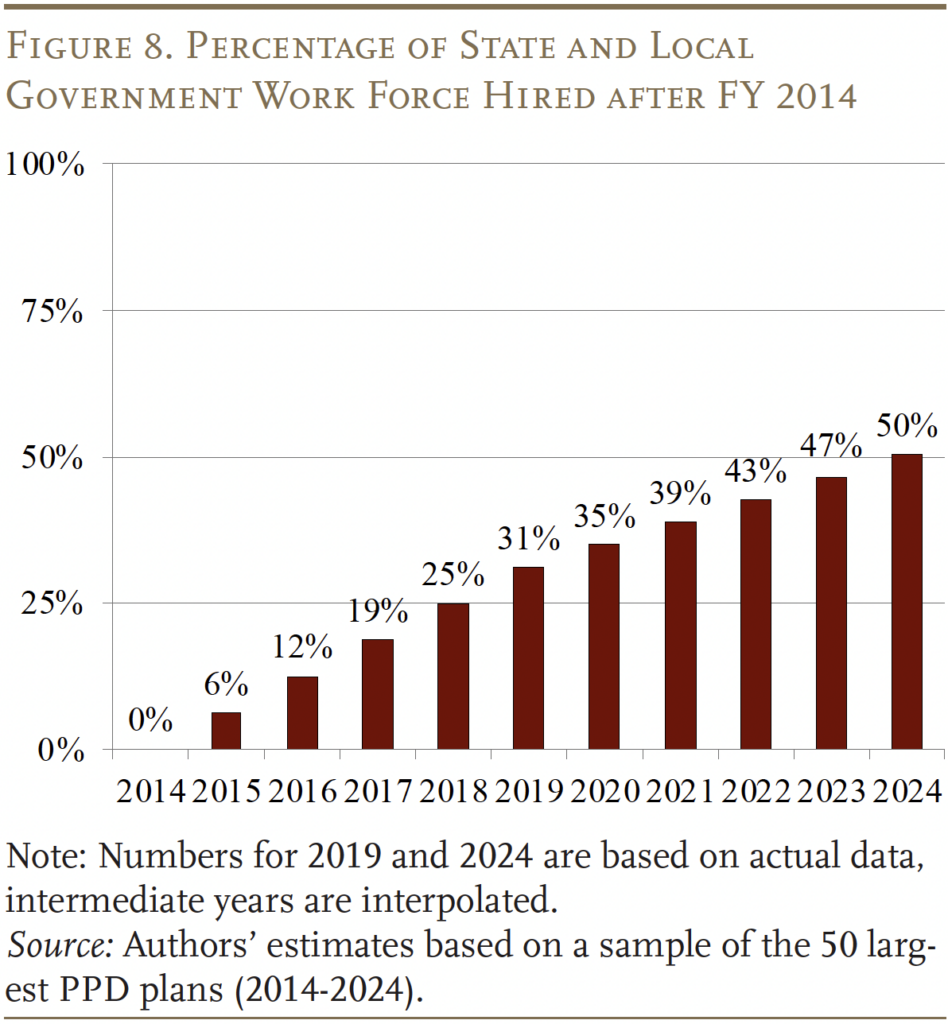
The impact of cuts for new hires depends crucially on the turnover in public plans. Since 2014, new hires – defined as employees hired after 2014 – as a share of the workforce have gone from zero to 50 percent (see Figure 8). As the cuts made in the wake of the Great Recession take hold, the cost per employee declines.
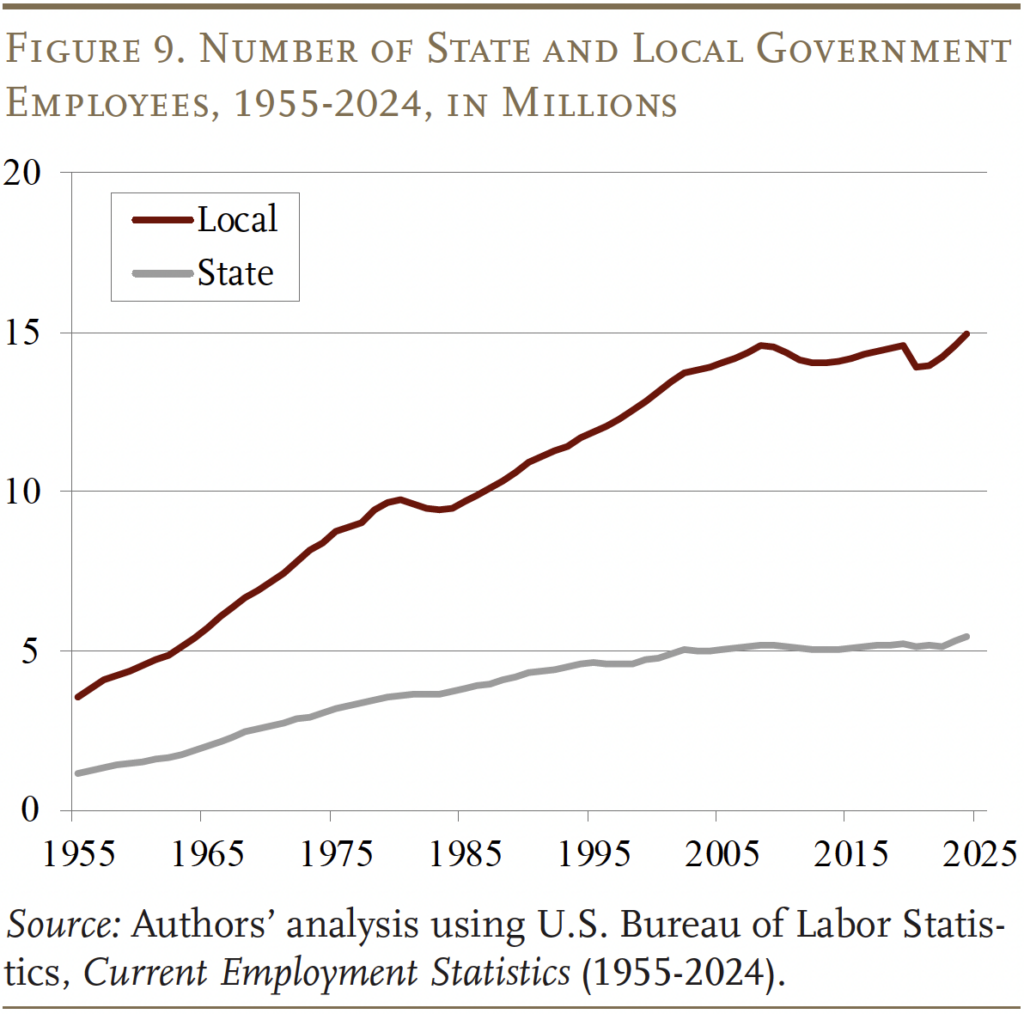
At the same time, employment in the public sector has stabilized (see Figure 9).
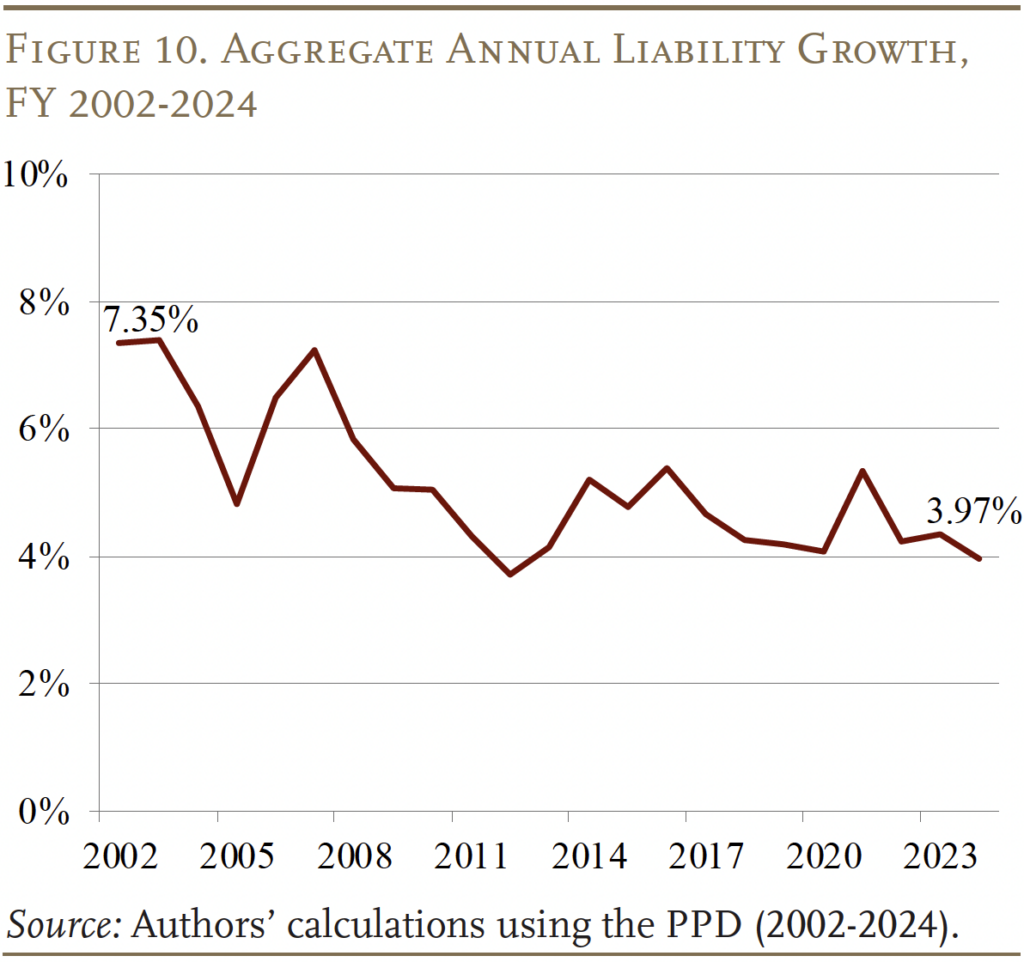
The combination of benefit reductions and stabilizing employment has substantially slowed the annual growth of liabilities. Today, liabilities are increasing at about 4 percent each year – roughly half the rate seen at the turn of the century (see Figure 10).
Why Was Improvement in Funding So Modest?
So, the question is why has the funded ratio grown so modestly since FY 2023 when the stock market has risen over 40 percent, plans have been making their full contributions, and liability growth has stabilized at a relatively low clip? The answer is that changes in the funded ratio are determined by the growth in assets relative to the growth in liabilities. As shown above, liabilities have been increasing at their relatively low stabilized rate of about 4 percent since 2023 – resulting in 8-percent growth in liabilities over the last two years. So, for the funded ratio to improve over that period, assets must grow by more than 8 percent.
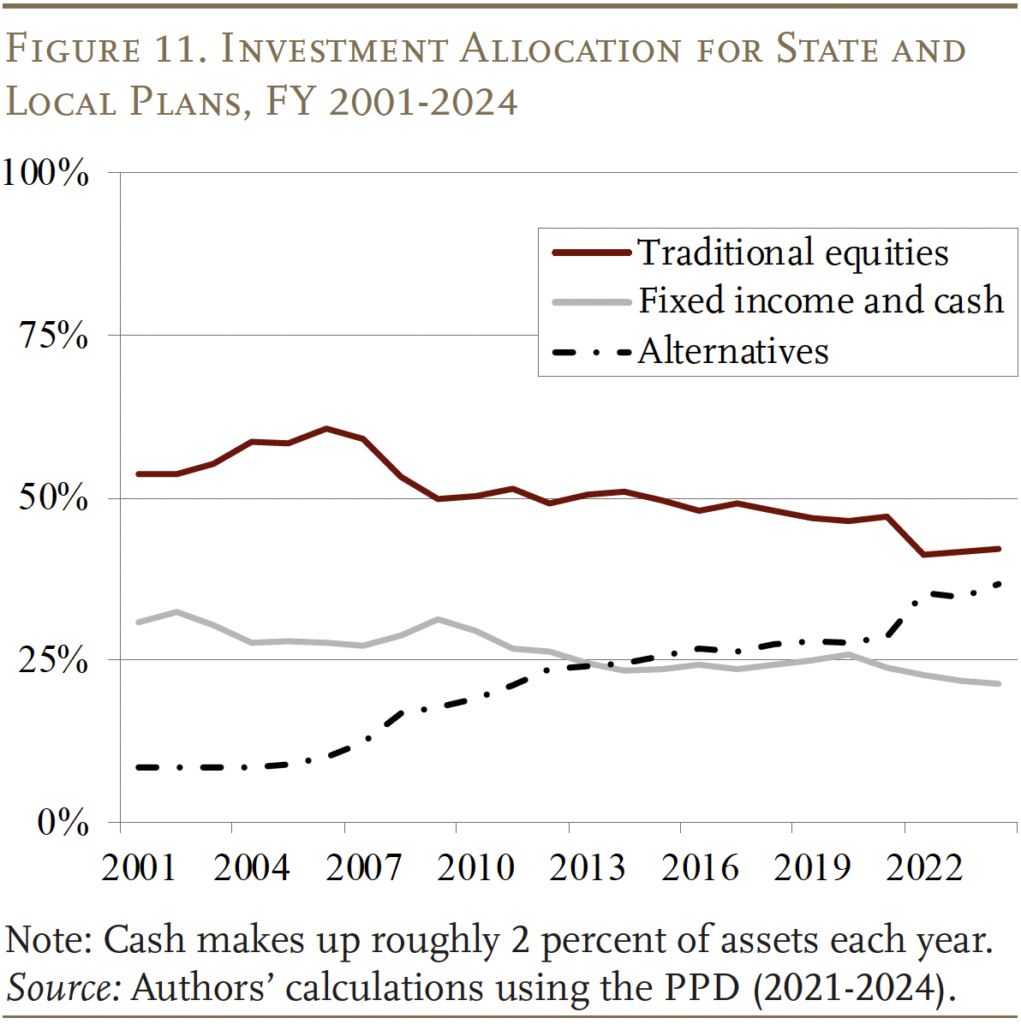
The change in assets is attributable to two components: investment returns and cash flows (contributions minus benefits). Even though the stock market grew by more than 40 percent from 2023 to 2025, pension funds only earned a 15-percent return on their assets over that period, because: 1) about one-quarter of assets are invested in fixed income securities; and 2) a sizeable share is in alternative assets such as real estate that have struggled in the higher interest-rate environment (see Figure 11). While concerns remain regarding the long-term utility of the pension fund’s complex investment approach, their investment performance over the last two years has both exceeded their expected return and been roughly comparable to the performance of a simple 60/40 stock and bond index.2
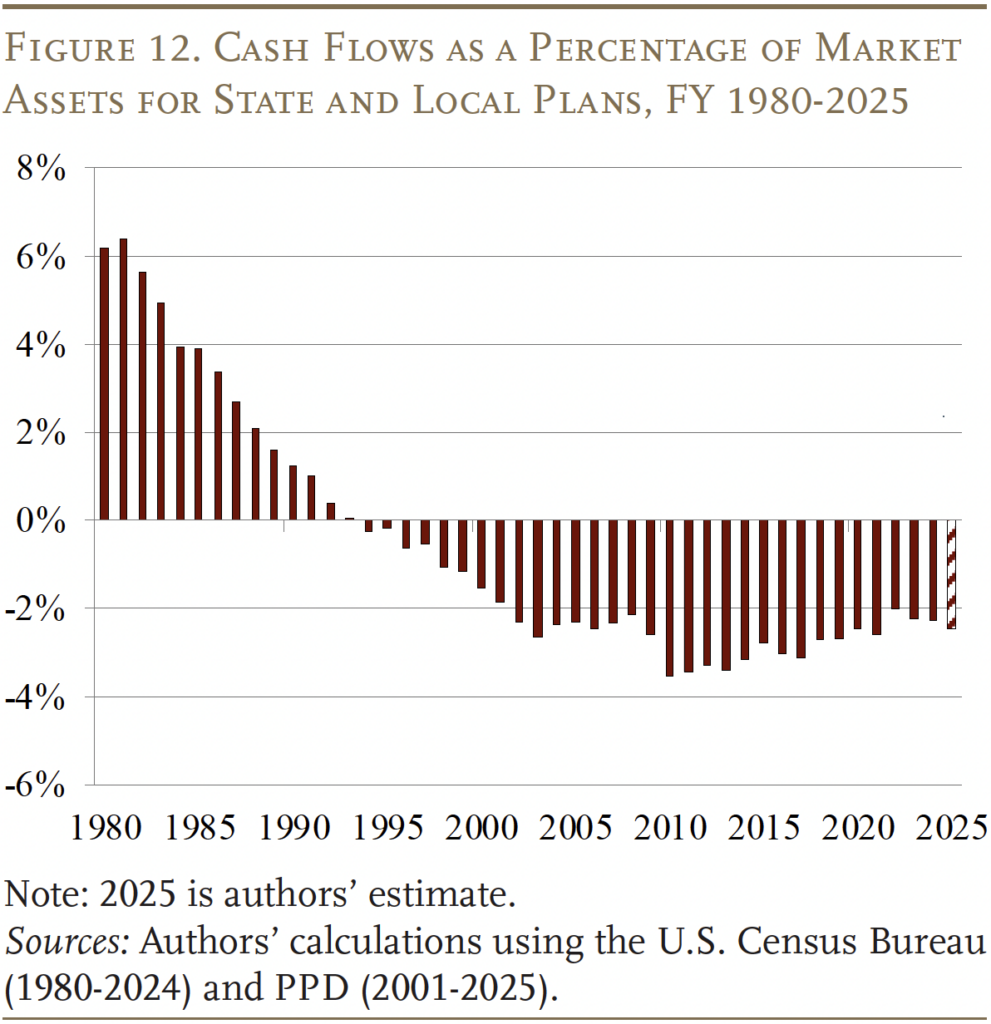
Even though pension funds’ recent investment performance has been adequate, most public sector retirement systems are extremely mature, which means they face significant benefit payments to retirees each year. So, despite the fact that pension funds receive the full actuarially required contribution, they still experience negative net cash flows of about 2 percent of assets each year (see Figure 12). Over the two-year period since FY 2023, these negative cash flows reduce the growth of assets from 15 percent to 11 percent.
In the end, the roughly 11-percent growth in assets since 2023 was higher than the roughly 8-percent growth in liabilities over that same period, and sufficient to increase the funded ratio by 1.5 percentage points – from 76.2 to 77.7 percent.
Conclusion
The gradual improvement in the funded status of state and local pensions reflects gains in the fundamentals. These gains include more stringent calculations of actuarially required contributions and the increased likelihood of actually making the payment, as well as the ongoing effect of benefit cuts introduced after the Great Recession and the implementation of further cuts as new hires replace old employees. But, even if governments continue to contribute the full actuarially required contribution and investment performance remains mostly positive, we should only anticipate incremental improvements in funded ratios due to two persistent features of pension funds – the annual growth of liabilities and the impact of negative cash flows, associated with mature plans, on accumulated assets.
References
Aubry, Jean-Pierre and Caroline V. Crawford. 2017. “State and Local Pension Reform Since the Financial Crisis.” State and Local Plans Issue in Brief 54. Chestnut Hill, MA: Center for Retirement Research at Boston College.
Aubry, Jean-Pierre and Yimeng Yin. 2024. “How Do Public Pension Plan Returns Compare to Simple Index Investing?” Issue in Brief 24-13. Chestnut Hill, MA: Center for Retirement Research at Boston College.
Munnell, Alicia H., Jean-Pierre Aubry, and Mark Cafarelli. 2015. “How Will Longer Lifespans Affect State and Local Pension Funding?” State and Local Plans Issue in Brief 43. Chestnut Hill, MA: Center for Retirement Research at Boston College.
Public Plans Database. 1990-2025. Center for Retirement Research at Boston College, MissionSquare Research Institute, the National Association of State Retirement Administrators, and the Government Finance Officers Association.
U.S. Bureau of Labor Statistics. Current Employment Statistics, 1955-2024. Washington, DC.
U.S. Census Bureau. Annual Survey of Public Pensions, 1980-2024. Washington, DC.
Endnotes
- Munnell, Aubry, and Cafarelli (2016). ↩︎
- Given the relatively complex investment approach that is typical of pension funds, it is interesting to note that they have not outperformed a simple 60/40 stock and bond index portfolio over the long term – and have significantly underperformed a 60/40 portfolio since the Great Recession (see Aubry and Yin 2024). ↩︎


Aubry, Jean-Pierre and Alicia H. Munnell. 2025. "The Funded Status of Public Plans Keeps Improving – Albeit Modestly" Issue in Brief 25-15. Chestnut Hill, MA: Center for Retirement Research at Boston College.