
The Importance of Medicaid for Older Americans

The brief’s key findings are:
- Most people think of Medicare – not Medicaid – as the health program for older Americans, but Medicare does not cover long-term care services (LTSS).
- Medicaid does pay for LTSS for those with low incomes and also helps cover their Medicare out-of-pocket costs.
- As a result, those ages 65+ account for 10 percent of total Medicaid enrollees and 20 percent of its spending.
- Looking ahead, Medicaid may not keep pace with rising demand for LTSS, so a heavier burden may fall on family caregivers or more needs may go unmet.
Introduction
Most people think of Medicare – not Medicaid – when considering government health care for older Americans. However, Medicaid, the program that covers the medical expenses of the poor, spends over $132 billion a year – 20 percent of its budget – on individuals ages 65 and over. Elderly beneficiaries include both those with low incomes throughout their retirement and those who become “medically needy” – that is, satisfy Medicaid’s means tests after incurring high health care expenses.
This brief summarizes the nature and amount of Medicaid spending on Americans ages 65+ – that is, the population already receiving benefits under Medicare – documents how it has changed over time, and examines projections of future levels of spending and the implications for both government budgets and the well-being of older households.
The discussion proceeds as follows. The first section describes the origins and evolution of Medicaid and compares its beneficiaries to those covered by Medicare. The second section describes the pathways through which older Americans can access Medicaid benefits. The third section speculates about the future of Medicaid and the benefits available to older Americans going forward. The final section concludes that Medicaid is a crucial component of the nation’s health care system providing significant benefits for low- and middle-income elders, but government projections suggest that Medicaid outlays may not keep pace with the increasing long-term care needs of an aging population.
A Brief History of Medicaid
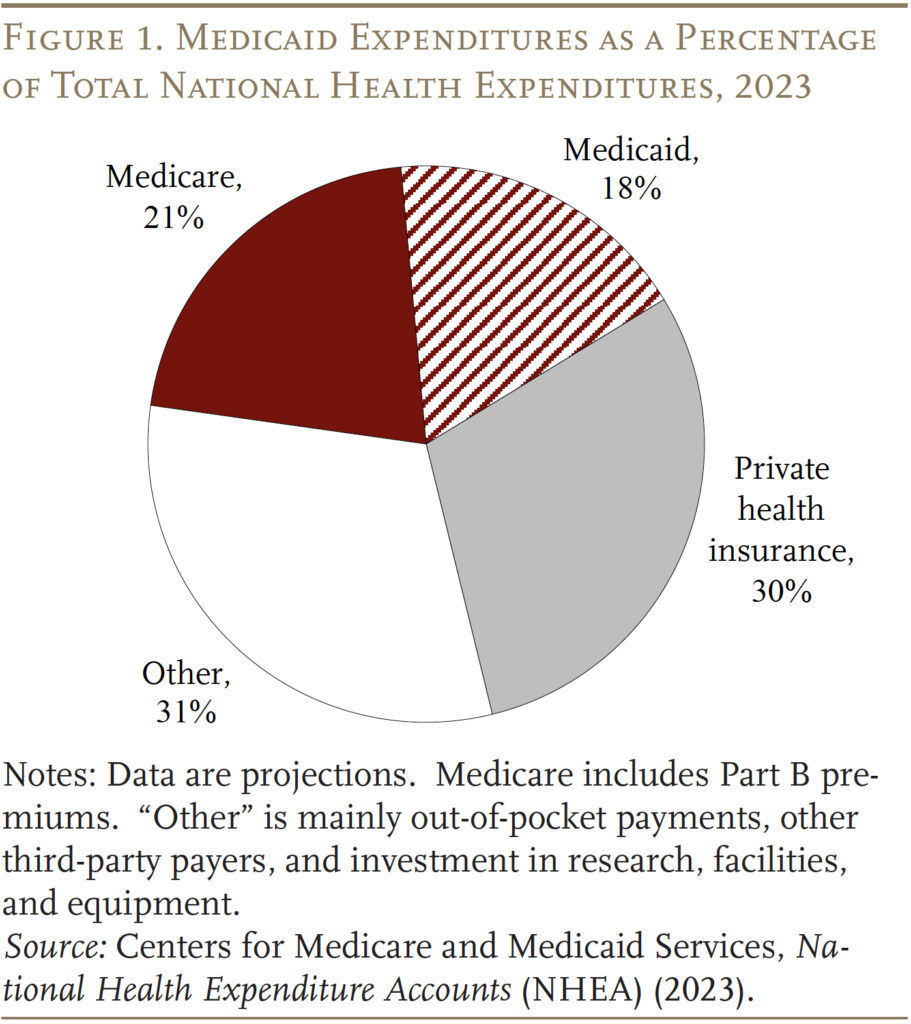
Medicaid was enacted in 1965 as part of the same law that created Medicare. While Medicare covers all persons 65 and older and people who receive federal disability insurance, Medicaid was designed to help low-income families who historically could not afford private health insurance and to provide long-term care services for the elderly poor. In 2023, Medicare and Medicaid spending together accounted for 39 percent of the nation’s total outlays for health care (see Figure 1).
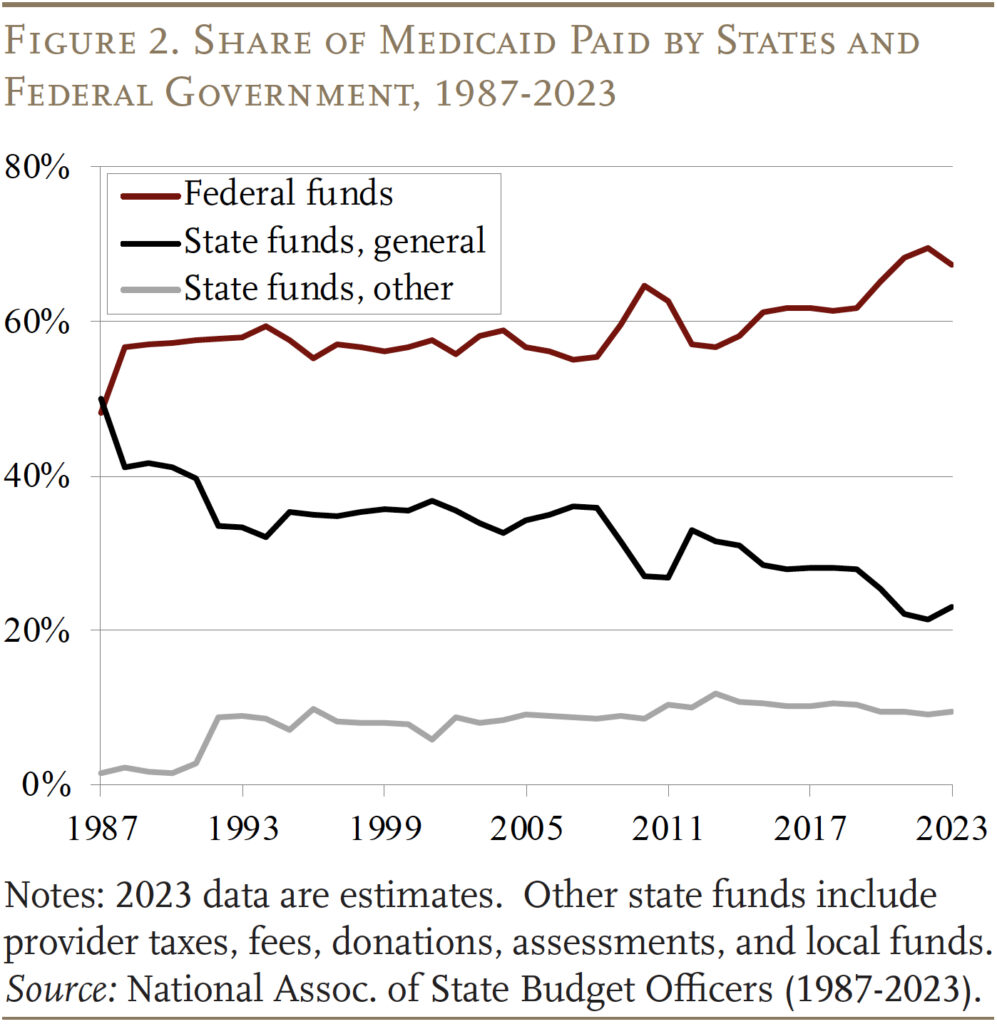
Medicaid is financed jointly by the federal government and the states. The federal government guarantees matching dollars without a cap for qualified services, based on a state’s income level. That is, the federal government provides higher reimbursement rates to states with lower per capita incomes, with the range varying from a floor of 50 percent to a ceiling of 83 percent.1 Historically the federal government has paid for 60 percent of total Medicaid costs, albeit this share spiked temporarily to 70 percent in 2022 due to legislation enacted during the pandemic (see Figure 2).
State participation in Medicaid is voluntary, but to qualify for matching funds states must follow broad federal rules for benefits and coverage. (By 1980, all states had opted in.) Medicaid coverage was historically tied to receipt of cash assistance – either through the former Aid to Families with Dependent Children (AFDC) program or the Supplemental Security Income (SSI) program, which provides benefits to children and adults with disabilities and to those ages 65 and over.2 Over time, Congress expanded federal minimum requirements for state participation and provided new coverage requirements and options for states, especially for children, pregnant women, and people with disabilities. In addition, states often provide coverage that exceeds the minimum levels set by Congress or federal rules.3
Moreover, in 2010, the Affordable Care Act expanded Medicaid to include non-elderly adults without dependent children, who had traditionally been excluded from coverage, with incomes up to 138 percent of the federal poverty line ($20,780 for an individual in 2024). While the Medicaid expansion was effectively optional, as of 2024, 41 states and Washington, DC have opted in. These states receive a higher federal match rate for those covered under this expanded eligibility option.
Finally, COVID-19 also had a big effect on Medicaid spending and enrollment. At the start of the pandemic, Congress required Medicaid programs to keep people continuously enrolled – rather than requiring reenrollment (generally annually) – in exchange for enhanced federal funding. As a result, enrollment grew substantially between 2019 and 2023. These provisions started to unwind in April 2023, which has reduced the Medicaid rolls by 13 million from the pandemic peak.4
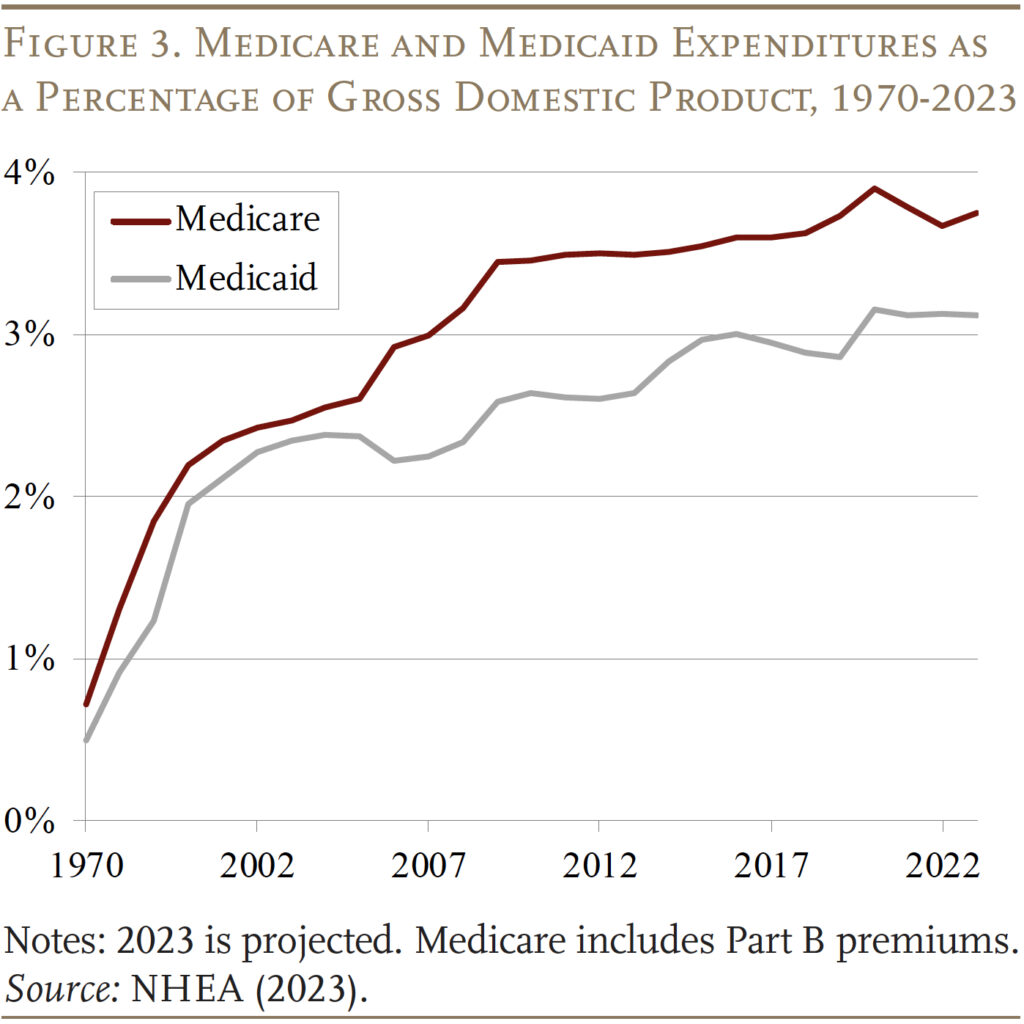
As a result of the expansion of the groups covered and rising health care costs, Medicaid expenditures have now grown to 3.1 percent of GDP, but growth has slowed since the 2010s. Medicaid expenditures are now well below Medicare expenditures, which began to rise sharply as the Baby Boom started to retire (see Figure 3).
Medicaid for “the Aged”
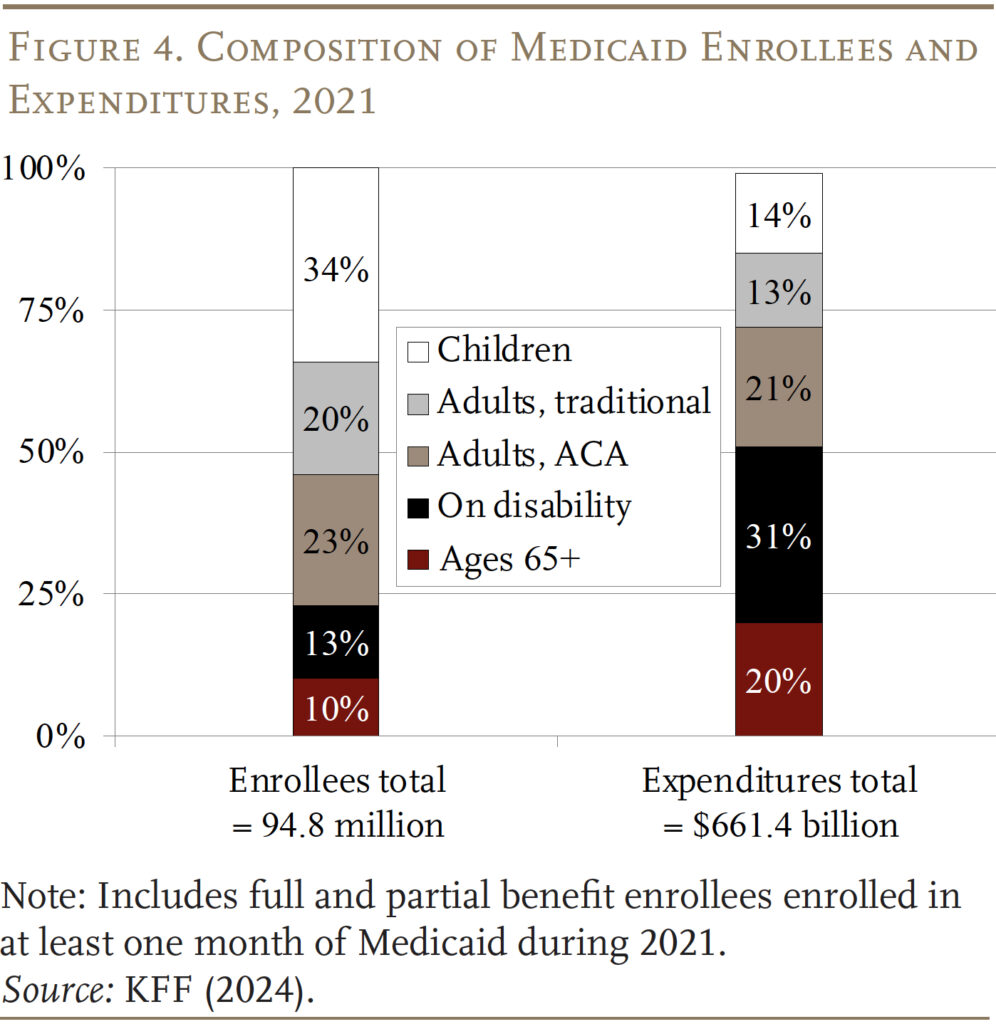
Medicaid provides benefits for five main groups of low-income individuals – children, adults (under 65) in families, adults (under 65) without children included under the Affordable Care Act (ACA), individuals with disabilities, and individuals who qualify based on age (65+). According to the most recent data available – 2021 – the aged 65+ group accounted for 10 percent of beneficiaries and 20 percent of spending (see Figure 4).
Within the Age 65+ group, Medicaid beneficiaries can be classified as “categorically needy” and “medically needy.” Most Medicaid beneficiaries are enrolled through categorically needy programs.5
Categorically Needy
SSI Participants. As noted above, historically, eligibility for Medicaid benefits has been tied to programs that provide cash benefits to low-income families. In the case of those 65+, the cash benefits have been provided by the SSI program. This pathway has declined in importance over time, however, since the SSI income and asset requirements have not been updated in decades. In 2024, the maximum monthly SSI benefit is $943 per month for an individual and $1,415 for a couple, which is 75 percent of the federal poverty level. SSI beneficiaries are also subject to an asset limit of $2,000 for an individual and $3,000 for a couple. Not surprisingly, the percentage of the 65+ population receiving SSI has dropped from 9.3 percent in 1974 to 3.7 percent in 2024. Currently, SSI participants account for only 36 percent of Medicaid 65+ beneficiaries (see Figure 5).
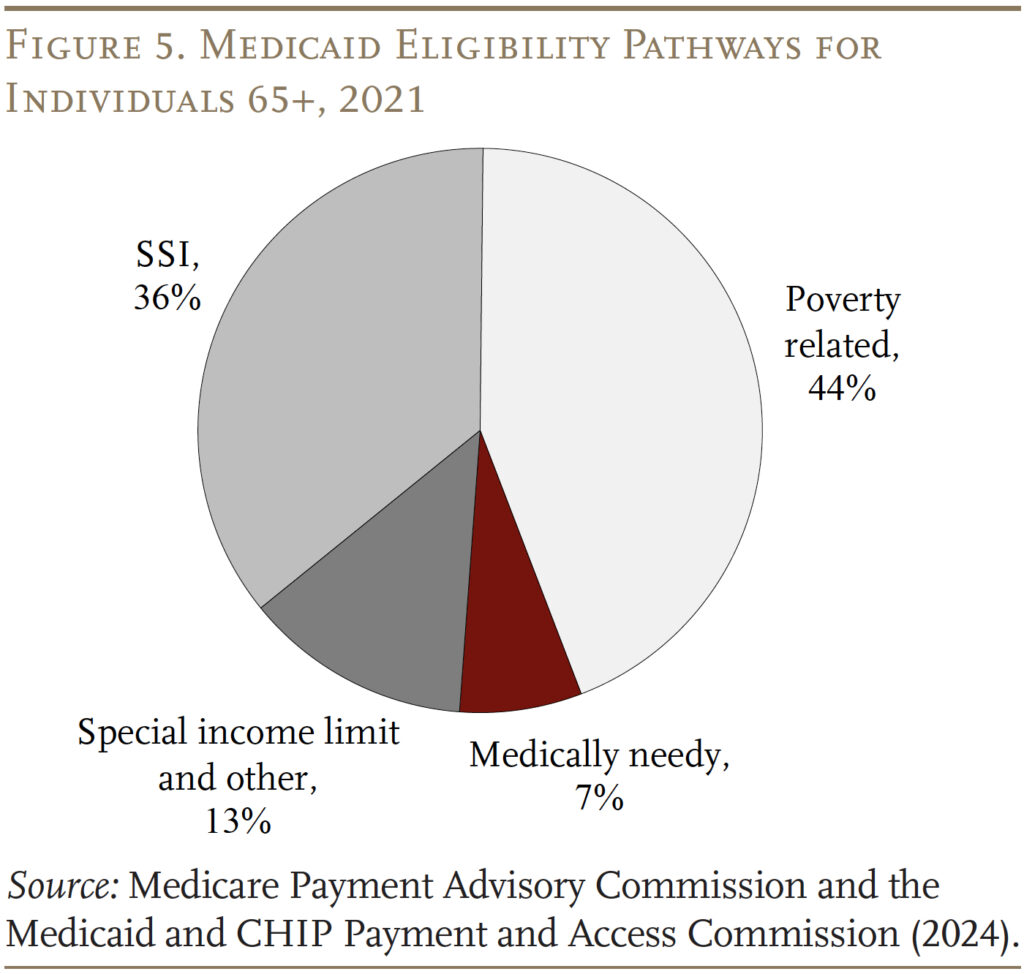
Poverty Related. Fortunately, over 40 percent of states have elected to expand Medicaid to seniors whose income exceeds the SSI limit but is below the federal poverty level. The bulk of these states set the income limit at 100 percent of the federal poverty line, the federal maximum for this pathway.
For both those eligible through SSI and the poverty-related path, states must offer Medicare Savings Programs (MSPs) through which low-income Medicare beneficiaries receive Medicaid assistance with some or all of their Medicare out-of-pocket costs. Medicare’s out-of-pocket costs can be high. In 2024, Medicare Part A, which covers inpatient hospital services, has an annual deductible of $1,632; Part B, which covers outpatient services, requires an annual premium for most beneficiaries of $2,100 as well as a 20-percent co-pay for services. For Medicare beneficiaries with incomes up to the federal poverty line, Medicaid pays Medicare Parts A and B premiums and cost-sharing. For those with slightly higher incomes (100-120 percent of poverty), Medicaid only covers the premiums. Poverty-related criteria account for the bulk – 44 percent – of total 65+ Medicaid beneficiaries.
Special Income Rule. Finally, states are allowed to offer coverage specifically for people who need long-term services and supports (LTSS), including nursing home care. One pathway to these benefits – offered by 42 states – is the “special income rule,” which allows individuals with income up to 300 percent of the SSI limits to qualify for benefits. About 13 percent of Medicaid beneficiaries qualify through this pathway.
Medically Needy
Some states also extend Medicaid to “medically needy” individuals. Recipients must again have assets below limits that vary by state but, under the basic rules, are generally similar to the SSI asset limits. The income test, however, is income net of out-of-pocket medical expenses. After paying their medical bills, recipients must have incomes below their state’s “medically needy income limit,” which tends to be below the SSI income limit.6 Not all states offer this pathway, and medically needy individuals account for only 7 percent of Medicaid beneficiaries ages 65+. Historically, the most common impoverishing expense has been nursing home care. Indeed, long-term care is very expensive – in 2023, the median annual costs were $116,800 for a private room in a nursing home, $64,200 for an assisted living facility, and $75,500 for home health aides.7
Overlap of Medicare and Medicaid
Of course, virtually all people 65+ have Medicare, which covers hospital care, physician services, and prescription drugs. Many mistakenly believe that Medicare covers long-term care services, which it does not. One possible source of confusion may be that Medicare covers up to 100 days of care in a skilled nursing facility, after a hospital stay of at least three days. However, over half of Medicare-covered skilled nursing facility stays are for 20 days or less, and 90 percent for 60 days or less.8 Similarly, Medicare also covers some home health care services for up to 21 days and provides hospice care. Overall, however, most of the care covered by Medicare is medical, short-term, and associated with an acute or terminal event.
Medicaid is the primary payer for long-term care, which includes not only nursing home care but also personal assistance at home for activities of daily living, such as eating, bathing, and dressing, and care provided in assisted living settings. In recent years, the setting for such care has shifted away from institutional care in nursing homes and moved toward home-and-community-based services (HCBS), which include care provided in people’s homes, adult day care centers, assisted living arrangements, and group homes.9 The shift reflects the preferences of the beneficiaries and requirements for states to provide services in the least restrictive setting possible.10 It may also keep fiscal costs in check both by avoiding payment for the room-and-board component of institutional care and by increasing reliance on unpaid family care.
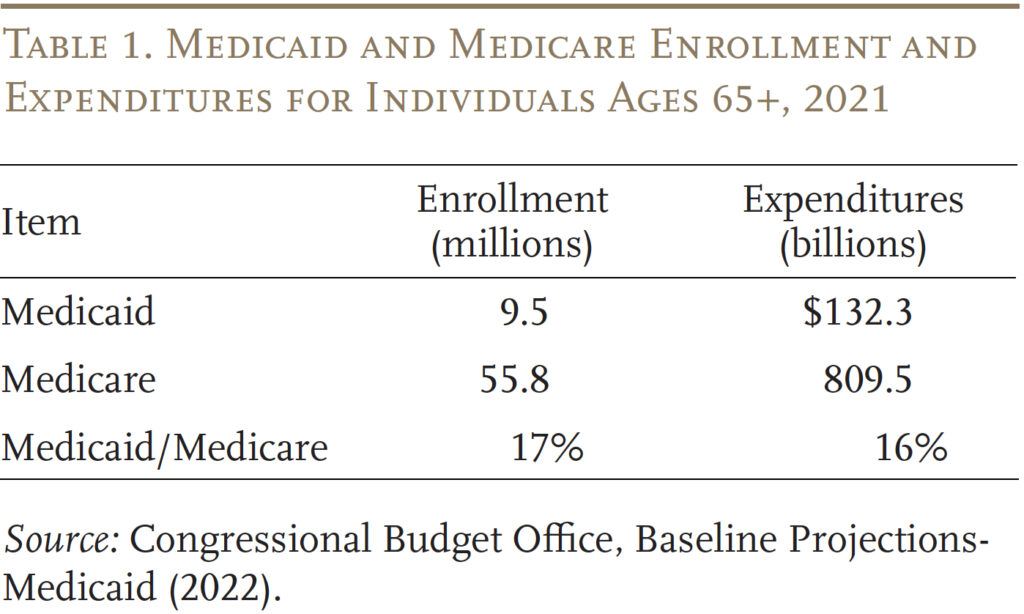
To get some idea of the importance of Medicaid to retirees, Table 1 compares enrollees and expenditures for those 65+ under both Medicaid and Medicare. In terms of both metrics, Medicaid accounts for 16-17 percent of the Medicare figure.
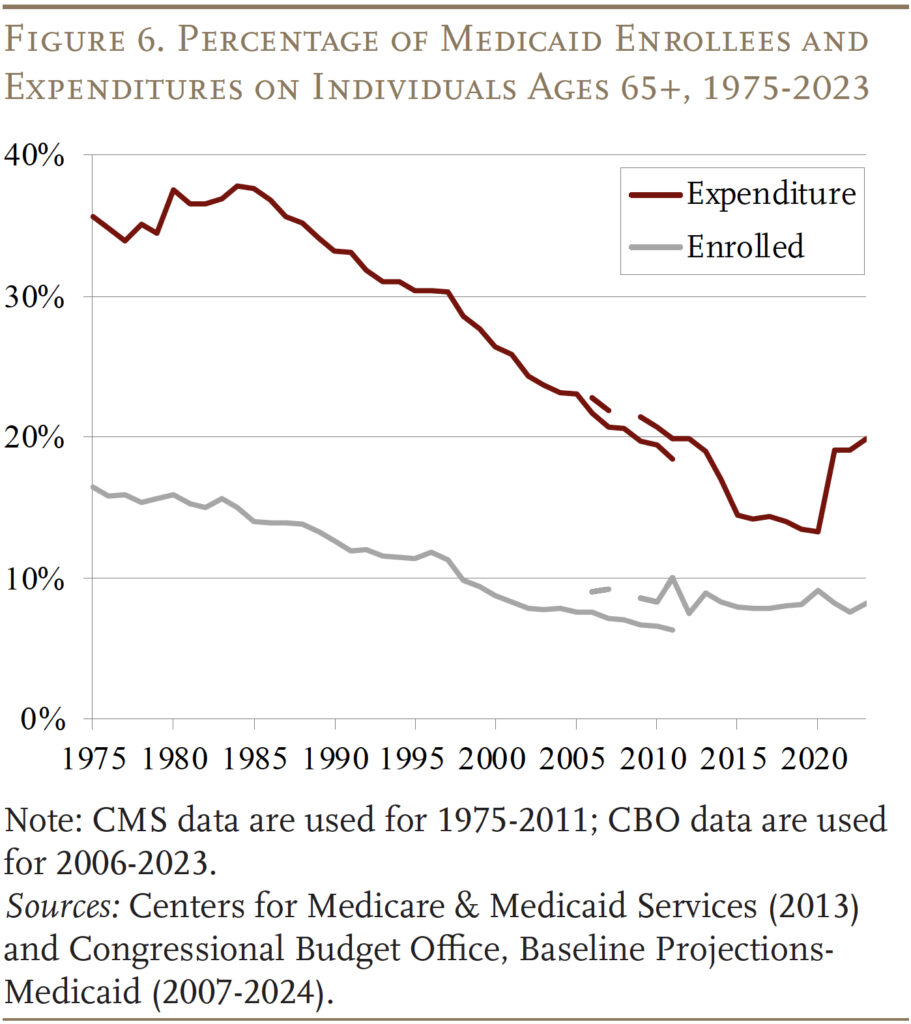
Interestingly, while still significant, the share of Medicaid benefits going to those 65+ has declined sharply since the inception of the program (see Figure 6). This pattern reflects the decline in the share of those 65+ receiving SSI plus a deliberate expansion of Medicaid by both the federal government and the states to cover children and working-age adults.
Future Medicaid Spending
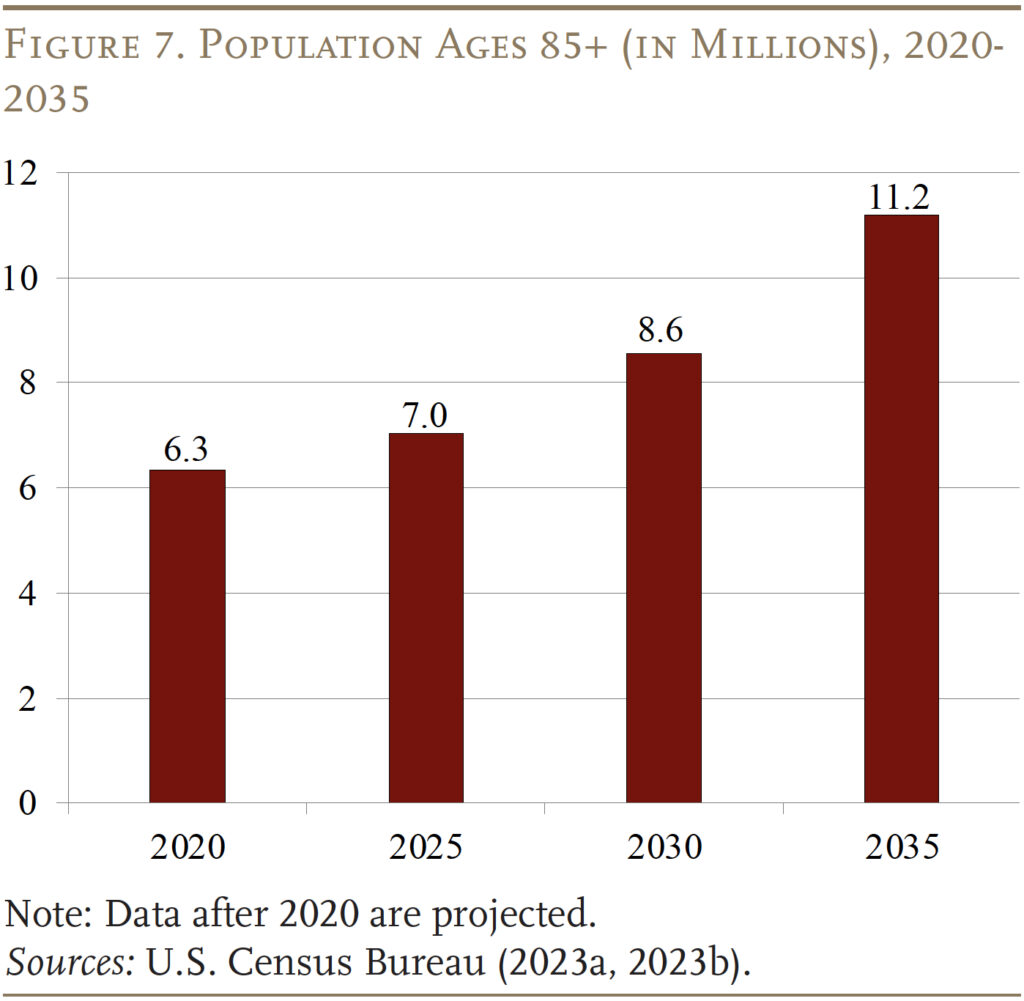
The more important question is what does future Medicaid spending look like for those 65+, given the aging of the U.S. population. Indeed, the number of people 85+ – a group with substantial needs for long-term care – is projected to increase from about 7 million today to 11 million in 2035 (see Figure 7). Will future Medicaid spending reflect this increased demand for long term-care? And what are the implications of future Medicaid spending for government budgets and the well-being of older households?
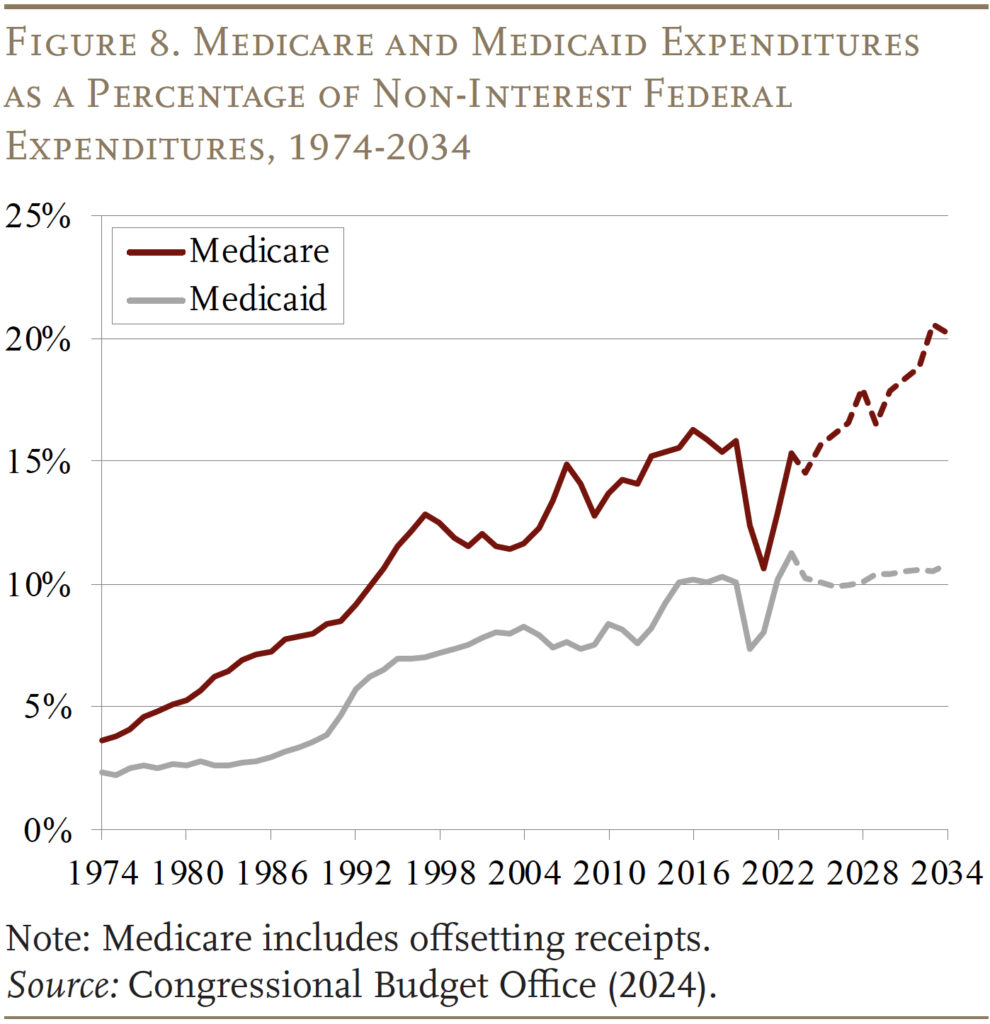
The Congressional Budget Office projects health care spending as a percentage of the federal budget through 2034, which shows that the federal share of Medicaid is scheduled to hold steady at 10 percent of non-interest federal spending (see Figure 8). This projection differs sharply from that for Medicare, where expenditures over the same period increase from 15 to 20 percent of non-interest budget outlays – reflecting both the aging of the population and medical inflation.
Looking under the hood provides some insights into the CBO projections. Total Medicaid enrollment is projected to decline from 97 million to 85 million, led by the unwinding of the pandemic-related continuous enrollment provision, which had temporarily increased enrollment. Additionally, lower birth rates are contributing to fewer child beneficiaries, and the number of adults – in both the traditional eligibility categories and those eligible through the ACA – is expected to decline (see Table 2). The age 65+ category is the only group where enrollment is projected to increase, albeit by only 1 million compared to 4 million in the 85+ population.
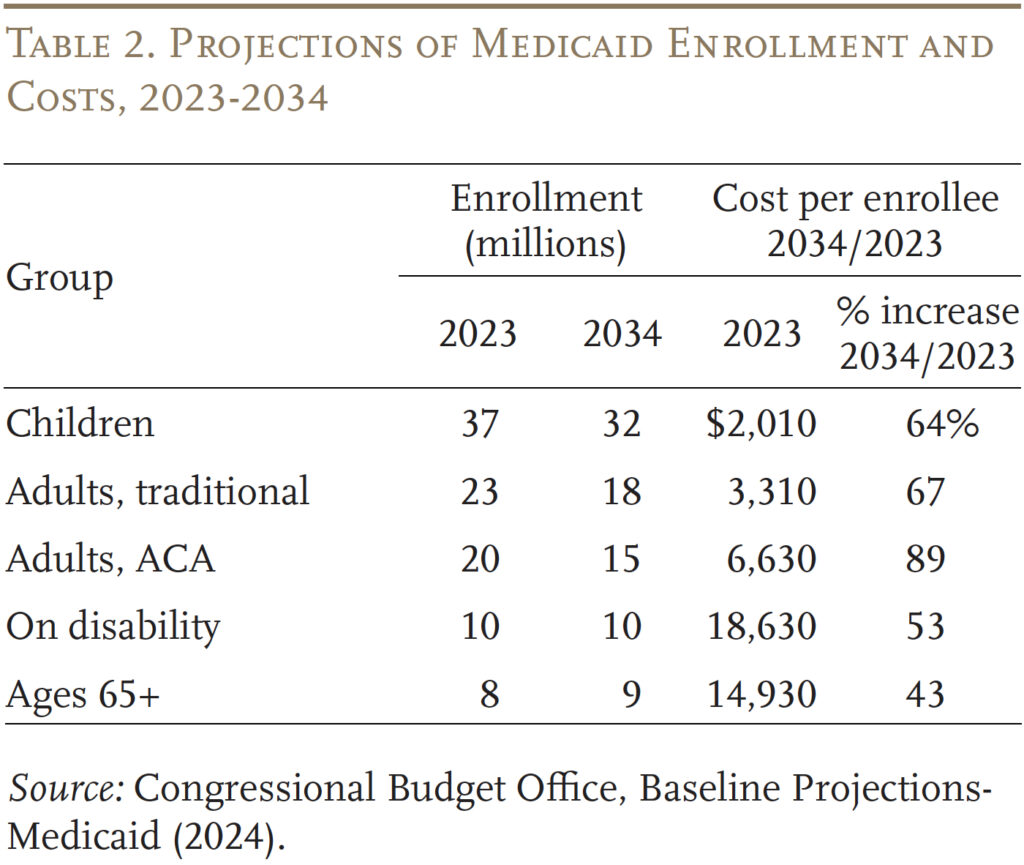
Turning to costs, the aged and those with disabilities are the two most expensive groups, but the ones with the smallest increases in average cost. The slower increase in costs likely reflects both the shift away from nursing facilities to home-and-community-based care and the assumption that while health care costs grow with medical inflation, other long-term care costs grow in line with wages. Moreover, many workers providing long-term care have less medical education and provide more hands-on services than medical professionals. Conversely, the costs for children and adults are projected to increase sharply, but their cost level is quite low and, as noted, their numbers are projected to decline. The bottom line is that – despite the aging of the population – Medicaid is not projected to play a larger role in the future than it does today.
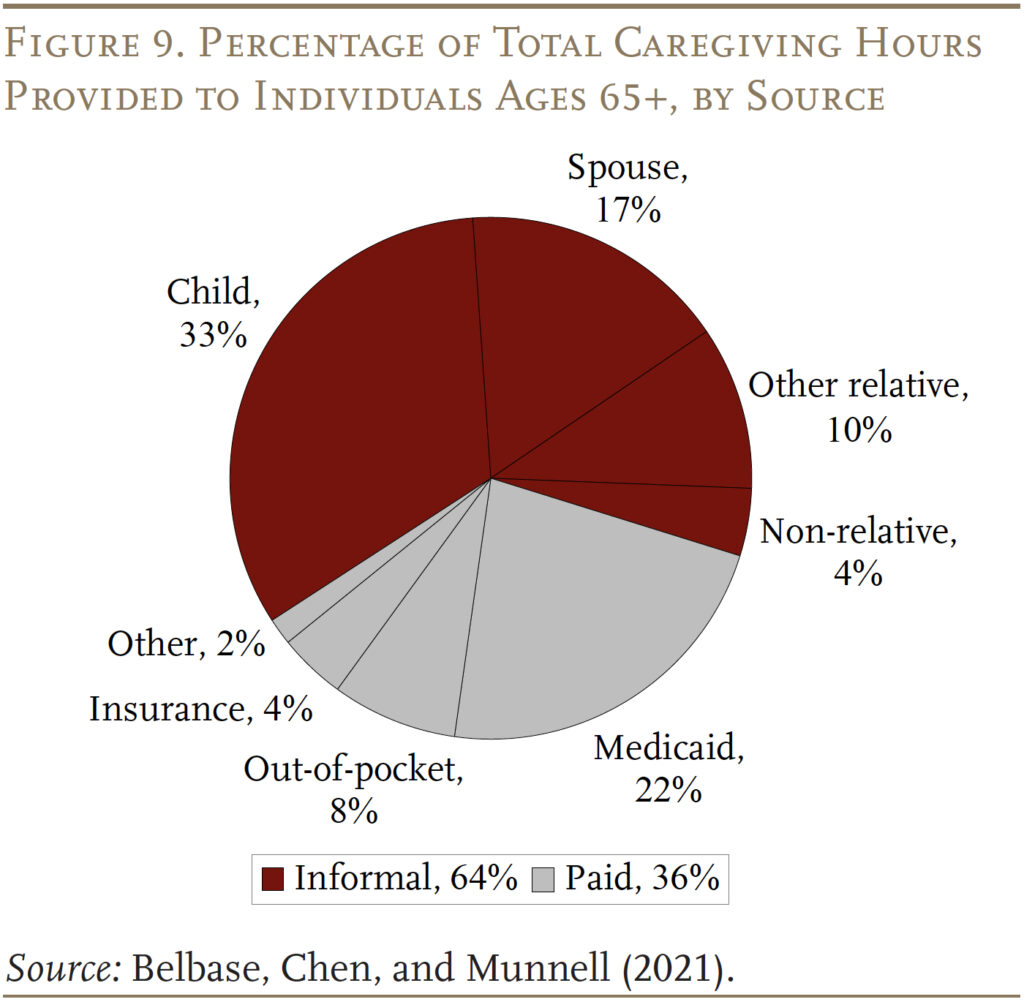
The flipside of fiscal restraint may be unmet needs or a larger burden on families. As shown in Figure 9, while Medicaid is the major payer for paid care, it covers only 22 percent of the hours required to care for those 65+ over their lifetimes. The more common source of support is unpaid informal care provided by family members – primarily spouses and children. Going forward, declines in fertility and the rise in divorce will diminish the supply of informal caregivers.11 And, the share of retirees with extended family or other community support systems has been declining for three decades.12 Without expanded support from Medicaid, the end result will be that many will have care needs that simply go unmet.
Conclusion
Medicaid is the nation’s publicly financed health and long-term care program for low-income people. It was originally established to provide benefits to those receiving cash assistance or “welfare.” Over the years, however, Congress and the states have expanded Medicaid to reach a broad array of uninsured Americans living near or below the poverty level. Medicaid is financed jointly by state and local governments. The federal government sets some basic requirements, but states have the flexibility to design their own versions of Medicaid within the federal statute’s basic framework. Spending on Medicaid has grown significantly over time as a percentage of GDP and as a percentage of federal and state budgets.
Surprisingly, Medicaid is very important for older Americans. Although most people over 65 have Medicare, it does not provide long-term care services and supports, only limited home health care and post-acute care in a skilled nursing facility after a hospital stay. Moreover, Medicare itself is expensive with significant premiums and deductibles. Low-income older people require support for both these needs. At this point, those 65+ account for 10 percent of Medicaid enrollees and 20 percent of Medicaid expenditures.
With the projected growth in the oldest old – those 85+ – the demand for long-term care services will increase. Budget projections, however, suggest that Medicaid is unlikely to expand beyond its current role. How will the increased demand be addressed – more care from family or unmet needs?
References
Belbase, Anek, Anqi Chen, and Alicia H. Munnell. 2021. “What Resources Do Retirees Have for Long-Term Services & Supports?” Issue in Brief 21-16. Chestnut Hill, MA: Center for Retirement Research at Boston College.
Brown, Susan L. and Matthew R. Wright. 2017. “Marriage, Cohabitation, and Divorce in Later Life.” Innovation in Aging 1(2): 1-11.
Burns, Alice, Maiss Mohamed, Molly O’Malley Watts, and Bradley Corallo. 2024. “Medicaid Eligibility and Enrollment Policies for Seniors and People with Disabilities (Non-MAGI) During the Unwinding.” San Francisco, CA: KFF.
Centers for Medicare and Medicaid Services. 2013. “Medicare and Medicaid Statistical Supplement, Table 13.4 and Table 13.10.” Washington, DC.
Centers for Medicare and Medicaid Services. 2023. National Health Expenditure Accounts. Washington, DC: U.S. Department of Health and Human Services.
Congressional Budget Office. 2024. “Budget and Economic Data, Historical Budget Data.” Washington, DC.
Congressional Budget Office. “Baseline Projections-Medicaid: 2007-2024.” Washington, DC.
KFF. 2024. “Medicaid 101.” San Francisco, CA.
Komisar, Harriet. 2013. “Medicare Does Not Pay for Long-Term Care.” AARP: Washington, DC.
Genworth Financial, Inc. 2023. “Cost of Care Survey.” Richmond, VA.
Medicare Payment Advisory Commission and the Medicaid and CHIP Payment and Access Commission. 2024. “Beneficiaries Dually Eligible for Medicare and Medicaid.” Data Book. Washington, DC.
National Association of State Budget Officers. State Expenditure Report, 1987-2023. Washington, DC.
Olmstead v. L.C. 1999. 527 U.S. 581. Washington, DC: U.S. Supreme Court.
Tolbert, Jennifer and Bradley Corallo. 2024. “An Examination of Medicaid Renewal Outcomes and Enrollment Changes at the End of the Unwinding.” San Francisco, CA: KFF.
Wettstein, Gal and Alice Zulkarnain. 2019. “Will Fewer Children Boost Demand for Formal Caregiving?” Working Paper 2019-6. Chestnut Hill, MA: Center for Retirement Research at Boston College.
U.S. Census Bureau. 2023a. “Projected Population by Age Group and Sex for the United States, Table 1.” Washington, DC.
U.S. Census Bureau. 2023b. “The Older Population: 2020.” Report No. C2020BR-07. Washington, DC.
U.S. Congress Joint Economic Committee. 2019. “An Invisible Tsunami: ‘Aging Alone’ and Its Effect on Older Americans, Families, and Taxpayers.” (January 24). Washington, DC.
Endnotes
- In FY 2025, the matching rates range from 50 percent to 77 percent. See KFF (2024). ↩︎
- In 1996, legislation replaced AFDC with Temporary Aid to Needy Families (TANF) and severed the link between Medicaid eligibility and cash assistance for children, pregnant women, and low-income parents. ↩︎
- Burns et al. (2024). ↩︎
- Tolbert and Corallo (2024). ↩︎
- For more details on categorically needy pathways, see Burns et. al. (2024). ↩︎
- In 2024, the minimum monthly income is $504 – 40 percent of poverty. This provision applies to an individual’s income minus expenses during a specific “budget period,” which varies by state from one to six months. When determining eligibility for a married individual, Medicaid has spousal impoverishment rules to protect the spouse living in the community. For example, the spouse’s income is excluded and the spouse may also receive a minimum monthly maintenance allowance from the couple’s resources. ↩︎
- Genworth Financial (2023). ↩︎
- Komisar (2013). ↩︎
- For all beneficiaries qualifying as categorically needy, nursing facilities are a mandatory benefit, while most home-and-community-based services are not required by statute. ↩︎
- The requirements stem from the U.S. Supreme Court’s Olmstead decision in 1999, which ruled that – under the Americans with Disability Act – states must provide community-based services for people with disabilities when appropriate, rather than requiring that the care take place in institutions (Olmstead v. L.C. 1999). ↩︎
- See, for example, Wettstein and Zulkarnain (2019) and Brown and Wright (2017). ↩︎
- U.S. Congress Joint Economic Committee (2019). ↩︎


Munnell, Alicia H.. 2024. "The Importance of Medicaid for Older Americans" Issue in Brief 24-22. Chestnut Hill, MA: Center for Retirement Research at Boston College.