The Medicare Trustees Report Contained No Bad News. Now for the Bad Part.

Alicia H. Munnell is a columnist for MarketWatch and senior advisor of the Center for Retirement Research at Boston College.
Expenditures are high and projected to rise because national healthcare costs are out of control.
The 2024 Medicare Trustees Report (released this spring) got almost no attention, contained no bad news. It is true that, under current law, Medicare Part A – the Hospital Insurance (HI) program – faces a long-term deficit, but that deficit is the smallest it has been for more than a decade and the year of depletion of trust fund reserves has been pushed out five years to 2036. Yes, the rest of the Medicare program will require increasing amounts of general revenues, but they are very similar to those anticipated last year. Despite the relatively sanguine 2024 report, however, it’s important to remember that the Medicare program operates in an extremely costly health system.
The Medicare Trustees project the program’s finances under two sets of assumptions – current law and an alternative scenario that limits the cost-control provisions of earlier legislation.
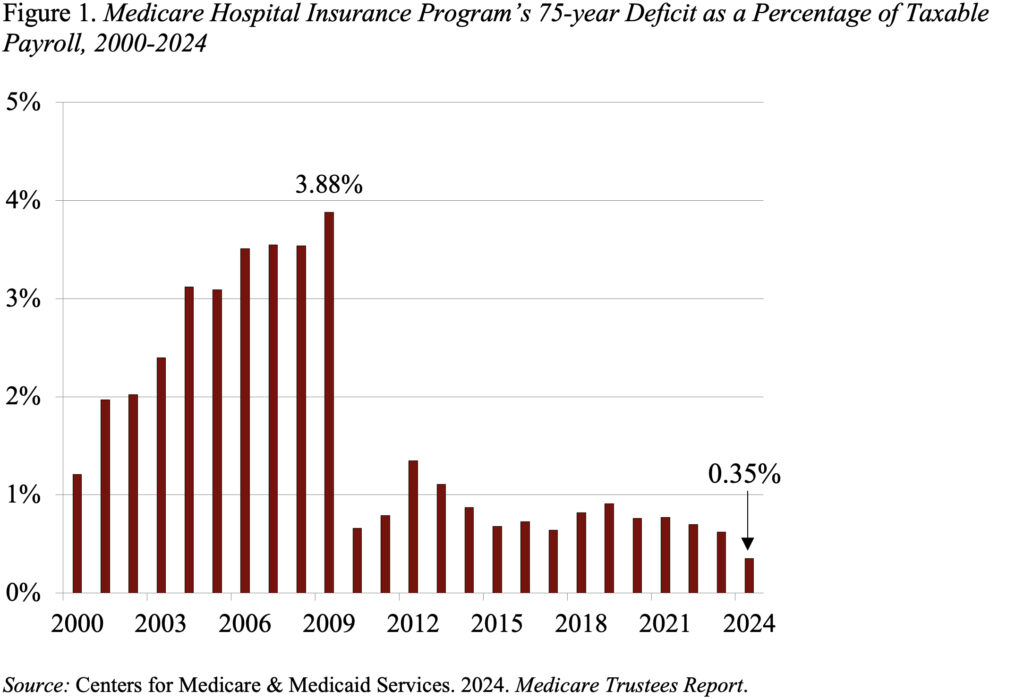
Assuming current law, the Trustees project a 75-year HI deficit of 0.35 percent of taxable payrolls. This deficit is at the low end of the diminished deficits that emerged in the wake of the Affordable Care Act (see Figure 1). As a result of the improved outlook, the HI trust fund now will not deplete its reserves until 2036 – five years later than projected in last year’s Trustees Report. Once the fund is depleted, continuing program income will be sufficient to pay 89 percent of scheduled benefits.
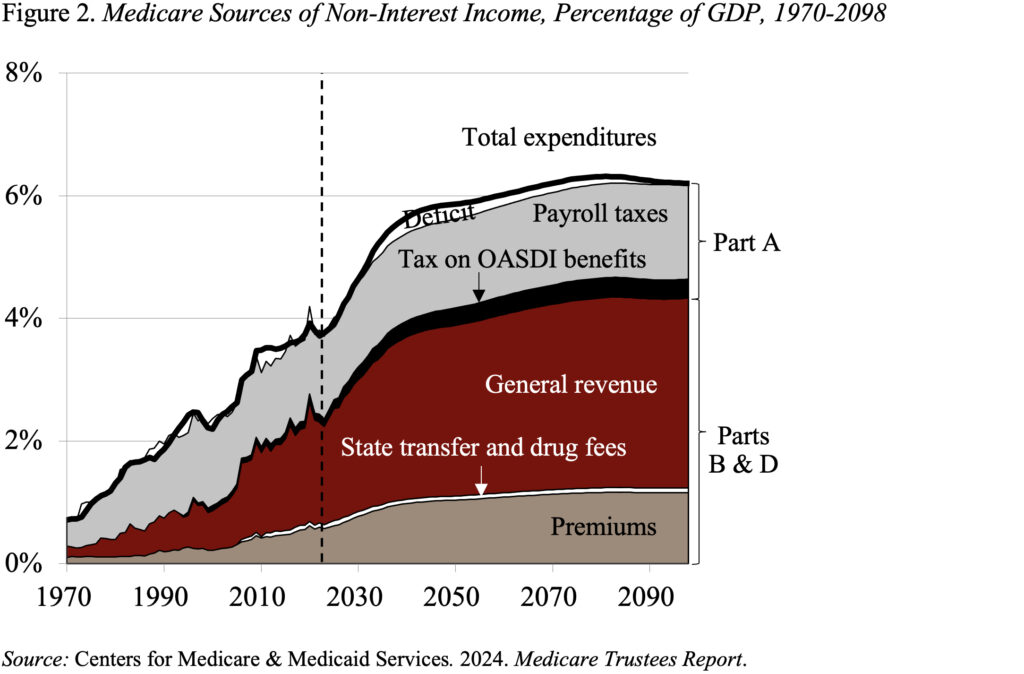
Part B, which covers physician and outpatient hospital services, and Part D, which covers prescription drugs, are both adequately financed for the indefinite future because the law provides for general revenues and participant premiums to meet the next year’s expected costs. Of course, an increasing claim on general revenues puts pressure on the federal budget and rising premiums place a growing burden on beneficiaries (see Figure 2).
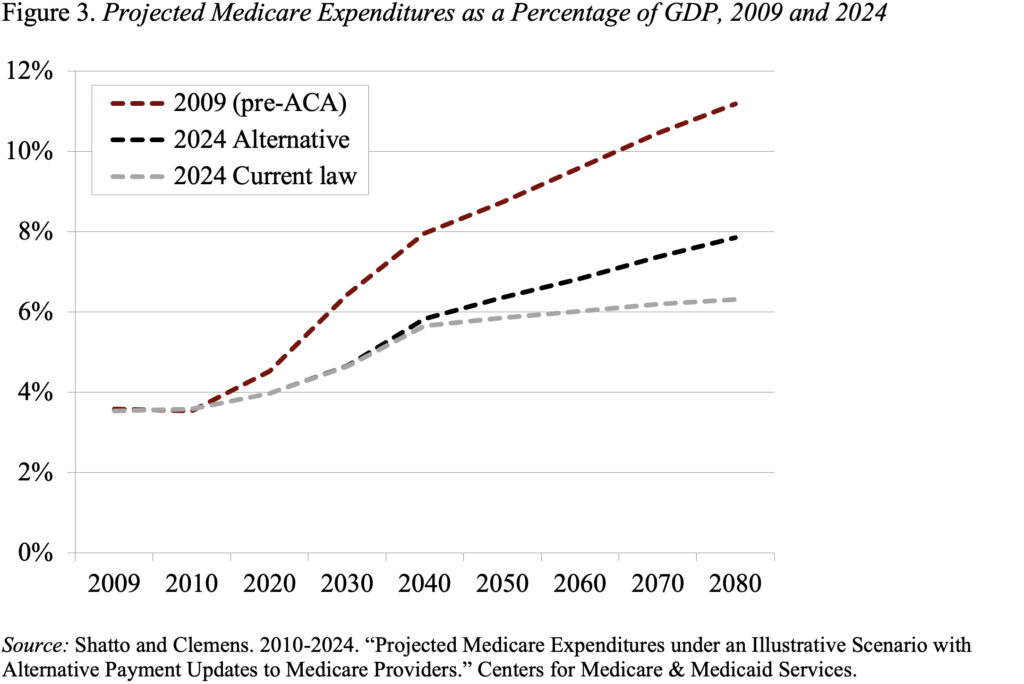
In addition to projections based on current law, the actuaries also prepare an alternative set of projections that relax the cost-saving provisions in the Affordable Care Act and subsequent legislation. Under these alternative assumptions, by 2090, the total cost of Medicare is about 2 percent of GDP higher under the alternative than under the current-law provisions. Note, however, that even these higher expenditures are way below the pre-ACA projections (see Figure 3).
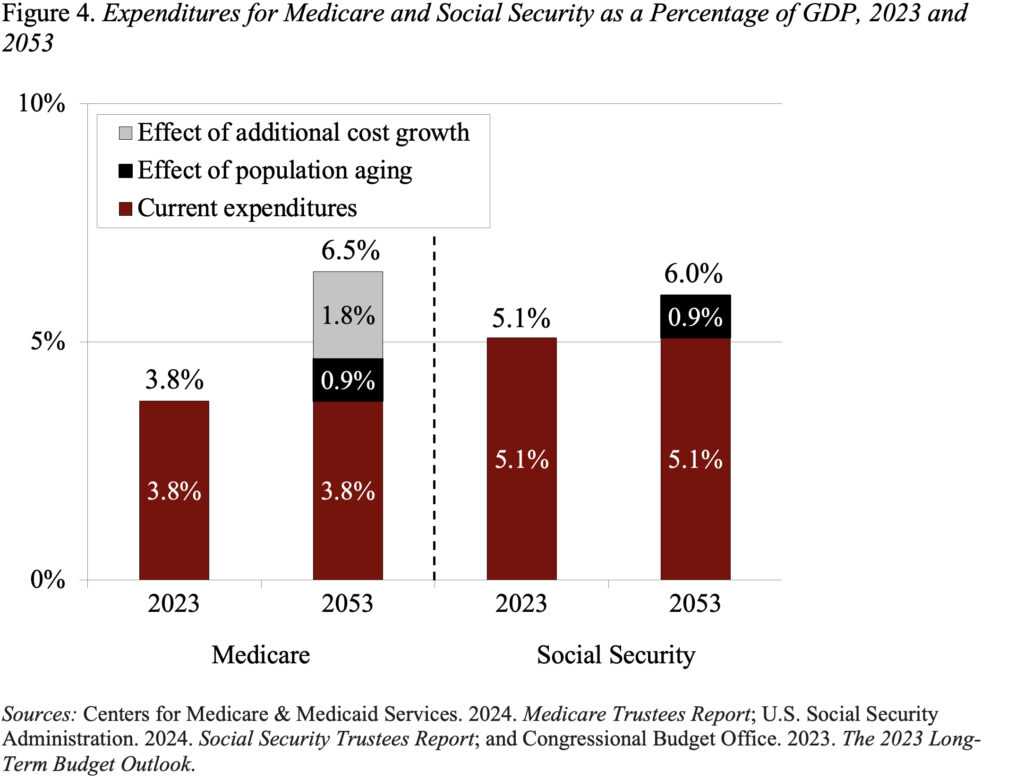
While the 2024 Trustees Report produced relatively good news on the Medicare front, the program’s costs are high and are projected to grow as a percentage of GDP. In contrast to Social Security, where population aging can explain all the growth in expenditures over the next 30 years, an aging population explains much less than half of the projected future growth in Medicare (see Figure 4). The rest comes from the costs for hospital and physician services rising faster than GDP. The bottom line is that the only way to control Medicare costs is to get national healthcare spending under control.