
What Happened to Late Boomers’ Retirement Wealth?

The brief’s key findings are:
- Late Boomers have less retirement wealth than earlier cohorts, including surprisingly low 401(k) assets.
- To explain this drop, the analysis explored both changing demographics and labor market experiences.
- The results show that part of the drop is due to a decline in the share of Late Boomers who are White, married, and have college degrees.
- The main factor, though, is that Late Boomers saw a weakening in the link between work and wealth due to the Great Recession.
- The Great Recession story is a bit of good news for younger cohorts, as some of the downward pressure on their wealth holdings should abate.
Introduction
Late Boomers have surprisingly low levels of retirement wealth compared to earlier cohorts. A decline in some wealth components had been expected as a result of the rise in Social Security’s Full Retirement Age and the shift from defined benefit to defined contribution plans. But increasing 401(k)/IRA balances were predicted to offset the gap, since Late Boomers were the first generation where workers could have spent their whole career covered by a 401(k) plan. That did not happen: retirement wealth dropped across all but the top quintile. Why do Late Boomers have so little wealth? And what do the patterns imply for Early Gen Xers and subsequent cohorts?
This brief, which is based on a recent paper, attempts to answer these questions using the Health and Retirement Study (HRS) to look at actual patterns of wealth accumulation by cohort and the Survey of Consumer Finances (SCF) to gather insights on the experience of Late Boomers over their work life.1Chen, Munnell, and Quinby (2023). The HRS also serves as the basis for a decomposition exercise to evaluate the role of the various factors that depressed Late Boomer wealth.
The discussion proceeds as follows. The first section documents the decline in wealth for Late Boomers and explores whether variation by race and ethnicity might have contributed. The second section looks at an alternative factor that might explain the drop in Late Boomers’ wealth – namely, their labor market experience in the Great Recession. The third section uses a decomposition technique to sort out the relative contribution of shifting demographics versus labor-market experience in explaining the drop in wealth. The results show that two factors were at play – a shift in the population towards lower-wealth households and, more importantly, a weakening of the link between work and wealth accumulation. The final section concludes that to the extent that the decline in wealth is a Great Recession story, some of the downward pressure on wealth holdings should abate – potential goods news for younger cohorts.
Wealth Holdings of Late Boomers
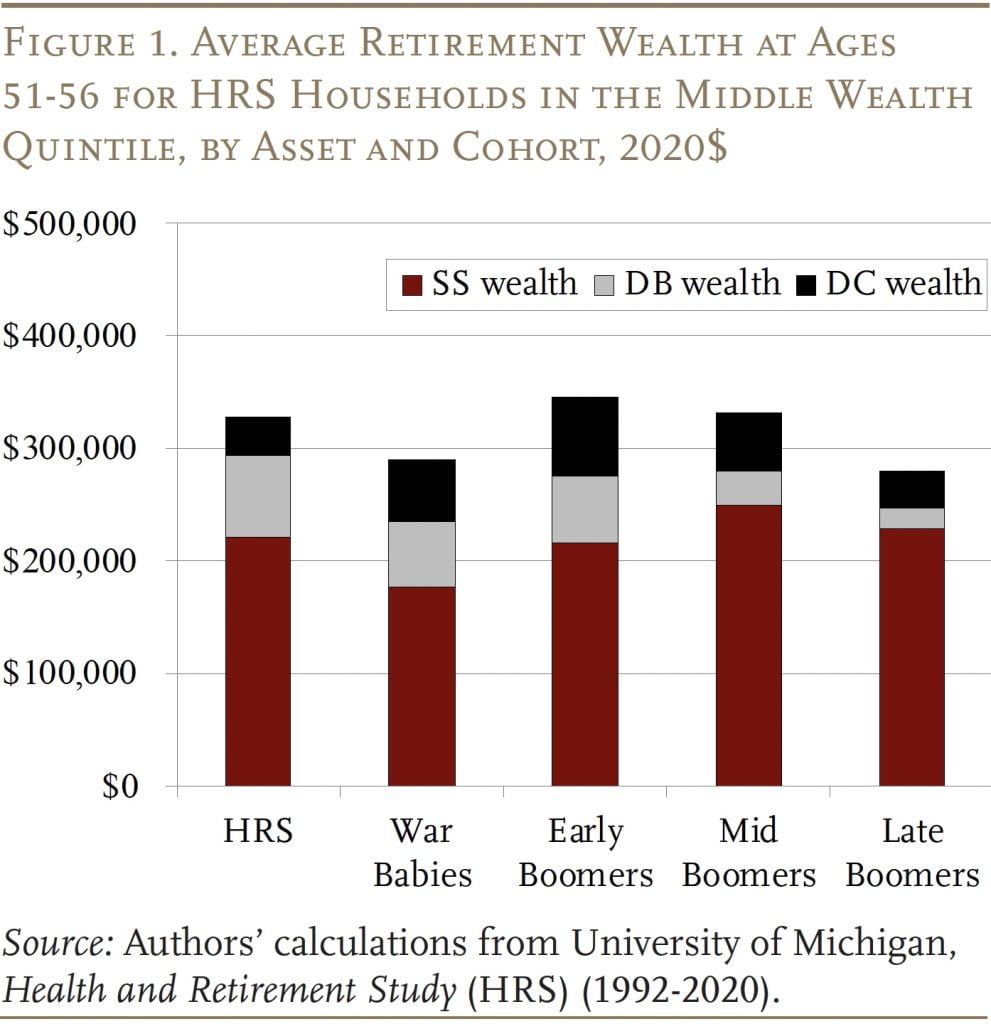
The data for calculating retirement wealth come from the HRS, a biennial longitudinal survey of American households over age 50. The measure includes wealth from three sources: 1) Social Security; 2) defined benefit plans; and 3) defined contribution plans, such as 401(k)s and IRAs. The analysis covers five birth cohorts and, in order to compare the most recent cohort to the others, the focus is on households at ages 51-56.
Social Security wealth is equal to the expected present value of benefits at age 62, discounted back to the age at the survey year and pro-rated (based on earnings) to facilitate a comparison to other wealth that the household has accumulated by ages 51-56. Projected income from defined benefit plans is also transformed into a wealth measure, like Social Security, by calculating the expected present value of lifetime benefits. Defined contribution wealth is simply the self-reported account balances.
The results for the middle wealth quintile show that the pattern of wealth holdings across cohorts is generally as expected (see Figure 1). Defined benefit wealth declines, Social Security wealth stays roughly constant (as the cuts due to the increase in the Full Retirement Age are offset by the impact of higher wages), and defined contribution wealth increases. That pattern, however, comes to an abrupt halt with the Late Boomers, when defined contribution wealth drops sharply.
One possible explanation for the decline in retirement wealth of Late Boomers could be shifting demographics. Indeed, Black and Hispanic households in the middle quintile hold only a fraction of the wealth of their White counterparts. Interestingly, however, Late Boomers in these traditionally disadvantaged groups have not experienced the same decline in retirement wealth as Whites. With their Social Security wealth holding steady and modest changes elsewhere, retirement wealth for Black and Hispanic households relative to White households actually rose from Mid Boomers to Late Boomers (see Figure 2).
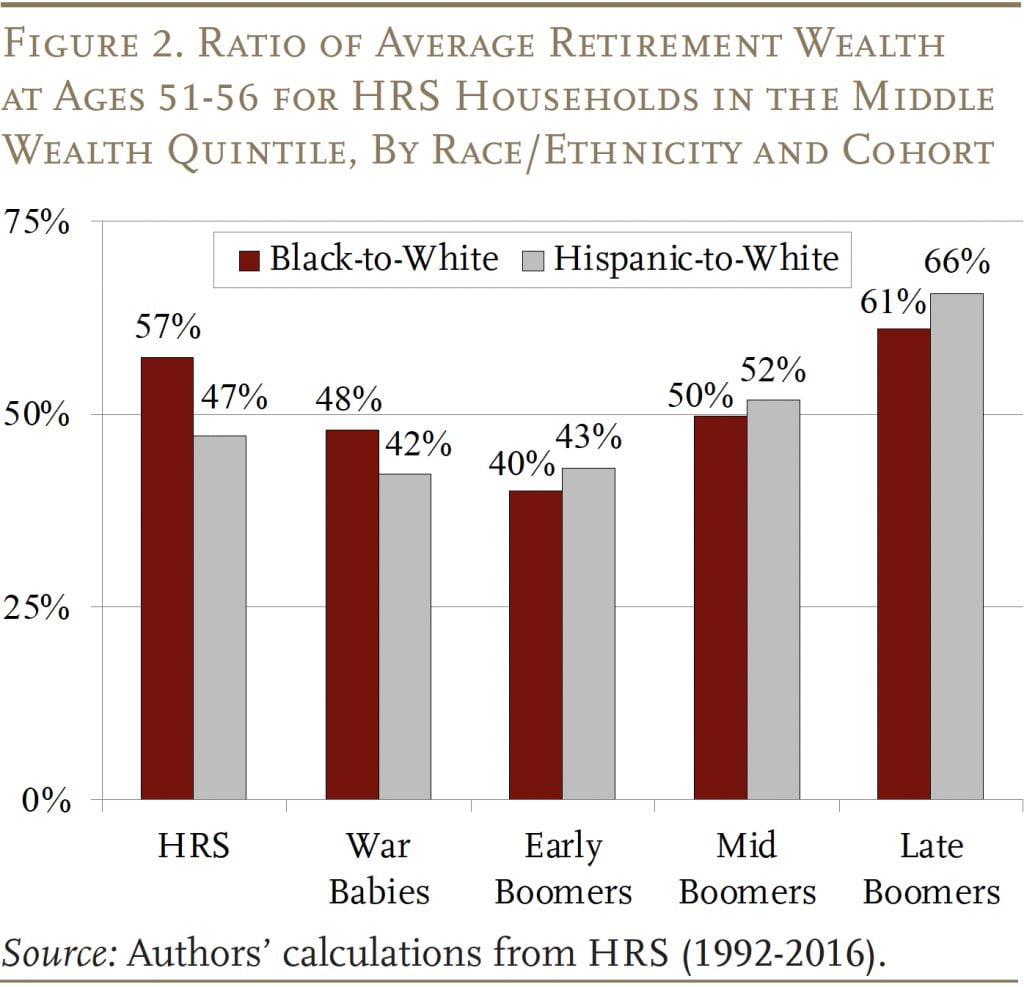
The fact that the decline in wealth from Mid Boomers to Late Boomers was not driven by a worsening situation for Black and Hispanic households does not mean that the racial composition of the population is not relevant to the decline in wealth from one cohort to the other. Specifically, since Black and Hispanic households still have less wealth than their White counterparts, to the extent that non-White households increase as a share of the total, average cohort wealth will decline. The decomposition procedure described in the final section attempts to sort out how much of the decline can be attributed to demographics as opposed to other factors. The most likely other factor is the labor market experience of Late Boomers.
Labor Market Experience of Late Boomers
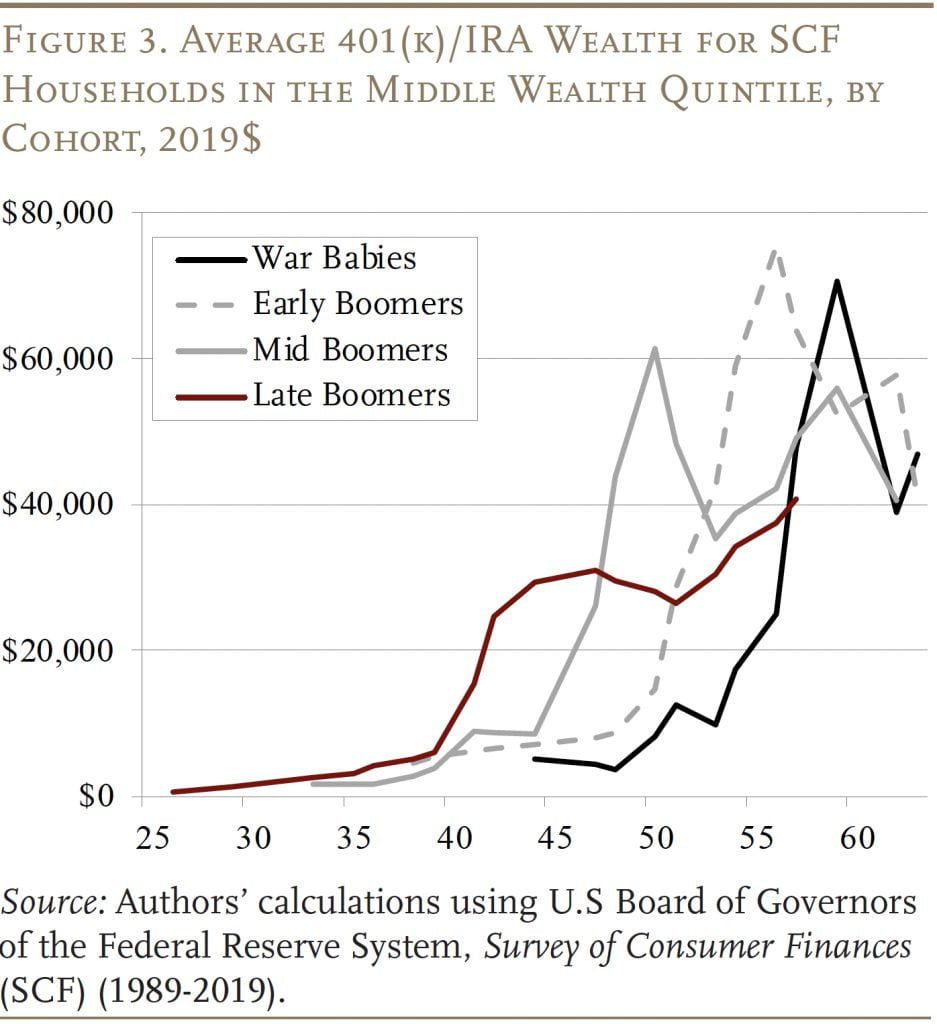
While the HRS data are excellent for looking at retirement wealth for households ages 50 and older, they provide limited information on what happened to the various cohorts earlier in life. For that, the analysis turns to the SCF, which includes households of all ages, to explore whether the labor market experience of Late Boomers might help explain their low wealth holdings. The SCF, which has been conducted every three years since 1983, asks households about their income, wealth, and pension coverage. Although the SCF does not follow the same households over time, it is possible to construct “synthetic” cohorts from these triennial SCF surveys to get a picture of employment, earnings, and wealth trends across the lifecycle.
The results show that Late Boomers were not always behind in private retirement savings. In fact, until their mid-40s, Late Boomers held more 401(k)/IRA assets than earlier cohorts at the same age (see Figure 3). Thereafter, however, that pattern changed abruptly; growth ceased and average assets actually dropped. While their balances did start to grow again as they moved into their 50s, their holdings remained significantly below those of earlier cohorts.
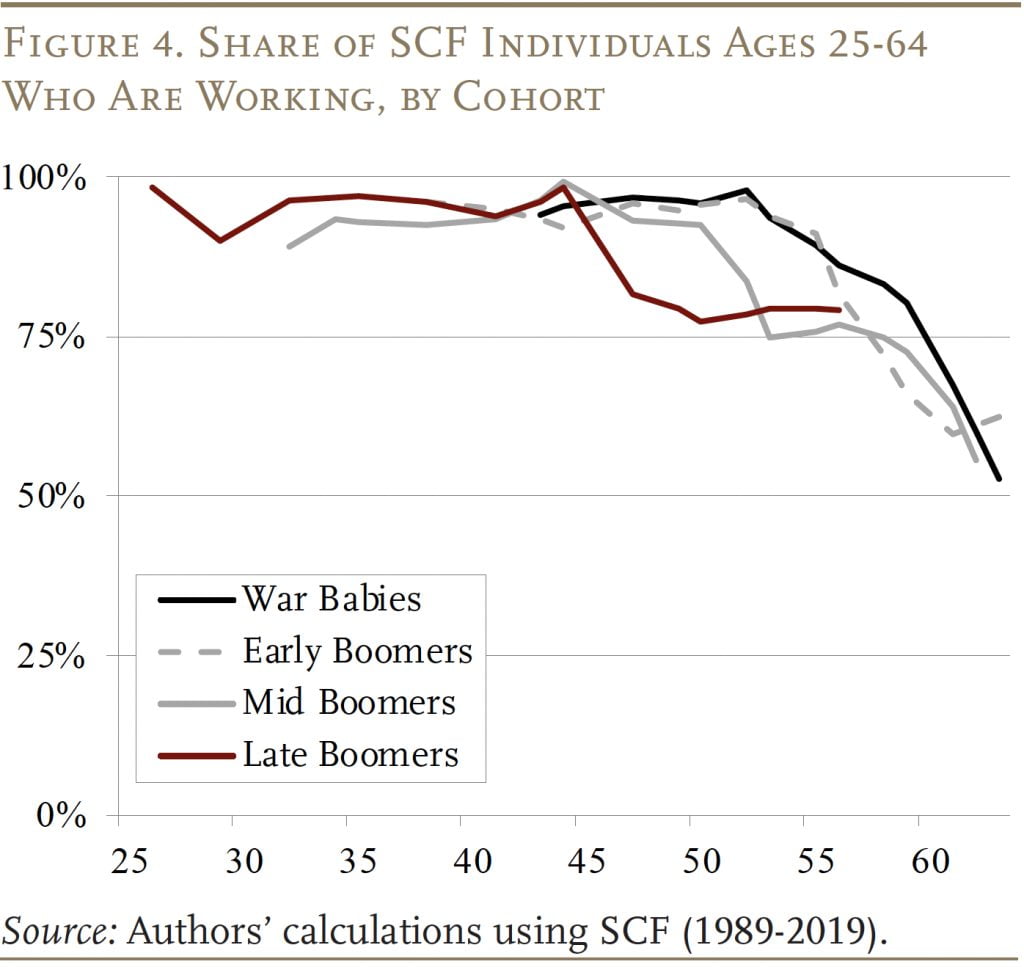
Interestingly, the Late Boomers were in their 40s during the Great Recession, and this economic calamity appears to have hit them particularly hard. Their employment rate – that is, the percentage of individuals working – dropped sharply (see Figure 4). More importantly, the percentage of the cohort working did not rebound as the economy recovered. Thus, one explanation for the low level of retirement assets is simply that many Late Boomers ended up permanently unemployed, unable to contribute to their 401(k)s, and likely having to drain accumulated retirement assets to support themselves. But a closer look at those who were employed suggests that the damage went beyond the unemployed.
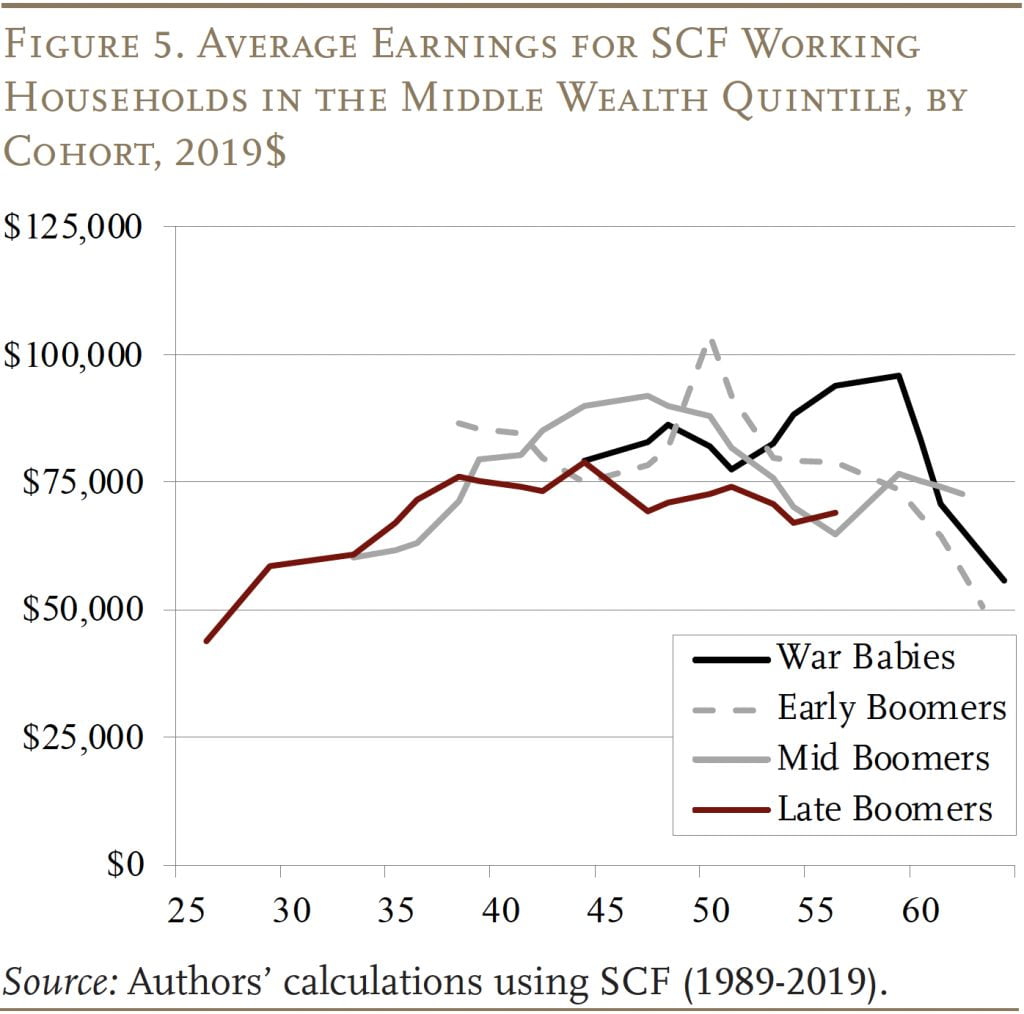
Even among working households, the Great Recession appears to have taken a greater toll on Late Boomers than on earlier cohorts. When Late Boomers reached their 40s, their average earnings flattened out and then declined continuously thereafter, leaving them in their 50s with earnings generally well below those of Early and Mid Boomers (see Figure 5).
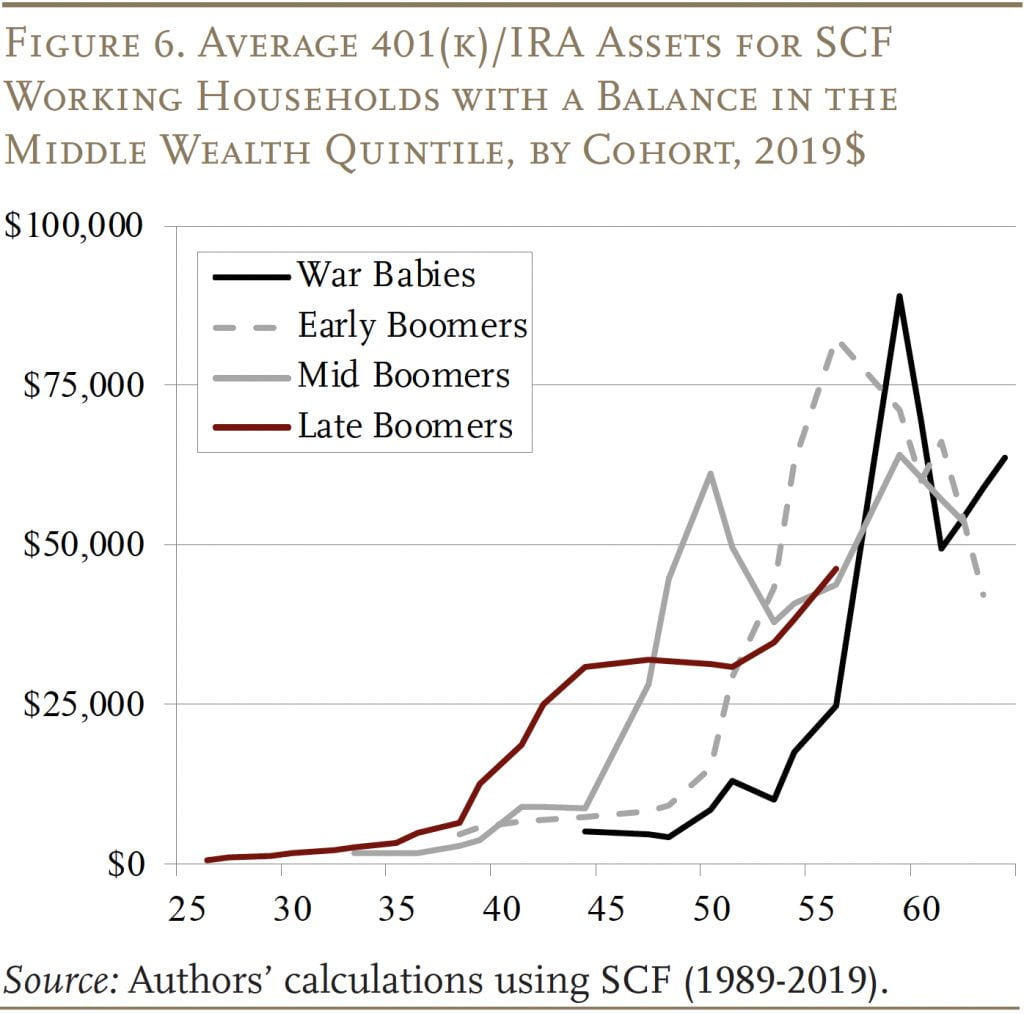
The Late Boomers’ lower earnings were accompanied by a decline in the share of these households participating in a 401(k) plan; and even for those working households who were participating, the trajectory of their 401(k)/IRA balances changed dramatically after the Great Recession. Whereas before the economic collapse their balances exceeded those of earlier cohorts, afterwards they flattened and remained largely below those of other Boomers (see Figure 6).
In short, the decline in 401(k)/IRA balances for the Late Boomers reflects not only the unemployment caused by the Great Recession but also the deterioration of labor market outcomes for those who stayed employed. The ultimate question is, how much of the deterioration in the retirement wealth of Late Boomers was due to their worse labor market experience as opposed to the shifting demographics described earlier?
Decomposing Decline from Mid to Late Boomer Wealth
The tool for assessing the importance of various factors in explaining the drop in wealth from Mid Boomers to Late Boomers is a Oaxaca-Blinder decomposition analysis. The analysis begins by estimating an ordinary least squares regression for each cohort that links wealth to demographic and economic variables.
Wealth = ƒ(demographic characteristics, economic experience)
The demographics include race/ethnicity, marital status, number of children, and education. Because of data constraints, the only economic variable included is percentage of household years worked when the head was ages 42-49 – the age of Late Boomers at the beginning of the Great Recession. To ensure a large enough sample size, the equations are estimated for the middle three quintiles of the wealth distribution.
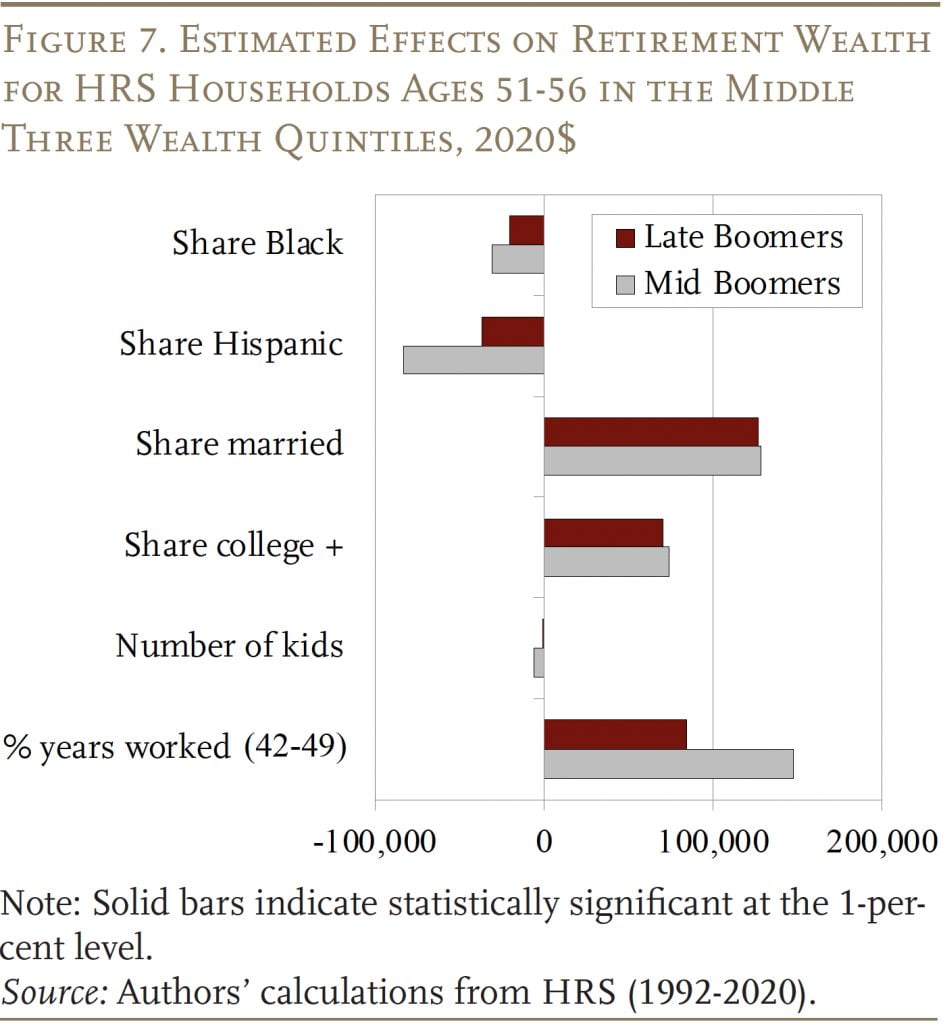
The results of these regressions for Mid Boomers and Late Boomers are shown in Figure 7. The coefficients of the demographic variables – Black household, Hispanic household, married, college or higher, and number of children – enter the equations with the expected signs and are statistically significant. The economic variable – percentage of household years worked when the head was ages 42-49 – also has a statistically significant positive relationship with wealth accumulation.
These equations constitute the basis for the decomposition. The first step is to estimate Late Boomer wealth and Mid Boomer wealth based on the regression results, by multiplying the mean value for each variable by the coefficient. This calculation shows retirement wealth for Mid Boomers is $350,400 and for Late Boomers $299,700 – a difference of $50,700. (the black bar in Figure 8). The challenge is to explain the reasons for this difference by looking at the impact of the shift in shares of households in each group and then the impact of shifting coefficients.
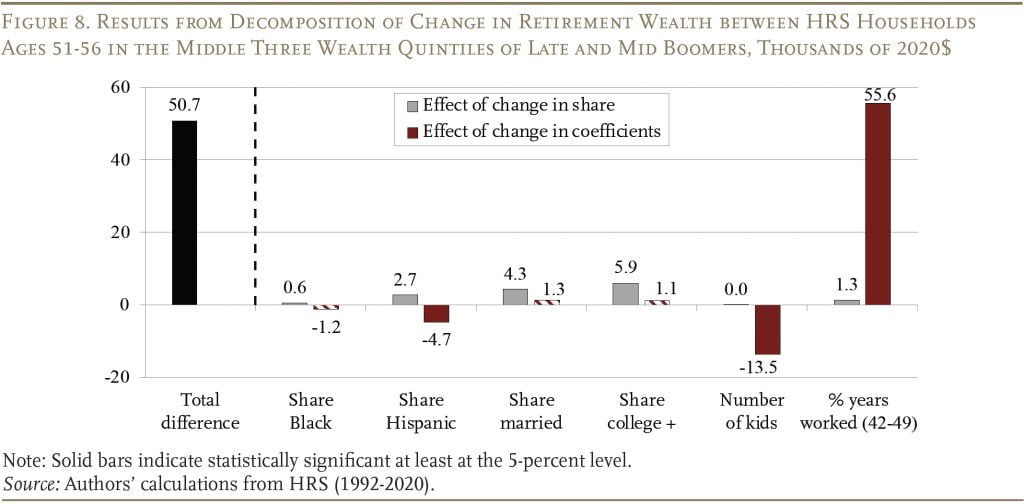
The first part of the decomposition holds constant the coefficients and predicts what would have happened if only the shares had changed. The results, shown in the gray bars, indicate that the higher share of Black households among Late Boomers compared to Mid Boomers is responsible for $600 of the total decline in retirement wealth for Late Boomers. For Hispanic households, the comparable number is $2,700. Late Boomers also saw a drop in the share of households that were married and those headed by college graduates – these factors account for $4,300 and $5,900, respectively, of the decline in their retirement wealth. Since the number of children did not change very much between cohorts, this variable did not have a statistically significant coefficient. On the economic side, as noted above, Late Boomers worked less than Mid Boomers when they were ages 42-49; this reduction in work results in $1,300 dollars less in retirement wealth. In all, the change in the demographic characteristics and work activity between Mid to Late Boomers explains $14,800 of the decline in retirement wealth, or 29 percent of the total decline.
The second part of the decomposition assumes that the shares of each variable are fixed at the Mid-Boomer level and predicts what would have happened to retirement wealth if the coefficients changed. The results, shown in the red bars, indicate that the most important factor in the whole analysis is the change in the coefficient for the percentage of household years worked among those with a head ages 42-49. Specifically, this link between work and wealth accumulation declined significantly for Late Boomers, compared to Mid Boomers, reducing their retirement wealth by $55,600 more.
Two other smaller effects were also evident. The first pertained to the share of households with a Hispanic head. The results indicate that the wealth accumulation prospects for Hispanic households improved between these two cohorts, resulting in an increase in wealth for Late Boomer households of $4,700. The second is the number of children. The results show that the negative effect of children on wealth was reduced for Late Boomers, making their retirement wealth $13,500 higher compared to Middle Boomers. One possible explanation for this anomalous result may be that student loans became a socially acceptable way to pay for college, allowing parents to save more for retirement.
The bottom line for these results is twofold. First, the decomposition analysis brings home the fact that one cannot look at the trends in average wealth by households without considering the demographics. And as long as non-White households earn less, inherit less, and therefore accumulate less assets than White households, any increase in their share of the total population will bring down any measure of average wealth. Similarly, even if total wealth were increasing, the shift from married to single-person households would produce a decline in average household wealth. And if the percentage of households with a college degree declines, so will wealth accumulation. All those things happened between the Mid Boomers and the Late Boomers.
Second, the weakened link between work and wealth is fully consistent with the “synthetic” cohort analysis from the SCF, discussed earlier, which showed that even Late Boomers who had a job after the Great Recession earned less, were less likely to participate in a 401(k) plan, and accumulated fewer assets in those plans. Work, for these middle quintiles of Late Boomers, simply did not produce the boost to wealth accumulation that it had for previous cohorts, and this changing relationship was the single most important factor. A Great Recession story is good news for future cohorts.
Conclusion
Late Boomers have significantly less wealth than previous cohorts. The question is why. A Oaxaca-Blinder decomposition suggests two factors were at play – a change in the composition of households and a weakening for Late Boomers of the link between work and wealth accumulation.
This is not a tale of the deteriorating status of Black and Hispanic households; indeed, the wealth of non-White households has increased relative to their White counterparts. But Black and Hispanic households have less wealth than White households, so when they increase as a share of the total population, average cohort wealth will decline. Similarly, a decline in the percentage of households married or with a college degree will bring down the average. These changing demographics, along with a decline in work activity, accounted for 29 percent of the total decline.
The rest was attributable to shifting coefficients – the most important of which was the weakened link between work and wealth. This finding is potentially good news for the wealth holdings of future generations. While the demographic/education shifts will continue to bring down the average, these factors were not the major source of the decline. The big change was the weakening of the link between work and wealth accumulation for the Late Boomers who were in their 40s during the Great Recession and never recovered. To the extent that the decline in wealth is a Great Recession story, some of the downward pressure on wealth holdings should abate.
References
Chen, Anqi, Alicia H. Munnell, and Laura D. Quinby. 2023. “Why Do Late Boomers Have So Little Retirement Wealth and How Will Early Gen-Xers Fare?” Working Paper 2023-6. Chestnut Hill, MA: Center for Retirement Research at Boston College.
Health and Retirement Study. 1992-2022. “RAND HRS Longitudinal File 2018 V2 Public Use Dataset.” Produced and Distributed by the University of Michigan with funding from the National Institute on Aging (Grant Number NIA U01AG009740). Ann Arbor, MI.
U.S. Board of Governors of the Federal Reserve System. Survey of Consumer Finances, 1989-2019. Washington, DC.
Endnotes
- 1Chen, Munnell, and Quinby (2023).


Chen, Anqi, Alicia H. Munnell, and Laura D. Quinby. 2023. "What Happened to Late Boomers' Retirement Wealth?" Issue in Brief 23-16. Chestnut Hill, MA: Center for Retirement Research at Boston College.