
Will the Average Retirement Age Keep Rising?

The brief’s key findings are:
- After a century of decline, work activity among older men stabilized in the 1980s and began to rise in the early 1990s.
- This turnaround reflected changes in Social Security, retirement plans, the nature of work, education levels, and health coverage.
- In response, the average retirement age for men rose by about three years to 64.
- In recent years, it has remained relatively stable as the changes that drove the increase have played themselves out.
- Thus, further significant increases in the average retirement age are unlikely.
Introduction
After nearly a century of decline, work activity among older men stabilized in the 1980s and since the early 1990s the average retirement age has increased by about three years. The question is whether the factors that led to the increase over the last 30 years – changes to Social Security, retirement plans, the nature of work, educational attainment, etc. – will continue to push out the retirement age or have they, for the most part, played themselves out.
This discussion proceeds as follows. The first section puts the last 30 years in context by exploring the reasons for the decline in labor force participation of men between 1880 and 1980. The second section looks at the turnaround in labor force participation and the increase in the average retirement age that began in the early 1990s. The third section discusses the factors responsible for this turnaround, and the fourth section assesses the likely future impact of these factors. The final section concludes that the forces leading to increased participation of older workers may well be exhausted, suggesting further increases in the average retirement age are relatively unlikely.
The Long-term Decline in Employment Rates
Prior to the 1880s, men generally worked as long as they could, and at the end of their lives, they had only about two years of ‘retirement,’ often due to ill health.1 (Men are the focus of this early discussion, because shifts in the work patterns of older women have more to do with their changing roles over the 20th century than with their retirement decisions.) Beginning around 1880, the percentage of older men at work began to decline sharply (see Figure 1).
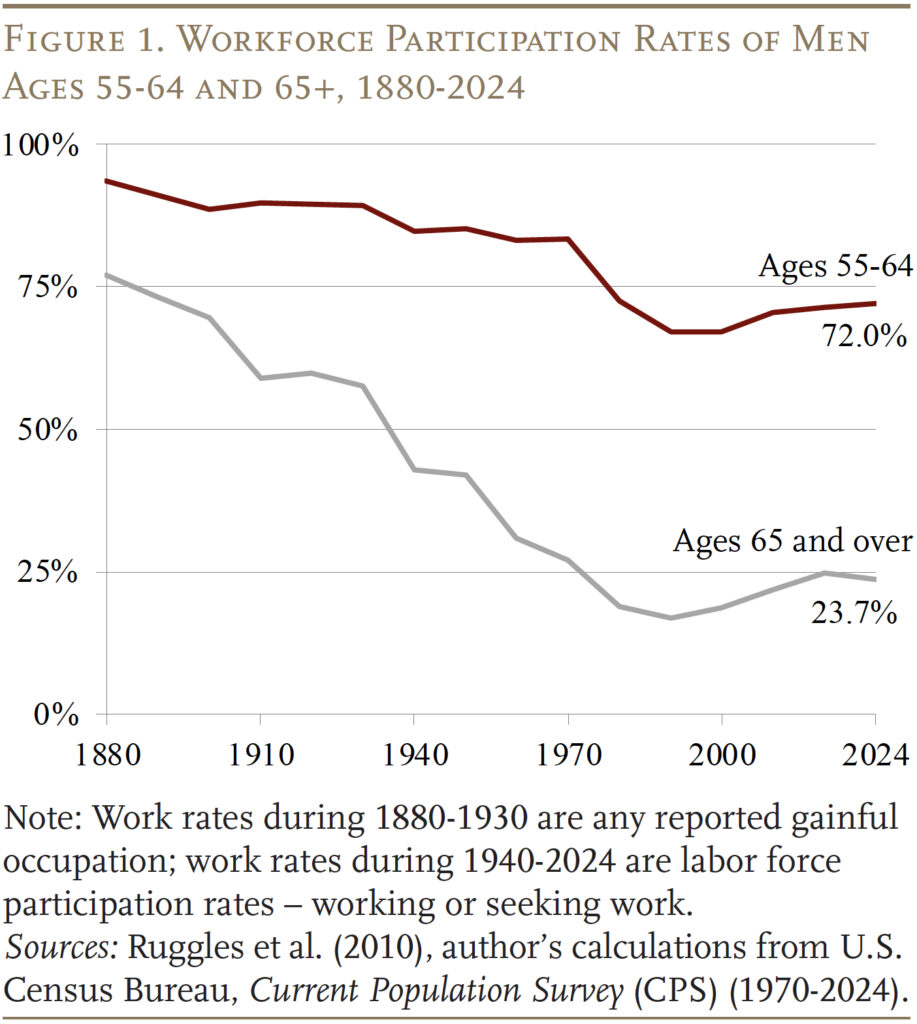
So, why did workforce participation start to drop? Experts attribute this decline to an unexpected and substantial stream of income that appeared in the form of old-age pensions for Civil War veterans. Veterans eligible for these pensions had significantly higher retirement rates than the population at large.2
Interestingly, as the veterans died off, work rates did not return to their previous levels. One explanation is the growth of workers’ incomes, which allowed them to purchase more leisure at the end of their lives.3 But employer attitudes were also becoming important. The U.S. workforce was rapidly shifting from self-employment, most notably in agriculture, to employees of large enterprises. Employers increasingly introduced mandatory retirement ages for their employees. And they were reluctant to hire older workers, especially during the Great Depression.4
The next big decline in the work rates of older men occurred after World War II. One obvious factor was the availability of Social Security benefits, which began in 1940. The postwar period also saw the expansion of employer pensions, as union power grew and corporations increasingly recognized pensions as a crucial component of their personnel systems.
The introduction of Medicare in 1965 and the sharp increase in Social Security benefits in 1972 probably led to the final leg of the decline in workforce activity of older men. And, because benefits were available at age 62, Social Security may also explain part of the decline in workforce activity for men ages 55-64.
The Turnaround
The downward trajectory stopped around the mid-1980s and, since the early 1990s, the labor force participation of men both 55-64 and 65+ has gradually increased. This pattern has led to an increase in the “average retirement age.” The discussion begins by continuing with the focus on men, and then turns to the more complicated story for women.
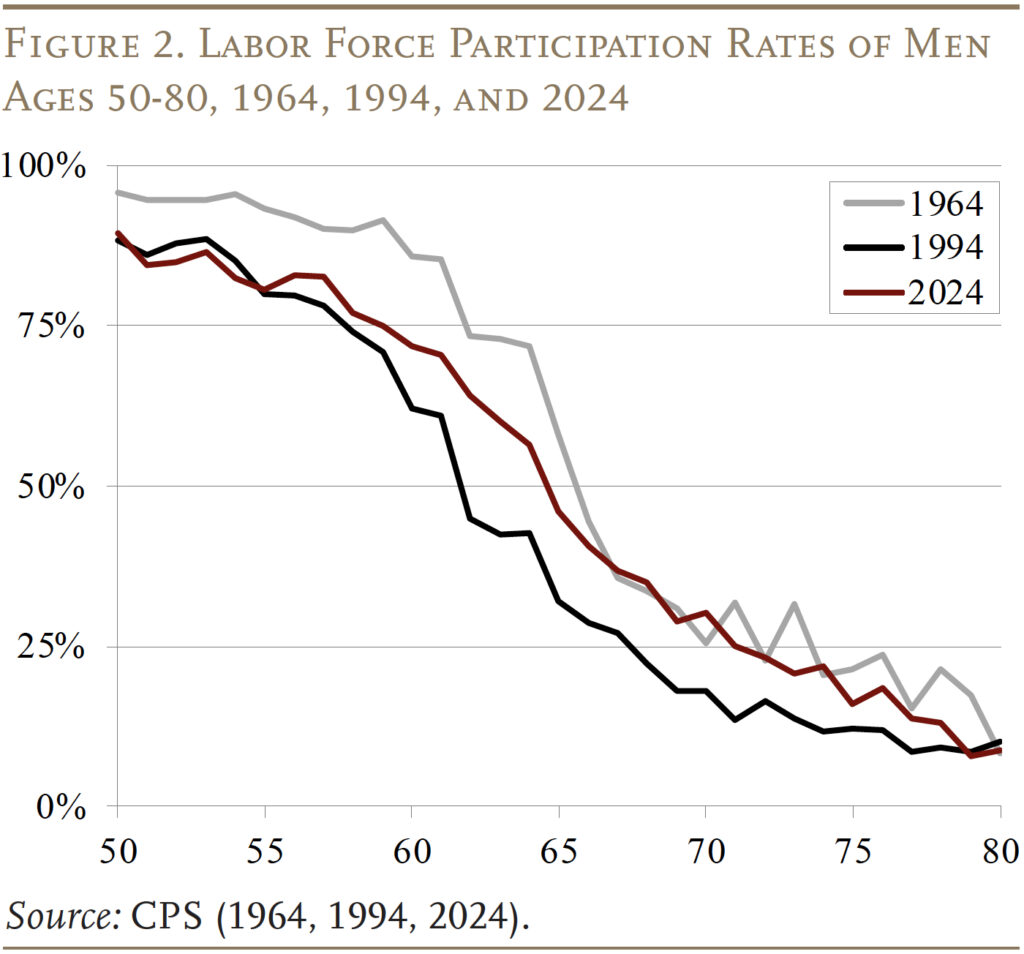
To put the magnitude of the turnaround in perspective, it is useful to look at labor force participation rates in three different years: 1964 – before the “reversal;” 1994 – about the time the reversal began; and 2024 – the most recent observation. The most striking change is that labor force participation in 2024 was higher at almost any age than it was in 1994 (see Figure 2). The relationship between 2024 and 1964 is also interesting. At older ages, 2024 participation for men looks very similar to that in 1964. In contrast, participation between ages 50 and 65 is dramatically lower in 2024 than in 1964.
These data on labor force participation can be used to construct a measure of the average retirement age, defined as the age (in years and months) at which the labor force participation rate drops below 50 percent.5 Based on this definition, in 2024 the average retirement age for men was 64.6, three years later than 1994 and almost back to the 1960s (see Figure 3).
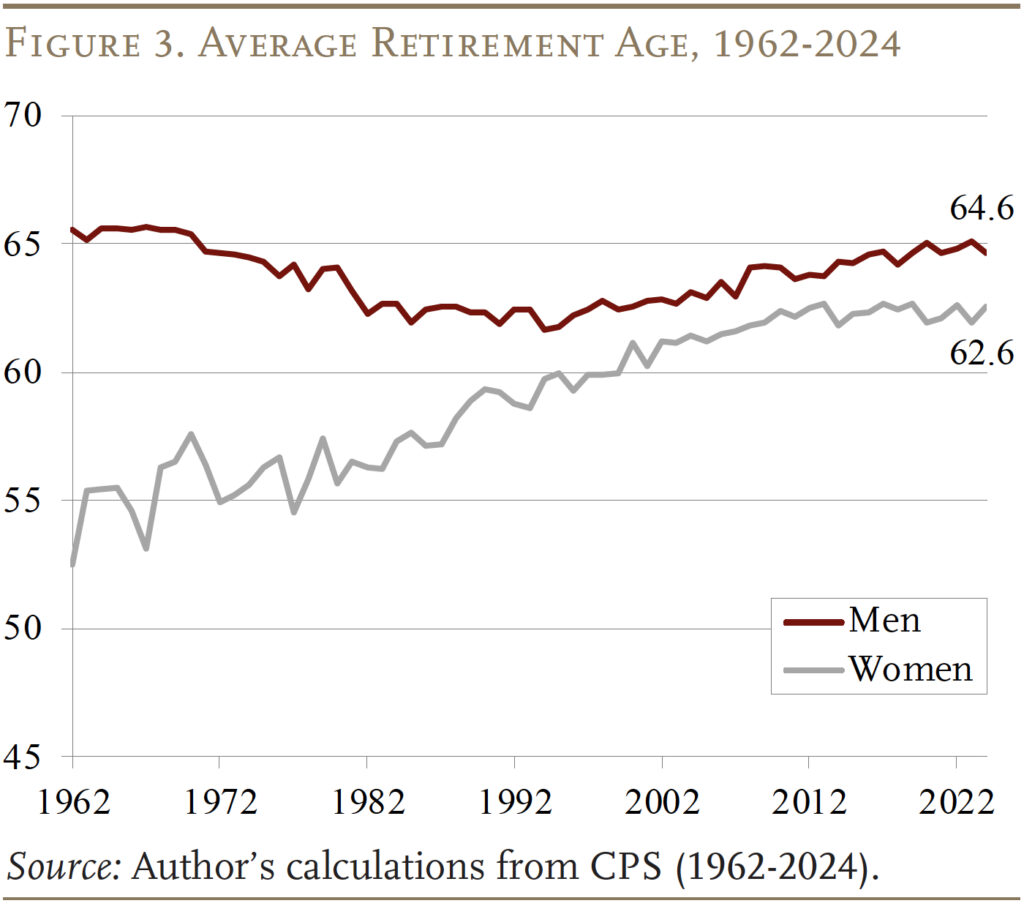
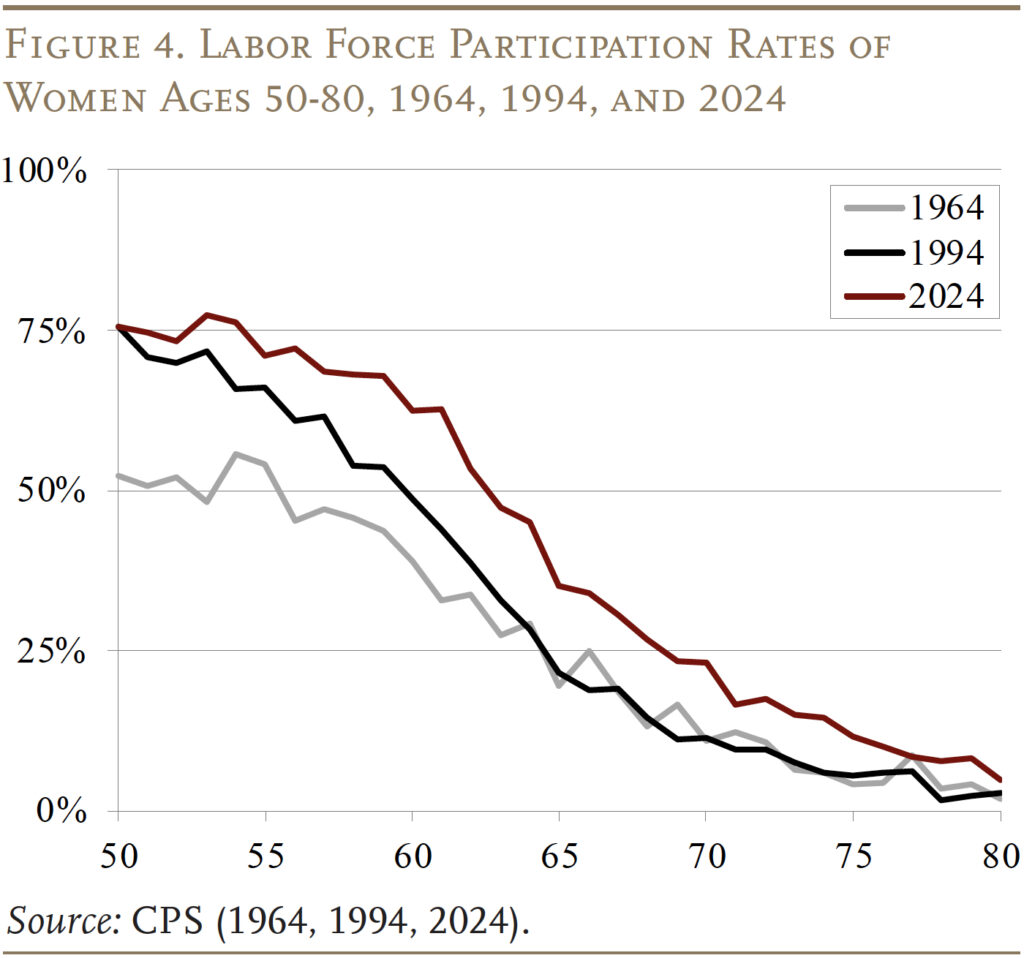
Figure 3 also shows the average retirement age for women. Over the 20th century each cohort of women had spent more time in the labor force than the previous cohort, increasing the likelihood that they would be working at older ages. Indeed, the participation rate data show work activity among older women increasing steadily from 1964 to 1994 to 2024 (see Figure 4).
The changing work lives of women make it difficult to interpret trends in their average retirement age. Figure 3 suggests that the retirement age for women rose dramatically from about 55 in the 1960s to 62.6 in 2024. Of course, the apparent low retirement ages in the early 1960s simply reflect the fact that fewer women had spent much time in the labor force. In recent years, the average retirement age for women appears to have stabilized. The questions are, for both men and women, why did the increase in the average retirement age occur and where do we go from here?
Reasons for the Turnaround
As noted, the downward trajectory stopped around the mid-1980s and, since the early 1990s, the labor force participation of men both 55-64 and 65+ has gradually increased. Many factors help explain this turnaround.6
- Social Security: Changes to Social Security made work more attractive relative to retirement. The liberalization, and for those at the Full Retirement Age (FRA) the elimination, of the earnings test removed what many viewed as an impediment to continued work.7 The increase in the FRA from 65 to 67 reduced benefits for those claiming early. And, the enhanced delayed retirement credit increased incentives to keep working between the FRA and age 70.8 One recent estimate suggests these changes were responsible for about one-fifth of the increase in work for those ages 65-69.9 Clearly other factors also played a role.
- Pension type: The shift from defined benefit to 401(k) plans eliminated built-in incentives to retire.10 Moreover, since 401(k) participants bear investment risk, they need to work longer to accumulate a buffer against prematurely exhausting their resources. Studies show that workers covered by 401(k) plans retire a year or two later on average than similarly situated workers covered by a defined benefit plan.11
- Education: Education is a key determinant of worker productivity. Better-educated workers have less physically demanding jobs, more employment opportunities, are paid more, and work longer. Between 1985 and 2015, the share of older workers with college degrees increased sharply, and the educational gap between older and prime-age men largely disappeared. The movement of large numbers of men up the educational ladder helps explain the increase in participation rates of older men.12
- Improved health and longevity: Average life expectancy for men at 65 has increased about 3.2 years since 1990, and until 2010 the evidence suggested that people were healthier as well.13 The correlation between health and labor force activity is very strong, meaning that the increase in disability-free life expectancy would have contributed to the increased labor force activity of older men.
- Decline of retiree health insurance: The rapid rise in healthcare costs has been accompanied by a significant decline in employer provision of retiree health insurance. This decline has dramatically changed the incentives facing older workers. If they stay with their employer, they continue to receive health insurance; if they leave before 65, when they qualify for Medicare, they are forced to purchase insurance on their own. Hence, workers have a strong incentive to stay working until they qualify for Medicare.14
- Less physically demanding jobs: The nature of employment has also changed dramatically since the mid-1980s. As manufacturing has declined, the service sector has exploded with knowledge-based opportunities. Even within manufacturing the nature of jobs has changed, as firms have automated and outsourced production and employed more managers, engineers, and technicians. The new jobs put less strain on older bodies.15
- Joint decision-making: The increased percentage of married women working means the decision to retire involves both spouses. Studies suggest that husbands and wives like to coordinate their retirement.16 Since wives on average are three years younger than their husbands, if they retire at age 62 (when first eligible to claim Social Security), it would push husbands’ retirement age toward 65.17
- Non-pecuniary factors: Older workers tend to be among the more educated, the healthiest, and the wealthiest.18 Their wages are lower than those earned by their younger counterparts and lower than their own past earnings. This pattern suggests that money may not be the only motivator.
As a result of these various factors, the workforce activity of men has increased substantially since 1990. The question is how this trend translates into changes in the average retirement age.
Where Do We Go from Here?
The question is whether the early drivers of delayed retirement – changes to Social Security, the shift from defined benefit to 401(k) plans, the increase in educational attainment, improvements in healthy life expectancy, and the decline in retiree health insurance – will continue to have a substantial impact leading to increases in the average retirement age going forward.
Social Security. All the changes in the Social Security program are now complete. No further adjustments have been made to the earnings test. The increase in the FRA from 65 to 67 was gradually phased in, beginning with those born in 1938 and ending at 67 with those born in 1960. Those born in 1960 turn 65 this year; thus, future cohorts will see no further increase in the FRA.19 Finally, the delayed retirement credit – payable for those who claim benefits between the FRA and 70 – was also increased gradually, from 3 percent in 1983 to 8 percent in 2008. Hence, future cohorts will see no further increase in this incentive. In short, recent changes to Social Security should have no effect on the average retirement age going forward.
Pension Type. The shift from defined benefit to 401(k) plans is now complete. Yes, some defined benefit plans continue to exist in the public sector, but state and local workers account for only about 10 percent of the workforce and no major shift in pension type is currently underway for this group.
Educational Attainment. Much of the gain in the labor force participation of older individuals has been attributed to their increased educational attainment.20 Indeed, for most of the 20th century each generation of workers received more education than the previous one. As a result, the share of men ages 50-54 with a college degree increased sharply. However, in the mid-1970s the pace of gains slowed, which meant that the percentage of men 50-54 with a college degree stopped increasing around 2000. Since then the share with a college degree has declined and rebounded, but remains roughly at the 2000 level. For women, the improvement in educational attainment has continued – after a decade-long pause – but will likely level off by 2030.21 The bottom line is that educational gains are unlikely to be a major driver of longer work lives going forward.
Increase in Healthy Life Expectancy. Until 2005, the trend of rising disability-free life expectancy suggested increased capacity for work, but recent studies suggest this progress has stalled.22 Estimates of healthy life expectancy at 50 – which combines the disability rate with changes in life expectancy – showed actual declines for lower-educated white workers and lower-educated Black men. Hence, substantial increases in the ability to work longer is unlikely to move the average retirement age in coming decades.
Decline in Retiree Health Insurance. As noted, the decline in employer-provided health insurance combined with rapidly rising healthcare costs has pushed workers to postpone retirement until they are eligible for Medicare. This shift away from offering retiree health benefits is virtually complete. Less than 20 percent of large firms – 200 or more employees – offer retiree health insurance to current workers. Smaller firms traditionally have rarely provided this benefit.23 Thus, changing employer-provided health benefits will no longer provide an increasing incentive to work until 65.
The bottom line is that the factors contributing to the reversal in the labor force participation of older workers appear to have run their course. Their impact will remain, so it is unlikely the average retirement age will decline. On the other hand, they will provide little impetus for increases in the average retirement age.24
Conclusion
After nearly a century of decline, work activity among older men stabilized in the 1980s and began to increase in the 1990s. This turnaround reflected changes in Social Security, retirement plans, and the nature of work, improvements in educational attainment, the need to wait for Medicare coverage, and a number of other factors. In response, the average retirement age increased by about three years.
It is important to put this three-year gain in perspective. The average retirement age is still lower than it was when Medicare was enacted. And the major drivers for the gains to date appear to have played themselves out, making significant future increases in the average retirement age unlikely. In short, the gains to date in working longer have been great, but we probably have gone as far as we can go without some new development to change people’s incentives.
References
Blau, David M. and Ryan M. Goodstein. 2010. “Can Social Security Explain Trends in Labor Force Participation of Older Men in the United States?” Journal of Human Resources 45(2): 32-63.
Burtless, Gary. 2013. “The Impact of Population Aging and Delayed Retirement on Workforce Productivity.” Working Paper 2013-11. Chestnut Hill, MA: Center for Retirement Research at Boston College.
Burtless, Gary and Joseph F. Quinn. 2002. “Is Working Longer the Answer for an Aging Workforce?” Issue in Brief 11. Chestnut Hill, MA: Center for Retirement Research at Boston College.
Coile, Courtney. 2025. “Changing Retirement Incentives and Retirement in the US.” In Social Security Programs and Retirement around the World: The Effects of Reforms on Retirement Behavior, edited by Axel Borsch-Supan and Courtney Coile, 401-418. Chicago, IL: University of Chicago Press.
Coile, Courtney. 2021. “The Evolution of Retirement Incentives in the U.S.” In Social Security Programs and Retirement around the World: Reforms and Retirement Incentives, edited by Axel Börsch-Supan and Courtney Coile, 435-459. Chicago, IL: University of Chicago Press.
Coile, Courtney. 2015. “Economic Determinants of Workers’ Retirement Decisions.” Journal of Economic Surveys 29(4): 830-853.
Cosic, Damir and C. Eugene Steuerle. 2021. “The Effect on Early Claiming Benefit Reduction on Retirement Rates.” Working Paper 2021-1. Chestnut Hill, MA: Center for Retirement Research at Boston College.
Costa, Dora L. 1998. The Evolution of Retirement: An American Economic History, 1880-1990. Chicago, IL: University of Chicago Press.
Engelhardt, Gary V. and Anil Kumar. 2007. “The Repeal of the Retirement Earnings Test and the Labor Supply of Older Men.” Working Paper 2007-1. Chestnut Hill, MA: Center for Retirement Research at Boston College.
Friedberg, Leora. 2007. “The Recent Trend Towards Later Retirement.” Work Opportunities for Older Americans Series 9. Chestnut Hill, MA: Center for Retirement Research at Boston College.
Friedberg, Leora and Anthony Webb. 2006. “Persistence in Labor Supply and the Response to the Social Security Earnings Test.” Working Paper 2006-27. Chestnut Hill, MA: Center for Retirement Research at Boston College.
Friedberg, Leora and Anthony Webb. 2005. “Retirement and the Evolution of Pension Structure.” Journal of Human Resources 40(2): 281-308.
Gustman, Alan L. and Thomas Steinmeier. 2009. “How Changes in Social Security Affect Recent Retirement Trends.” Research on Aging 31(2): 261-290.
Gustman, Alan and Thomas Steinmeier. 1994. “Employer-Provided Health Insurance and Retirement Behavior.” Industrial and Labor Relations Review 48(1): 124-140.
Johnson, Richard. 2004. “Trends in Job Demands among Older Workers, 1992-2009.” Monthly Labor Review 127(7): 48-56.
Kaiser Family Foundation. Employer Health Benefits Survey, 2021. San Francisco, CA.
Karoly, L. A. and J. A. Rogowski. 1994. “The Effect of Access to Postretirement Health Insurance on the Decision to Retire Early.” Industrial and Labor Relations Review 48(1): 103-123.
Kopczuk, Wojciech and Jae Song. 2008. “Stylized Facts and Incentive Effects Related to Claiming of Retirement Benefits Based on Social Security Administration Data.” Working Paper WP-2008-200. Ann Arbor, MI: University of Michigan Retirement Research Center.
Lahey, Karen E., Doseong Kim, and Melinda L. Newman. 2006. “Full Retirement? An Examination of Factors That Influence the Decision to Return to Work.” Financial Services Review 15(1): 1-19.
Maestas, Nicole. 2005. “Back to Work: Expectations and Realizations of Work after Retirement.” Working Paper WR-196-1. Santa Monica, CA: RAND.
Margo, Robert A. 1993. “The Labor Force Participation of Older Americans in 1900: Further Results.” Explorations in Economic History 30(3): 409-423.
Mastrobuoni, Giovanni. 2009. “Labor Supply Effects of the Recent Social Security Benefit Cuts: Empirical Estimates Using Cohort Discontinuities.” Journal of Public Economics 93(11): 1224-1233.
Michaud, Pierre-Carl, Arthur van Soest, and Luc Bissonnette. 2018. “Understanding Joint Retirement.” Working Paper 25030. Cambridge, MA: National Bureau of Economic Research.
Moen, Jon R. 1987. “Essays on the Labor Force and Labor Force Participation Rates: The United States from 1860 through 1950.” Ph.D. Dissertation. Chicago, IL: University of Chicago.
Monk, Courtney and Alicia H. Munnell. 2009. “The Implications of Declining Retiree Health Insurance.” Working Paper 2009-15. Chestnut Hill, MA: Center for Retirement Research at Boston College.
Munnell, Alicia H. 2022. “How to Think About Recent Trends in the Average Retirement Age.” Issue in Brief 22-11. Chestnut Hill, MA: Center for Retirement Research at Boston College.
Munnell, Alicia H., Kevin E. Cahill, and Natalia Jivan. 2003. “How Has the Shift to 401(k)s Affected the Retirement Age?” Issue in Brief 13. Chestnut Hill, MA: Center for Retirement Research at Boston College.
Munnell, Alicia H. and Steven A. Sass. 2008. Working Longer: The Solution to the Retirement Income Challenge. Washington, DC: Brookings Institution Press.
Quinby, Laura D. and Gal Wettstein. 2021. “Are Older Workers Capable of Working Longer?” Working Paper 2021-8. Chestnut Hill, MA: Center for Retirement Research at Boston College.
Ruggles, Steven, J. Trent Alexander, Katie Genadek, Ronald Goeken, Matthew B. Schroeder, and Matthew Sobek. 2010. Integrated Public Use Microdata Series: Version 5.0 [Machine-readable database]. Minneapolis, MN: University of Minnesota.
Rust, John and Christopher Phelan. 1997. “How Social Security and Medicare Affect Retirement Behavior in a World of Incomplete Markets.” Econometrica 65(4): 781-831.
Rutledge, Matthew S., Christopher M. Gillis, and Anthony Webb. 2015. “Will the Average Retirement Age Continue to Increase?” Working Paper 2015-16. Chestnut Hill, MA: Center for Retirement Research at Boston College.
Sass, Steven A. 1997. The Promise of Private Pensions: The First Hundred Years. Cambridge, MA: Harvard University Press.
Schirle, Tammy. 2007. “Why Have the Labour Force Participation Rates of Older Men Increased since the Mid-1990s?” Working Paper. Waterloo, ON: Wilfrid Laurier University, Department of Economics.
Song, Jae and Joyce Manchester. 2007. “Have People Delayed Claiming Retirement Benefits? Responses to Changes in Social Security Rules.” Social Security Bulletin 67(2): 1-23.
Thane, Pat. 2000. Old Age in English History: Past Experiences, Present Issues. Oxford, UK: Oxford University Press.
U.S. Census Bureau. Current Population Survey, 1962-2024. Washington, DC: U.S. Government Printing Office.
U.S. Social Security Administration. 2024. The 2024 Annual Report of the Board of Trustees of the Federal Old-Age and Survivors Insurance and Federal Disability Insurance Trust Funds. Washington, DC: U.S. Government Printing Office.
Endnotes
- Thane (2000) and Sass (1997). ↩︎
- Costa (1998). ↩︎
- Costa (1998). ↩︎
- Moen (1987), Margo (1993), and Sass (1997). ↩︎
- This methodology evolved from that of Burtless and Quinn (2002) who take the youngest age, in years, at which at least half of men have left the labor force. They calculate the labor force participation rate by age and average over two-year periods (e.g., 1962 and 1963). Our calculations differ in that the results are annual and interpolated to calculate the age in terms of years and months; and we take the age at which at least half of men (or women) are consistently out of the labor force. ↩︎
- Coile (2015), Friedberg (2007), Burtless and Quinn (2002), and Munnell and Sass (2008). ↩︎
- Engelhardt and Kumar (2007) and Friedberg and Webb (2006). ↩︎
- Cosic and Steuerle (2021), Blau and Goodstein (2010), Gustman and Steinmeier (2009), Mastrobuoni (2009), Song and Manchester (2007), and Kopczuk and Song (2008). ↩︎
- Coile (2025). ↩︎
- Coile (2021). ↩︎
- Friedberg and Webb (2005) and Munnell, Cahill, and Jivan (2003). ↩︎
- Burtless (2013) and Munnell and Sass (2008). ↩︎
- U.S. Social Security Administration (2024), Quinby and Wettstein (2021), and Munnell and Sass (2008). ↩︎
- Gustman and Steinmeier (1994), Karoly and Rogowski (1994), Rust and Phelan (1997), and Monk and Munnell (2009). ↩︎
- Johnson (2004). ↩︎
- Michaud, van Soest, and Bissonnette (2018). ↩︎
- Schirle (2007). ↩︎
- Lahey, Kim, and Newman (2006) and Maestas (2005). ↩︎
- Beginning with the 1938 cohort, the FRA increased by two months per year until it reached age 66 for the 1943 cohort. The FRA continued to increase until reaching age 67 for people born in 1960 and later, again with the increase phased in by two-month increments beginning for those born in 1955. ↩︎
- Burtless (2013). ↩︎
- Munnell (2022). Looking at younger individuals today, the share of men and women (combined) with a college degree is similar to today’s 50-year-olds. ↩︎
- Quinby and Wettstein (2021). ↩︎
- Kaiser Family Foundation (2021). ↩︎
- Rutledge, Gillis, and Webb (2015) projected that the average retirement age would continue to rise by about one additional year in total over the course of a few decades. To the extent that this projection proves accurate, a portion of this impact would have already occurred, and any continued increase would be modest. ↩︎


Munnell, Alicia H.. 2025. "Will the Average Retirement Age Keep Rising?" Issue in Brief 25-8. Chestnut Hill, MA: Center for Retirement Research at Boston College.