
All the Single Ladies: When It Comes to Financial Planning, Women Should Anticipate Spending More Time on Their Own

Alicia H. Munnell is a columnist for MarketWatch and senior advisor of the Center for Retirement Research at Boston College.
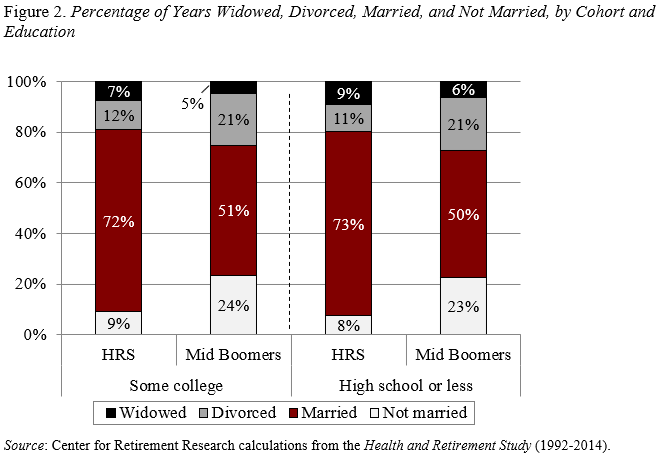
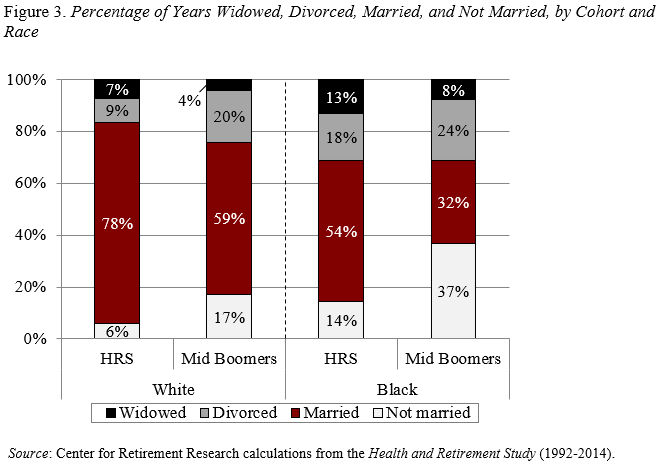
Pattern is steady across education levels but varies dramatically by race.
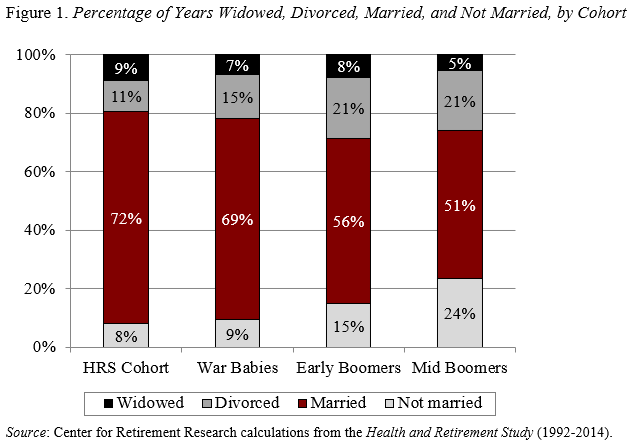
As I discussed earlier this year, people are often interested in studying the saving behavior of women. I have generally resisted this approach because women have traditionally lived in households where the couple makes decisions jointly. In that world, the main distinction is between married women and single women, not between women and men. But a quick tally using the Health and Retirement Study (HRS) showed that the percentage of adult years that women spend married has declined sharply over time.
We have now done a more thorough study of this issue that allowed us to identify the factors leading to this change and how the pattern varies by education and race. The analysis focuses on the change in marriage patterns over four birth cohorts: 1) the original HRS Cohort (born 1931-1941); 2) the War Babies (1942-1947); the Early Boomers (1948-1953); and 4) the Mid Boomers (1954-1959).
How did this dramatic change come about? First, the average age of first marriage rose by about three years between the HRS cohort and the Mid Boomers. Second, more women never marry. And third, more women get divorced. The impact of these changing patterns on the percentage of years that women spend married is shown in Figure 1. The substantial increase in years spent either divorced or “not married” (prior to a first marriage or because the individual never got married) has reduced the share of years married from 72 percent to 51 percent.
The pattern by educational attainment looks very similar across the two groups (see Figure 2). For both those with some college education and those with a high school degree or less, the percentage of years spent married declined from about 70 percent to about 50 percent between the HRS and Mid Boomer cohorts. The increase in the percentage of years not married or divorced was consistent across educational groups.
In contrast, the percentage of years married looks very different for white and black women, although both groups have seen a big decline (see Figure 3). Three differences are worth noting. First, black women have always spent a smaller percentage of years married than white women. Second, the decline in the percentage of years married is greater for black women than white women. Third, whereas white women saw a more than doubling of years spent divorced, black women experienced a much larger increase than white women in the percentage of years not married.
The bottom line is that women as a group are going to spend less than half of their adult years as part of a couple. This pattern reflects an increase in age at first marriage, a decline in marriage rates, and an increase in divorce. It shows up across race and educational attainment. This change has significant implications for financial planning.