
How Much Do Retirees Spend on Uncertain Health Costs?

Introduction
One source of financial risk that older Americans face is high health care expenses. Although the largest share of these expenses is due to predictable insurance premiums, retirees can pay sizable additional out-of-pocket costs as well.1McInerney, Rutledge, and King (2017). Medicare and Medicaid help reduce this risk, but Medicare does not cover every expense and Medicaid covers only households with very low income and assets. Thus, better understanding the extent of this coverage and the remaining burden on individuals is an important issue for retirees and policymakers alike.
This brief is based on a recent paper that addresses the following question: How much do retirees pay in lifetime out-of-pocket health costs, excluding premiums and including long-term care?2Arapakis et al. (2021). The analysis proceeds in two steps. It first calculates the distribution and evolution of total non-premium health care spending over the lifecycle of retired households. It then determines the amount covered by public and private insurers and subtracts this portion from the total to obtain out-of-pocket spending. By focusing on lifetime totals, this brief captures not only the risk of high expenses in a single year, but also the risk of moderate but persistent expenses that add up to a high cost burden over time.
The discussion proceeds as follows. The first section provides a brief background on health care spending and insurance programs. The second section describes the data and methodology. The third section presents the results: total spending on health services, the portion covered by insurance, and what retirees pay out-of-pocket. The final section concludes that lifetime health care spending by retirees above and beyond predictable premiums is high and uncertain. However, Medicare, Medicaid, and other insurers cover a large portion of these expenditures. As a result, 65-year-old households pay, on average, $67,260 in out-of-pocket costs over their remaining lifetime, which is about one-fifth of total non-premium costs. Households at the 90th percentile of the health spending distribution pay twice this amount out-of-pocket, though it represents a similar share of the total.
Background
Health care spending rises with age and income, posing a potentially substantial burden for many retirees. Previous research has linked high retiree health expenses to extreme outcomes, such as bankruptcy, and has identified precautionary behaviors by some retirees to try to mitigate risk, such as more savings by high-income households and less annuitization.3Bankruptcy has been cited as a way to self-insure against high uncertain out-of-pocket health spending (Livshits, MacGee, and Tertilt 2007). Health spending can help explain the savings patterns of high-income households (Brown and Finkelstein 2008) and savings decumulation patterns (De Nardi, French, and Jones 2010). Due to the uncertainty of health spending, annuities might leave individuals without sufficient liquidity (Reichling and Smetters 2015). Of course, Medicare, Medicaid, and other insurers do provide coverage that reduces the burden and the uncertainty faced by retirees. Overall, though, little is known about the magnitude of total lifetime health spending, how much insurance covers, and the resulting out-of-pocket costs to retirees.
Data and Methodology
To capture detailed household characteristics and all health care payors – individuals, public insurers, and private insurers – this analysis combines data from three sources. The first is the Health and Retirement Study (HRS), which is a nationally representative, biennial longitudinal survey of people over age 50 and their spouses. It started in 1992 and asks a wide range of questions, including education, income, wealth, health, cognition, and demographics.
The second source is administrative Medicare and Medicaid records. The Centers for Medicare and Medicaid Services (CMS) have confidential administrative spending records for Medicare (Parts A, B, and D) and Medicaid that can be linked to the HRS survey responses if participants consent. The most recent year for which both Medicare and Medicaid data can be merged to the HRS is 2012.
While the HRS contains accurate measures of out-of-pocket health care spending and can be linked to Medicare and Medicaid records, it does not contain information on the payments made by Medicare Part C (i.e., Medicare Advantage plans) and by private and smaller public insurers.4These other insurers include the Veterans Administration health system, the Indian Health Service, local and state health departments, and automobile and homeowners insurance.
To fill this gap, the analysis uses a third source – the Medical Expenditure Panel Survey (MEPS). Data from this nationally representative survey of non-institutionalized households are used to impute payments by these other insurers.
By combining all three sources, the resulting dataset provides a panel of households for 1999-2012, with detailed demographic information and expenditures (excluding premiums) from all payors. Of course, these amounts only capture annual spending during this time period.
To capture the distribution of total and out-of-pocket spending over the full span of retirement, the analysis proceeds in two steps. In the first step, a flexible health care spending model is estimated. In the second step, total health care spending is broken down by payor (i.e., insurers vs. out-of-pocket).
In terms of the health care spending model, spending can be explained by observed or unobserved factors.5Webb and Zhivan (2010) use a similar model of out-of-pocket spending. In their framework, the variation in spending is due to variation in observed characteristics; there are no residual shocks to reflect variation in unobserved factors.
First, the spending explained by observed factors is modeled as:
spending = f(demographics, health, age, marital status, lifetime income) +ƞ
Next, recent advances in methodology are used to estimate the remaining part of health care spending (ƞ), that is due to unobserved factors.6Arellano, Blundell, and Bonhomme (2017) develop a flexible framework that encompasses the AR(1) plus white noise spending model of French and Jones (2004) as a special subcase. Arellano et al. (2022) propose a more stable estimation algorithm for this
general framework.
ƞ = transitory spending + persistent spending
This method decomposes the part of health care spending due to unobserved factors into two parts. The first part is a transitory component that reflects health care expenses due to unobserved factors that do not significantly affect future health care spending (e.g., arm fracture). The second part is a persistent component that reflects unobserved factors that affect the level and evolution of health care spending over time (e.g., factors that contribute to the development of dementia). The persistent component depends on age, past health care spending, and a random shock. Hence, it reflects changes in the steadiness of health spending depending on the household’s characteristics (e.g., a very old household with high health spending is more likely to have high spending next year, compared to a younger household). Thus, this flexible model can account accurately for not only the risk of large expenses in a single year, but also the risk of moderate but persistent expenses that accumulate into a burdensome lifetime cost.7For more details on the methodology, see the full
paper (Arapakis et al. 2021).
The model is then used to simulate household histories for total non-premium health care spending. These histories capture the spending of every household in the HRS until every member is dead. The analysis then produces the distribution of total lifetime health care spending among households.
8With this information in hand, the remaining step is to allocate total health care spending for each household to different payors. This version of the paper abstracts from a complex procedure to map total health spending to out-ofpocket spending. Instead it applies the value of 22 percent of the total that is observed in the data.
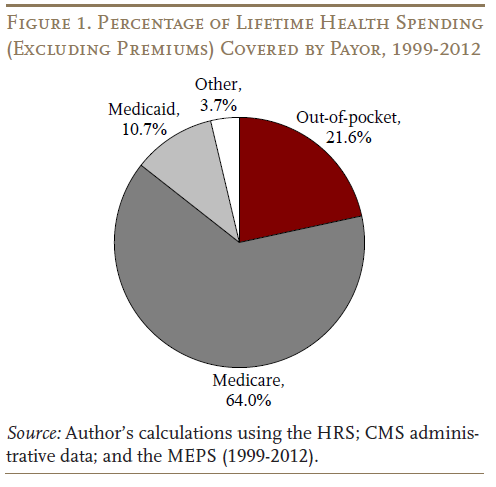
This procedure determines the average share that is paid out-of-pocket and the share that is covered by all other payors. Specifically, Medicare pays nearly two thirds of the costs for all households; Medicaid chips in about one-tenth; and other insurers play a small role (see Figure 1 on the next page). Overall, insurers cover the lion’s share – nearly four-fifths of total non-premium health care spending, with households paying the remaining fifth out-of-pocket.
Results
The model generates both the total level of health care spending incurred by retirees and the extent to which insurance programs cover these costs. The results are presented for the mean and the 90th percentile at ages 65 and 90, in order to succinctly capture both the typical and tail risk.
Annual health care spending (excluding premiums) rises with age. For example, mean spending on health services for retirees grows from $21,400 per year at age 65 to $36,600 at age 90 (see Table 1). The upper tail also rises quickly, with the health care spending for the 90th percentile increasing from $43,500 to $79,900.
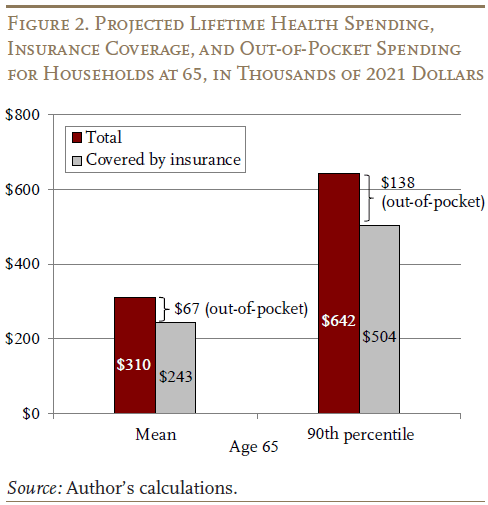
The focus, however, is spending risk throughout the retirement period. Therefore, at each age, the present discounted value of remaining lifetime spending is calculated, using an annual real discount rate of 3 percent. At age 65, households will incur, on average, $310,000 in health care spending over the remainder of their lives.9Note that total spending does not include uncompensated care, which is the amount defaulted by households or their health insurance payors.
However, $243,000 is covered by insurance, resulting in out-of-pocket spending of $67,000 (see Figure 2). The 90th percentile of the spending distribution shows a similar pattern, resulting in out-of-pocket costs of $138,000.
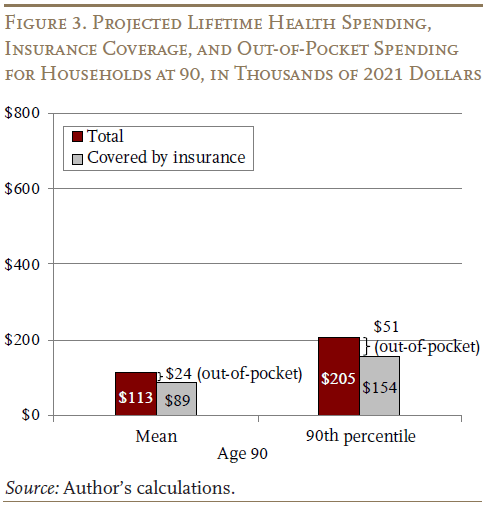
At age 90, the results similarly show that the costs double between the average and the 90th percentile, with insurance covering the bulk of spending. For example, total spending, on average, is $113,000 compared to $205,000 for the 90th percentile (see Figure 3 on the next page). After insurance is factored in, out-of-pocket costs are $24,000 and $51,000, respectively.
One final point is that projected remaining lifetime spending at age 90 is still about one-third of the amount at age 65. One reason for this relatively slow decline in remaining spending as people age is that, even though those who survive to 90 typically have fewer remaining years of life, they are still more likely to live to very old ages when health care spending is higher.
Conclusion
Lifetime health care spending for retired households is high and uncertain. However, Medicare, Medicaid, and other insurers cover the lion’s share of total spending. In terms of out-of-pocket spending, households cover about 22 percent of the total – $67,260, on average for a 65-year-old household. At the 90th percentile, the out-of-pocket costs are twice as high, though this amount represents a similar share of the total. Thus, while out-of-pocket spending does pose a significant risk for households with high health care expenses, these results clearly highlight the importance of public insurance programs for reducing that risk.
References
Arapakis, Karolos, Eric French, John Bailey Jones, and Jeremy McCauley. 2021. “On the Distribution and Dynamics of Medical Expenditure Among the Elderly.” Working Paper 2021-436. Ann Arbor, MI: The University of Michigan Retirement and Disability Research Center.
Arellano, Manuel, Richard Blundell, and Stephane Bonhomme. 2017. “Earnings and Consumption Dynamics: A Nonlinear Panel Data Framework.” Econometrica 85: 693-734.
Arellano, Manuel, Richard Blundell, Stephane Bonhomme, and J. Light. 2022. “Heterogeneity of Consumption Responses to Income Shocks in the Presence of Nonlinear Persistence.” Unpublished manuscript.
Brown, Jeffrey R. and Amy Finkelstein. 2008. “The Interaction of Public and Private Insurance: Medicaid and the Long-Term Care Insurance Market.” American Economic Review 98(3): 1083-1102.
Centers for Medicare and Medicaid Services. 1999-2012. CMS Research Files created by the Medicare & Medicaid Resource Information Center (MedRIC). Baltimore, MD.
De Nardi, Mariacristina, Eric French, and John B. Jones. 2010. “Why Do the Elderly Save? The Role of Medical Expenses.” Journal of Political Economy 118(1): 39-75.
French, Eric and John Bailey Jones. 2004. “On the Distribution and Dynamics of Health Care Costs.” Journal of Applied Econometrics 19(6): 705-721.
Livshits, Igor, James MacGee, and Michèle Tertilt. 2007. “Consumer Bankruptcy: A Fresh Start.” American Economic Review 97(1): 402-418.
McInerney, Melissa, Matthew S. Rutledge, and Sara Ellen King. 2017. “How Much Does Out-of-Pocket Medical Spending Eat Away at Retirement Income?” Working Paper 2017-13. Chestnut Hill, MA: Center for Retirement Research at Boston College.
Reichling, Felix and Kent Smetters. 2015. “Optimal Annuitization with Stochastic Mortality and Correlated Medical Costs.” American Economic Review 105(11): 3273-3320.
University of Michigan. Health and Retirement Study, 1999-2012. Ann Arbor, MI.
U.S. Department of Health and Human Services. Medical Expenditure Panel Survey, 1996-2017. Rockville, MD: Agency for Healthcare Research and Quality.
Webb, Anthony and Natalia A. Zhivan. 2010. “How Much is Enough? The Distribution of Lifetime Health Care Costs.” Working Paper 2010-1. Chestnut Hill, MA: Center for Retirement Research at Boston College.
Endnotes
- 1McInerney, Rutledge, and King (2017).
- 2Arapakis et al. (2021).
- 3Bankruptcy has been cited as a way to self-insure against high uncertain out-of-pocket health spending (Livshits, MacGee, and Tertilt 2007). Health spending can help explain the savings patterns of high-income households (Brown and Finkelstein 2008) and savings decumulation patterns (De Nardi, French, and Jones 2010). Due to the uncertainty of health spending, annuities might leave individuals without sufficient liquidity (Reichling and Smetters 2015).
- 4These other insurers include the Veterans Administration health system, the Indian Health Service, local and state health departments, and automobile and homeowners insurance.
- 5Webb and Zhivan (2010) use a similar model of out-of-pocket spending. In their framework, the variation in spending is due to variation in observed characteristics; there are no residual shocks to reflect variation in unobserved factors.
- 6Arellano, Blundell, and Bonhomme (2017) develop a flexible framework that encompasses the AR(1) plus white noise spending model of French and Jones (2004) as a special subcase. Arellano et al. (2022) propose a more stable estimation algorithm for this
general framework. - 7For more details on the methodology, see the full
paper (Arapakis et al. 2021). - 8With this information in hand, the remaining step is to allocate total health care spending for each household to different payors. This version of the paper abstracts from a complex procedure to map total health spending to out-ofpocket spending. Instead it applies the value of 22 percent of the total that is observed in the data.
- 9Note that total spending does not include uncompensated care, which is the amount defaulted by households or their health insurance payors.


Arapakis, Karolos. 2022. "How Much Do Retirees Spend on Uncertain Health Costs?" Issue in Brief 22-14. Chestnut Hill, MA: Center for Retirement Research at Boston College.