
Medicare Finances: A 2024 Update

The brief’s key findings are:
- The 2024 Medicare Trustees Report, released this spring to little fanfare, contained relatively good news.
- The hospital program’s long-term deficit fell to its lowest level in years, and the depletion date of its trust fund has been pushed out five years.
- And Medicare’s overall spending outlook is still much better than a decade ago, even under assumptions that policymakers curb some cost controls.
- That said, Medicare continues to face high and growing costs because the overall U.S. healthcare system is so expensive.
Introduction
While U.S. healthcare costs as a percentage of GDP are by far the highest in the developed world, the news from the 2024 Medicare Trustees Report is relatively good. It is true that the Hospital Insurance (HI) program faces a long-term deficit, but that deficit is the smallest it has been for more than a decade and the year of depletion of trust fund reserves has been pushed out five years to 2036. Yes, the rest of the Medicare program will require increasing amounts of general revenues, but they are very similar to those anticipated last year. This brief summarizes the current state of Medicare’s finances.
The discussion proceeds as follows. The first section provides an overview of the Medicare program. The second section describes the 2024 Trustees Report projections that use current-law assumptions. The third compares the current-law projections to an alternative scenario prepared by Medicare’s Office of the Actuary. The final section concludes that while costs remain high, Medicare’s finances – even under the alternative assumptions – continue to improve.
An Overview of Medicare
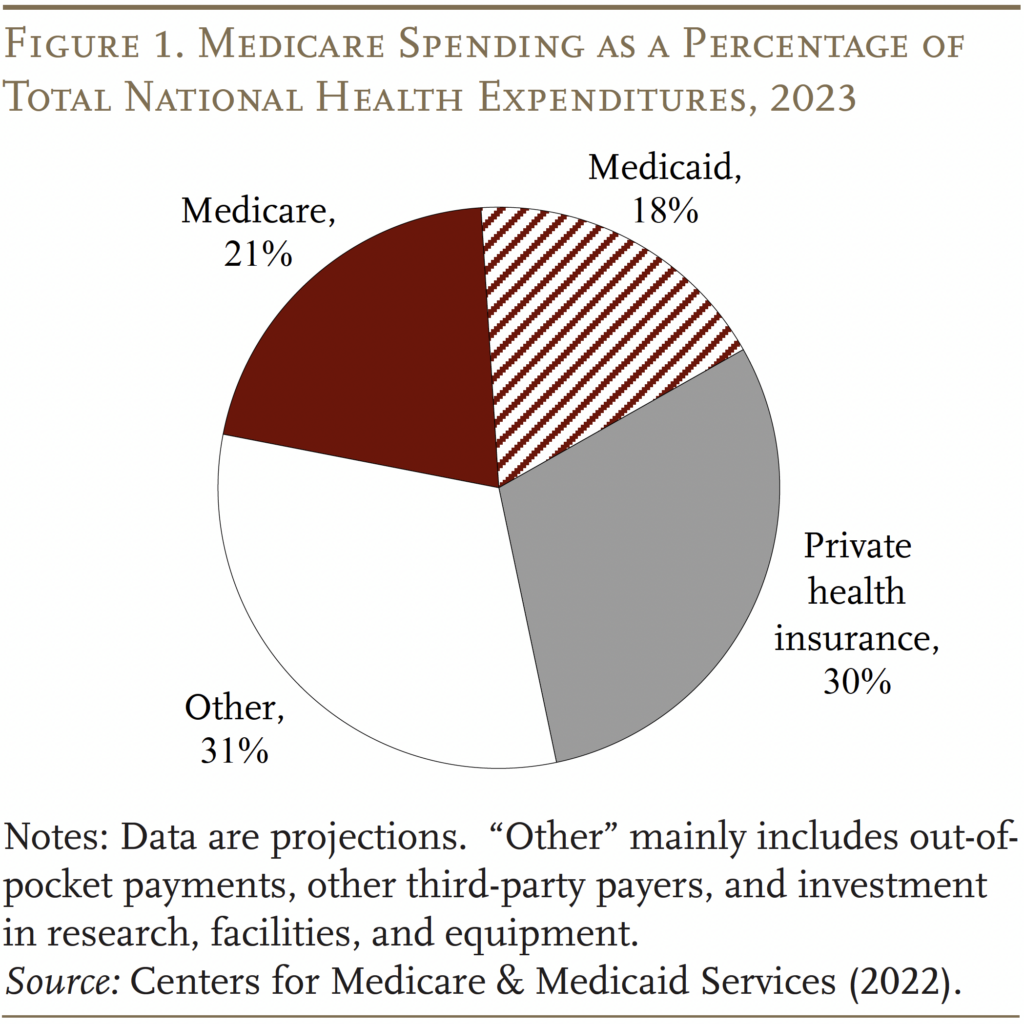
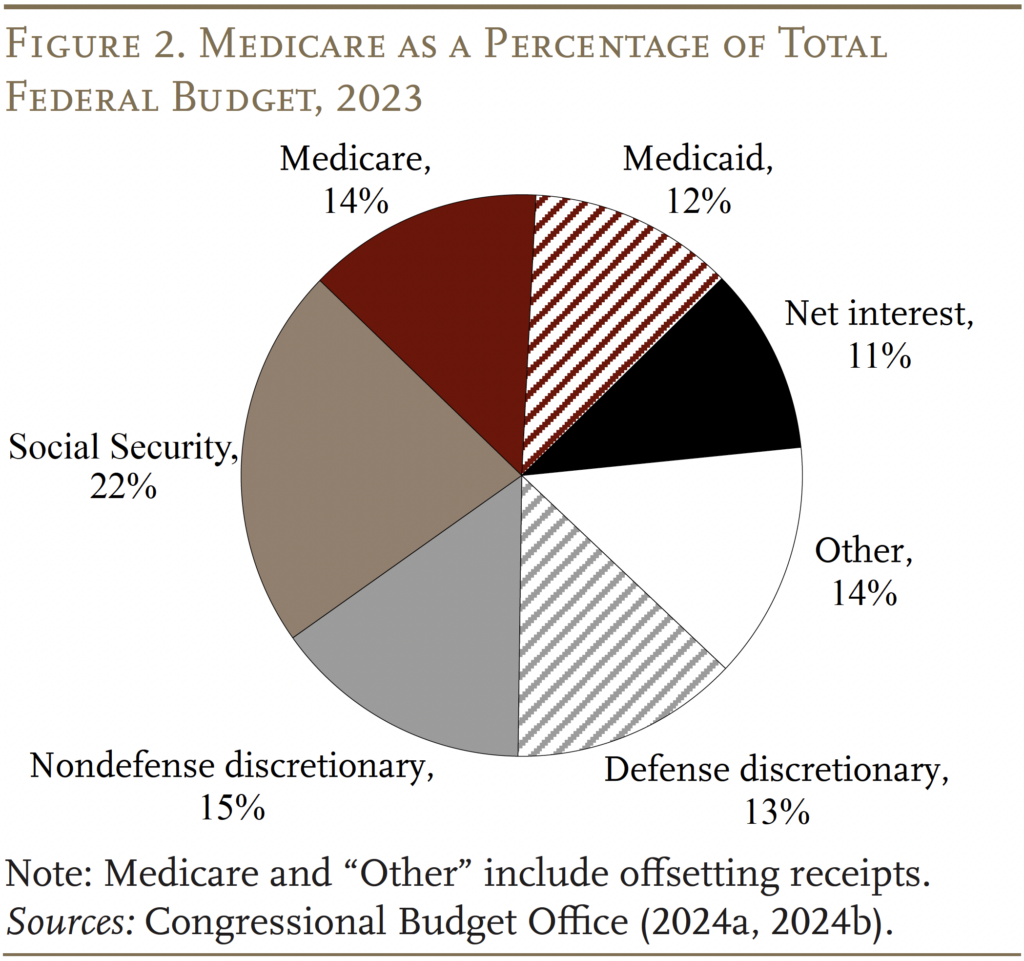
Medicare is the largest public health program in the United States. It covers virtually all persons ages 65 and older and people who receive federal disability insurance benefits. As shown in Figures 1 and 2, the program accounts for 22 percent of national healthcare spending and 14 percent of the federal budget.
Traditional Medicare is composed of two programs. The first – Part A, Hospital Insurance (HI) – covers inpatient hospital services, skilled nursing facilities, home healthcare, and hospice care. The second – Supplementary Medical Insurance (SMI) – consists of two separate accounts: Part B, which covers physician and outpatient hospital services, and Part D, which was enacted in 2003 and covers prescription drugs. The arrangements are slightly more complicated because Medicare also includes Part C – the Medicare Advantage plan option, which makes payments to private insurance plans that provide both Part A and Part B services.
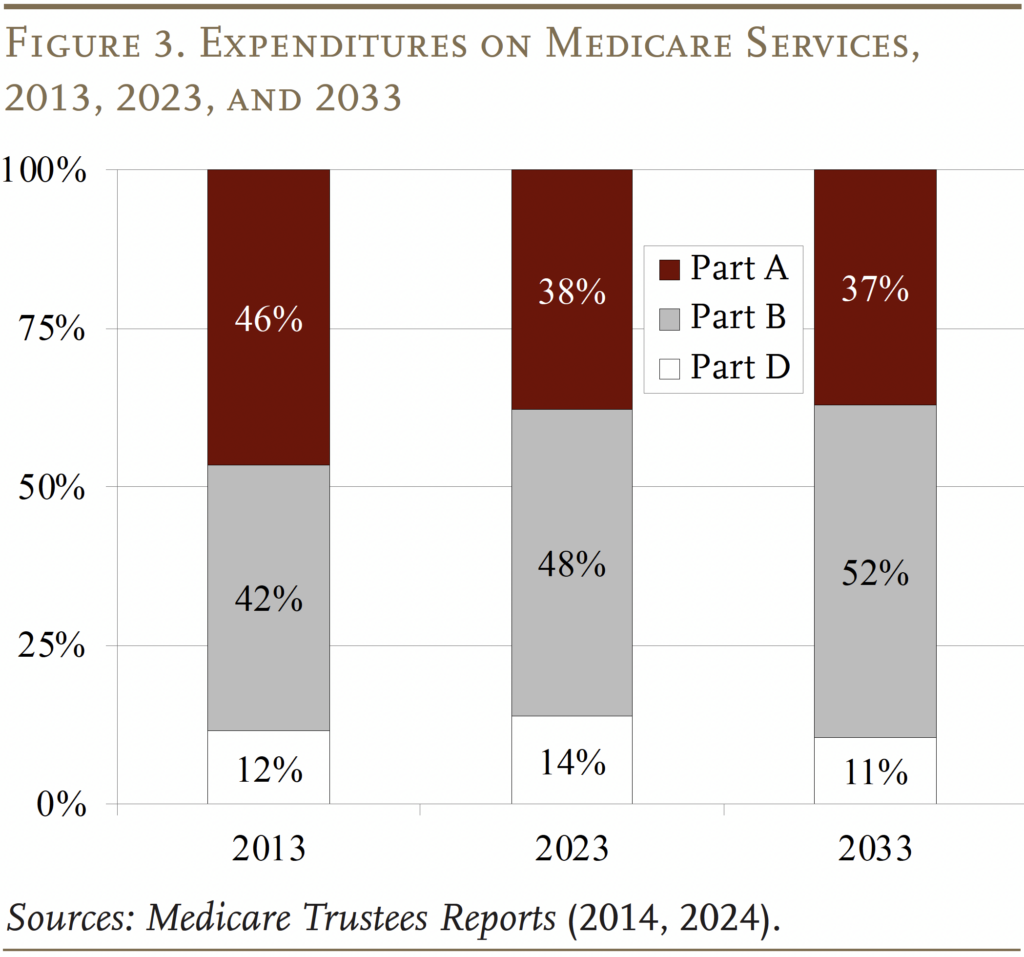
The pattern of Medicare expenditures has shifted over time (see Figure 3). In 2013, Part A was the largest component, accounting for 46 percent of total expenditures. By 2023, Part A had declined to 38 percent, reflecting a shift from inpatient to outpatient services, and spending on Part B benefits had grown to 48 percent. This shift is expected to continue in the future, so that Part B will account for more than half of total spending in 2033. Spending on Part D prescription drug benefits has been a roughly constant share of total spending over time.
Each Medicare program has its own trust fund and its own source of revenues. Part A (HI) is paid for primarily by a 2.9-percent payroll tax on all covered wages (with no cap), shared equally by employers and employees. In addition, high-income workers pay an extra 0.9-percent tax on their earnings above a threshold of $200,000 for singles and $250,000 for married couples.1Since these thresholds are not indexed for wage growth or inflation, an increasing proportion of workers and their earnings will become subject to the higher HI tax rate. By the end of the long-range projection period, an estimated 80 percent of workers are projected to be subject to this additional tax. Thus, HI payroll tax revenues will increase steadily as a percentage of taxable payroll. Most of the remaining revenue comes from a portion of the federal income taxes that Social Security recipients pay on their benefits.
Part B is financed by a combination of participant premiums and general revenues. Most beneficiaries pay the standard premium ($174.70 per month), which is set by law to equal 25 percent of the estimated average per-person cost. Beneficiaries with higher annual incomes pay additional amounts that range from $69.90 to $419.30.2In 2024, the maximum monthly premium was $594 for individuals with modified adjusted gross income of $500,000 or more and couples with income of $750,000 or more. The bulk of Part B costs are covered by general revenues.
Part D, which covers outpatient prescription drugs, is financed primarily by general revenues (73 percent) and beneficiary premiums (14 percent), with an additional 12 percent coming from state payments for beneficiaries enrolled in both Medicare and Medicaid. Higher-income enrollees pay a larger share of the cost of Part D coverage, as they do for Part B.
The annual Medicare Trustees Reports project the program’s finances under current law. In addition, the actuaries prepare an alternative scenario that limits the extent to which Medicare payments to hospitals and physicians fall below those made by private insurers.
Medicare Finances under Current Law
In the wake of the Affordable Care Act of 2010 (ACA), the Medicare current-law projections have assumed a substantial reduction in the growth rate of per-capita health expenditures relative to historical experience. While such projections for government programs sometimes prove optimistic, Medicare has actually experienced slower spending growth in recent years.
The Outlook for Part A – HI
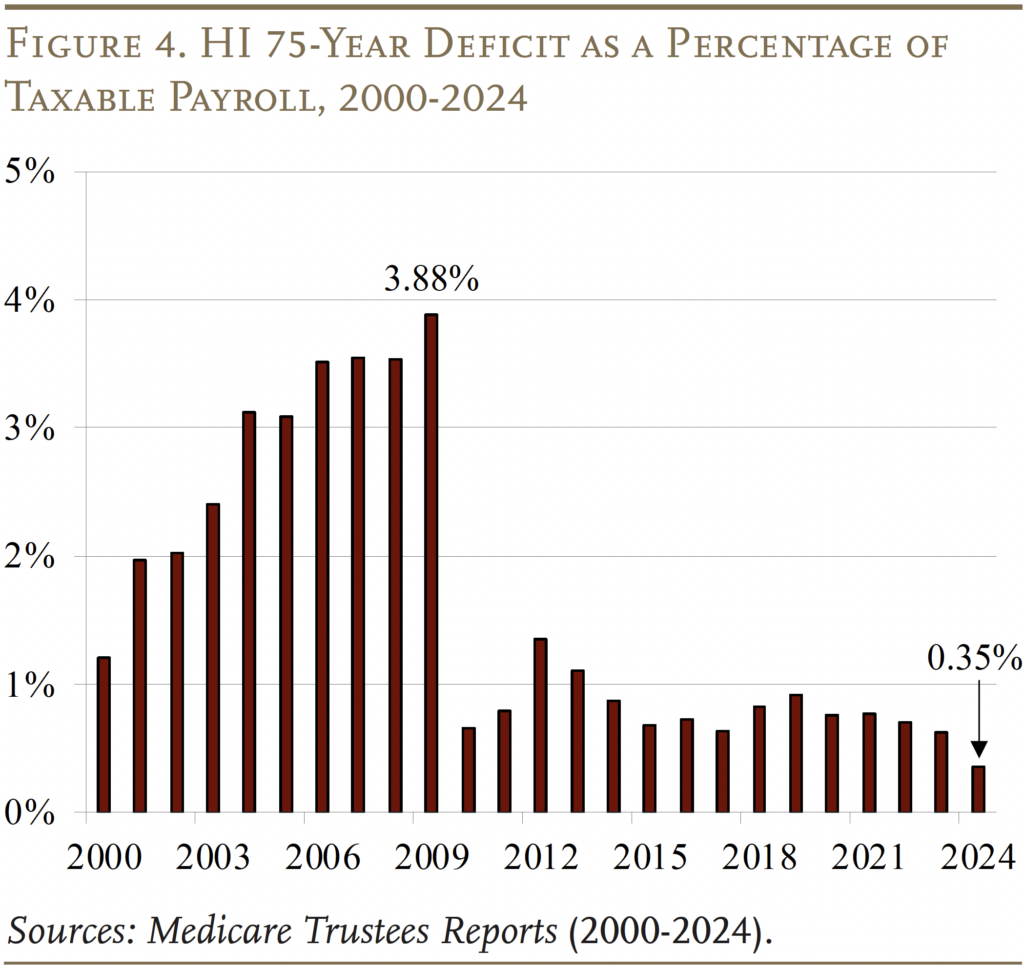
In terms of the HI program – the component of Medicare financed by the payroll tax – the lower projected costs have led to substantially smaller 75-year deficits (see Figure 4). The 2024 Medicare HI deficit of 0.35 percent of taxable payrolls is the lowest since the passage of the ACA in 2010. The improvement since last year’s Trustees Report is due to several factors: higher payroll taxes due to a stronger-than-expected economy, actual expenditures in 2023 that were lower than expected, and a policy change that corrected the accounting for medical education expenses in Medicare Advantage plans.
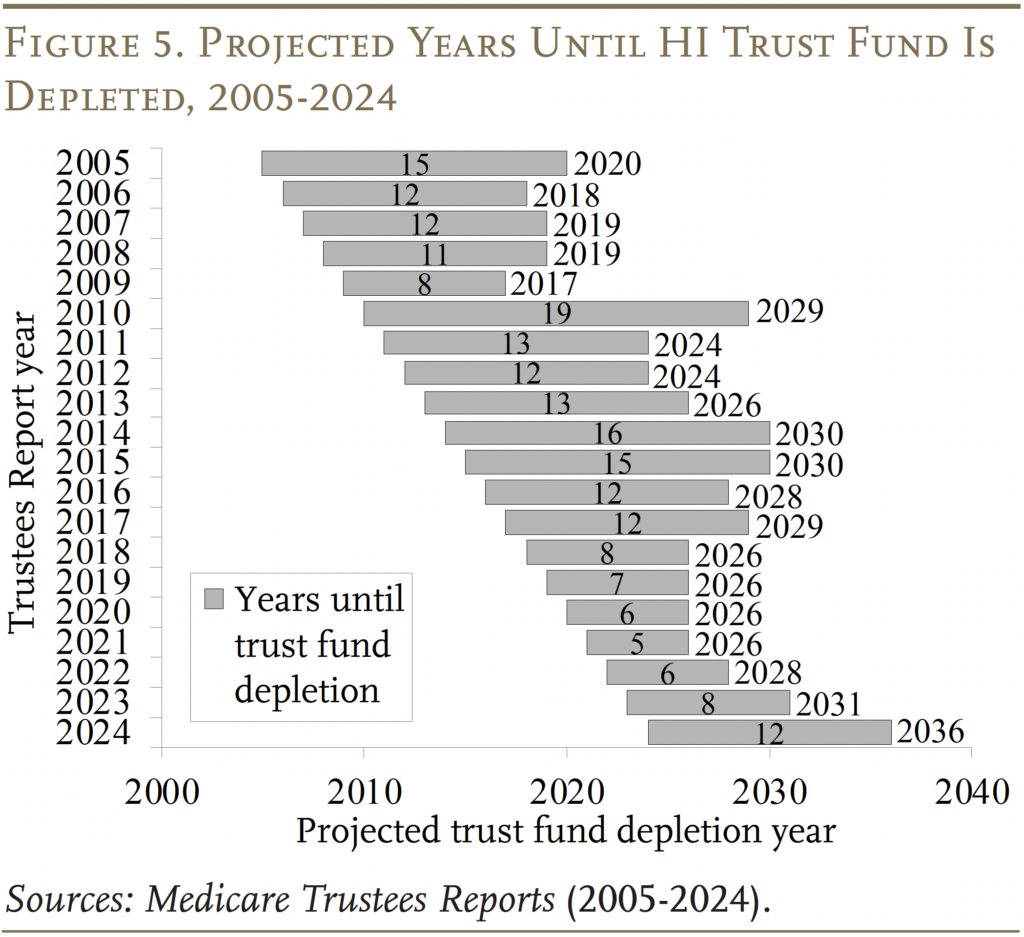
The HI trust fund is projected to deplete its reserves in 2036 – five years later than projected in last year’s Trustees Report (see Figure 5). Once the fund is depleted, continuing program income will be sufficient to pay 89 percent of scheduled benefits.
The Outlook for Part B and Part D
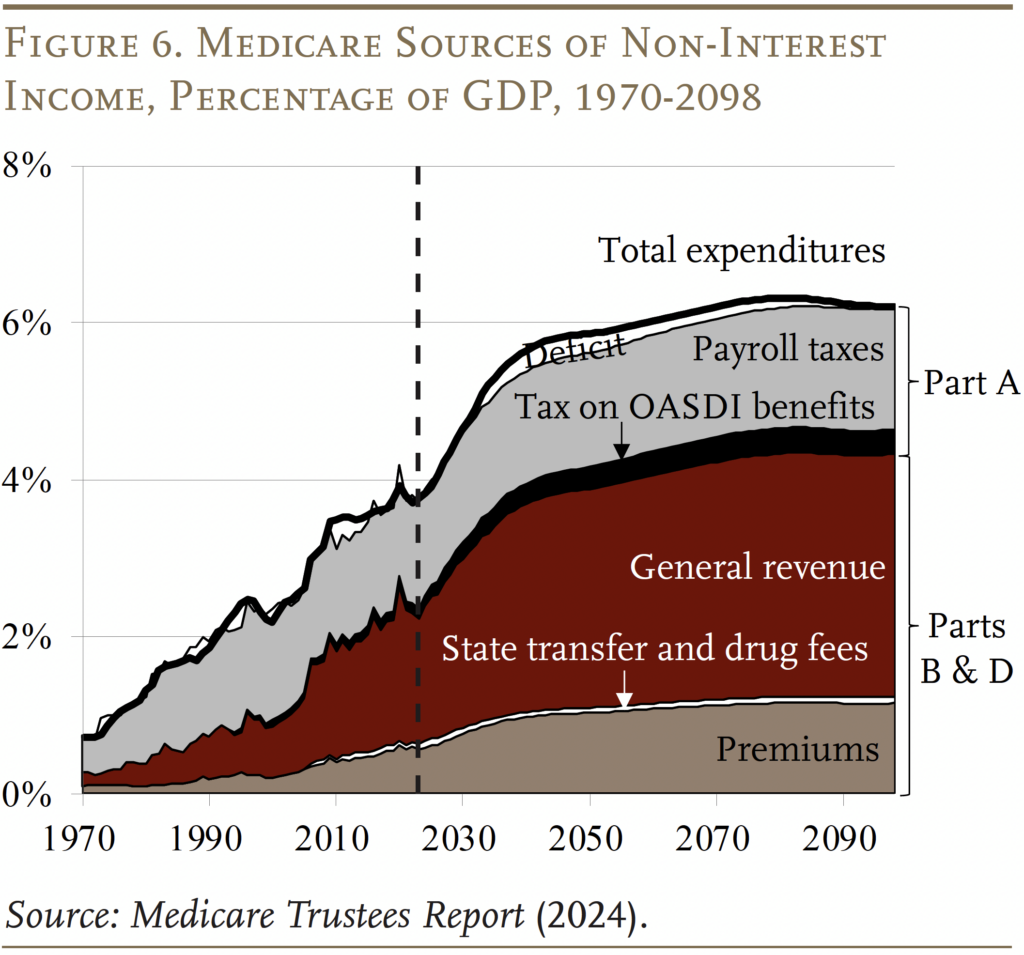
Part B, which covers physician and outpatient hospital services, and Part D, which covers prescription drugs, are both adequately financed for the indefinite future because the law provides for general revenues and participant premiums to meet the next year’s expected costs. Of course, an increasing claim on general revenues puts pressure on the federal budget and rising premiums place a growing burden on beneficiaries (see Figure 6).
The pattern of projected expenditures compared to last year is mixed. For Part B, outlays are lower until the 2050s and higher thereafter – the result of lower projected spending in the near term on outpatient services and revised GDP projections. For Part D, expenditures are projected to be higher early in the projection period and then more similar towards the end – the result of revised projections for drug utilization, enrollment, and GDP.
Projections under Alternative Assumptions
The Trustees’ main projections are based on current law and, therefore, include the impact of cost-control provisions in the ACA and subsequent legislation.3The ACA, passed in 2010, contained roughly 165 provisions aimed at reducing costs, increasing revenues, eliminating fraud and waste, and developing research and technological enhancements. Subsequently, the Medicare Access and CHIP Reauthorization Act of 2015 (MACRA) revised the system for paying physicians. To the extent that these provisions produce inadequate reimbursement for Medicare providers, hospitals and doctors could either stop serving Medicare patients or shift some of the costs to non-Medicare patients. In response, Congress may find it necessary to curtail the payment reductions. To account for the uncertain future of the cost control measures, the Medicare actuaries also produce alternative projections.4The actuaries note that the use of an alternative scenario for analysis should not be construed as an endorsement by the Trustees, CMS, or the actuaries themselves.
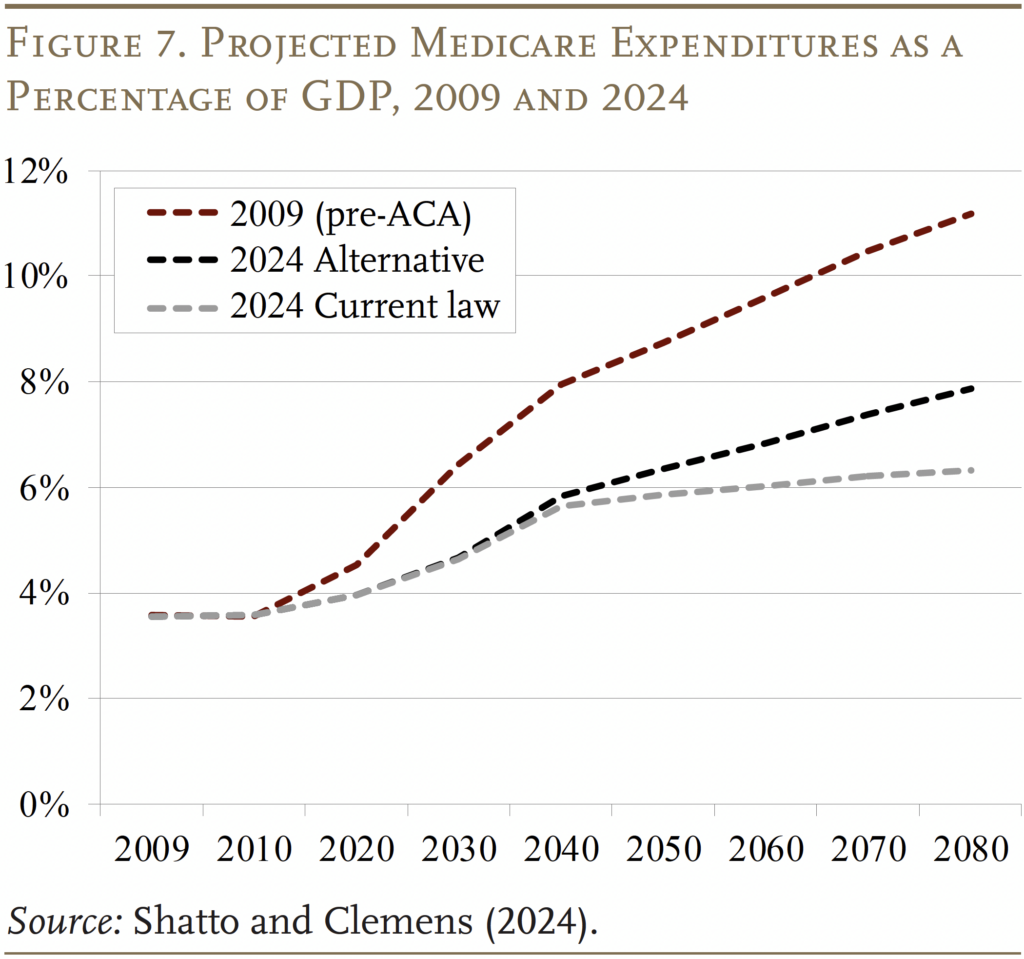
With the relaxation of cost-saving provisions in current law, expenditures under Parts A and B would increase as a percentage of GDP. (Part D costs were not affected by legislated cost controls.) By 2090, the total cost of Medicare will be about 2 percent of GDP higher under the alternative than under the current-law provisions, but even these higher expenditure numbers are way below pre-ACA projections (see Figure 7).
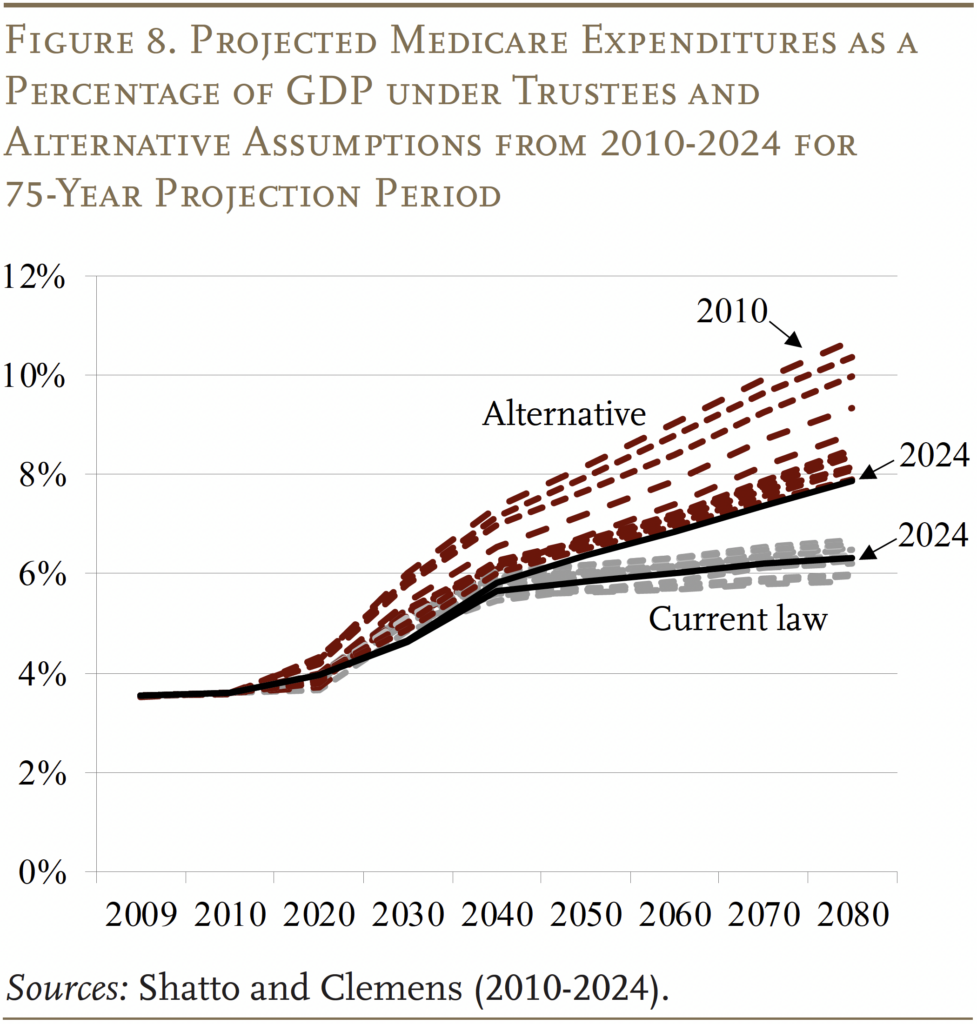
With 15 years of Trustees’ and alternative projections for comparison, an interesting question is whether they converge or diverge over time. As shown in Figure 8, the current-law projections have remained within a relatively narrow band, with the 2024 projections roughly in the middle. In contrast, the alternative projections have declined noticeably, with 2024 at the low end. Thus, the two sets of estimates have converged substantially, and the expenditure gap in the 2090s appears to have stabilized at slightly less than 2 percent of GDP.
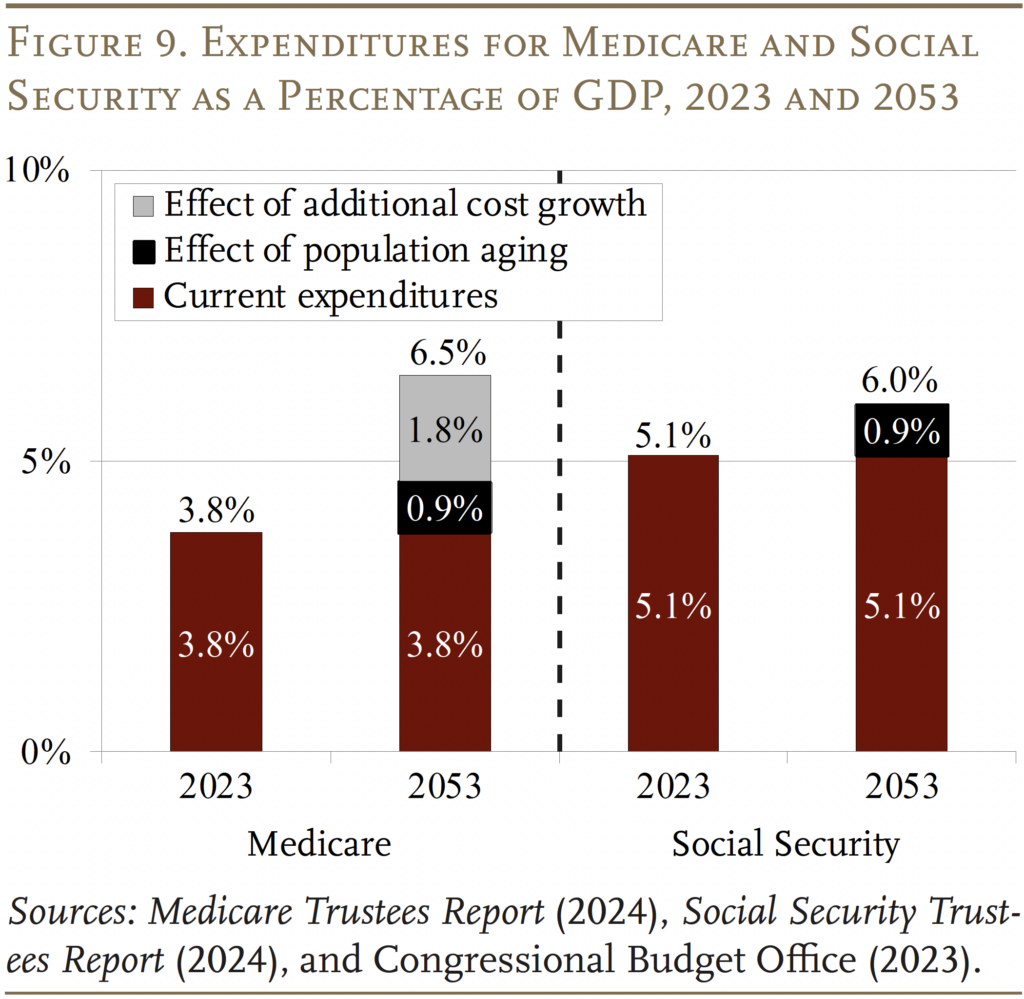
While the 2024 Trustees Report produced relatively good news on the Medicare front, the program’s costs are high and growing. In contrast to Social Security, where population aging can explain all the growth in expenditures over the next 30 years, an aging population explains much less than half of the projected future growth in Medicare (see Figure 9). The rest comes from the costs for hospital and physician services rising faster than GDP. The bottom line is that the only way to control Medicare costs is to get national healthcare spending under control.
Conclusion
The 2024 Medicare Trustees Report contained no bad news. In fact, in Part A, the depletion of the HI trust fund was pushed out five years and the HI deficit was at the low end of post-ACA numbers, while expenditures for Part B and Part D were very similar to those in the 2023 report. That said, Medicare does face significant financing challenges: it operates in a country with extraordinarily high healthcare costs.
References
Centers for Medicare & Medicaid Services. 2000-2024. Annual Report of the Boards of Trustees of the Federal Hospital Insurance and Federal Supplementary Medical Insurance Trust Funds. Washington, DC: U.S. Department of Health and Human Services.
Centers for Medicare & Medicaid Services. 2022. National Health Expenditure Accounts. Washington, DC: U.S. Department of Health and Human Services.
Congressional Budget Office. 2024a. Historical Budget Data. Washington, DC.
Congressional Budget Office. 2024b. “The Budget and Economic Outlook: 2024 to 2033.” Washington, DC.
Congressional Budget Office. 2023. “The 2023 Long- Term Budget Outlook.” Washington, DC.
Shatto, John D. and M. Kent Clemens. 2010-2024. “Projected Medicare Expenditures under an Illustrative Scenario with Alternative Payment Updates to Medicare Providers.” Washington, DC: U.S. Department of Health and Human Services.
U.S. Social Security Administration. 2024. The Annual Reports of the Board of Trustees of the Federal Old-Age and Survivors Insurance and Federal Disability Insurance Trust Funds. Washington, DC: U.S. Government Printing Office.
Endnotes
- 1Since these thresholds are not indexed for wage growth or inflation, an increasing proportion of workers and their earnings will become subject to the higher HI tax rate. By the end of the long-range projection period, an estimated 80 percent of workers are projected to be subject to this additional tax. Thus, HI payroll tax revenues will increase steadily as a percentage of taxable payroll.
- 2In 2024, the maximum monthly premium was $594 for individuals with modified adjusted gross income of $500,000 or more and couples with income of $750,000 or more.
- 3The ACA, passed in 2010, contained roughly 165 provisions aimed at reducing costs, increasing revenues, eliminating fraud and waste, and developing research and technological enhancements. Subsequently, the Medicare Access and CHIP Reauthorization Act of 2015 (MACRA) revised the system for paying physicians.
- 4The actuaries note that the use of an alternative scenario for analysis should not be construed as an endorsement by the Trustees, CMS, or the actuaries themselves.


Munnell, Alicia H.. 2024. "Medicare Finances: A 2024 Update" Issue in Brief 24-16. Chestnut Hill, MA: Center for Retirement Research at Boston College.