
Why Do Older People Get Lower Returns on Their Homes?

The brief’s key findings are:
- Buying and selling a home are big financial decisions for most Americans.
- Research to date focuses on the buying side, so this study turns to the selling side to explore whether older sellers get the same returns as younger ones.
- Using a new dataset linking home sales to seller age, the results show that older sellers get less starting at age 70, with the gap growing at older ages.
- Older sellers receive lower returns because: 1) their homes have poorer upkeep; and 2) they more often sell on private listings and sell to investors.
- Policy changes can help with private listings, as reforms in Illinois reduced both the prevalence of these listings and the size of the age gap.
Introduction
For most Americans, the vast majority of their wealth comes from their home, through paying down the mortgage and enjoying price appreciation. As a result, buying and selling a home are the most significant financial decisions that families face over their lifetimes. Much research has focused on the buying side of the exercise, primarily looking at how the availability and cost of mortgages vary by race and age. Much less research has examined the selling side of the transaction to determine whether returns vary by income and demographics. One big question is the extent to which home-seller returns vary over the life cycle, particularly whether older homeowners earn the same returns as their younger counterparts.
To answer that question, this brief – which is based on a recent paper – summarizes a comprehensive analysis of age-related disparities in home-sale returns.1 The analysis uses a newly created dataset that links housing transactions with voter records to obtain seller age. The results show that a decline in housing returns starts at age 70 and increases with each additional year of the seller’s age. Having established a link between age and the penalty in property returns, the study seeks to document possible explanations, such as the condition of the property and how the property is marketed and sold.
The discussion proceeds as follows. The first section describes the dataset, and the second reports the base results on the relationship between the seller’s age and the annual return. The third section explores how the condition of the house contributes to the lower return for older sellers. The fourth section examines whether the property is listed on the Multi-Listing Services (MLS) and whether it is sold to an investor.
The final section concludes that the negative relationship between a home seller’s age and annual returns is large. An 80-year-old seller realizes about 0.5 percent per year less than a 45-year-old, which corresponds to a 5-percent-lower sales price for a home with the mean holding period (11 years). On the typical home price of $400,000, this reduction amounts to a loss of $20,000. Two factors contribute to this outcome. First, homes sold by older people are less likely to be well-maintained. Second, older sellers are more likely to sell their homes off-MLS and sell to investors. Here, policy changes could help: reforms introduced in Illinois to make private listings more transparent significantly reduced both the prevalence of private listings and the magnitude of the age gap.
Constructing the Dataset
Prior research has found that older people tend to realize lower returns when they sell their homes, but these studies often rely on self-reported home values, which are prone to measurement error.2 To get a more accurate and comprehensive analysis of age-related disparities, the analysis described below starts by constructing a new dataset that links actual housing transactions in the CoreLogic Deeds database to ages in voter registration records.
CoreLogic aggregates public deed records from over 3,000 county clerk and recorder offices across the United States. In some counties, the data can go as far back as 50 years. The data include: property characteristics, such as address, land use, and lot size; transaction information, such as sale date, sale price, deed type, arm’s length flag, and cash sale flag; and owner information, such as buyer name, seller name, or corporate buyer/seller. CoreLogic also has a subset of transactions marketed through the Multi-Listing Services (MLS), which includes additional details such as the asking price, original listing date, and more property characteristics.
The CoreLogic transaction data are linked to voter registration records – from a company called L2 – using the property owner’s name, residential address, zip code, and date of birth, which L2 standardizes into a uniform format. Because L2 data only cover registered U.S. citizens and primary residences and only 65-75 percent of adult citizens are registered to vote, the match covers only 40 percent of all CoreLogic transactions. The matching frequency rises over time, from less than 5 percent in the late 1990s to nearly 50 percent by the early 2020s.
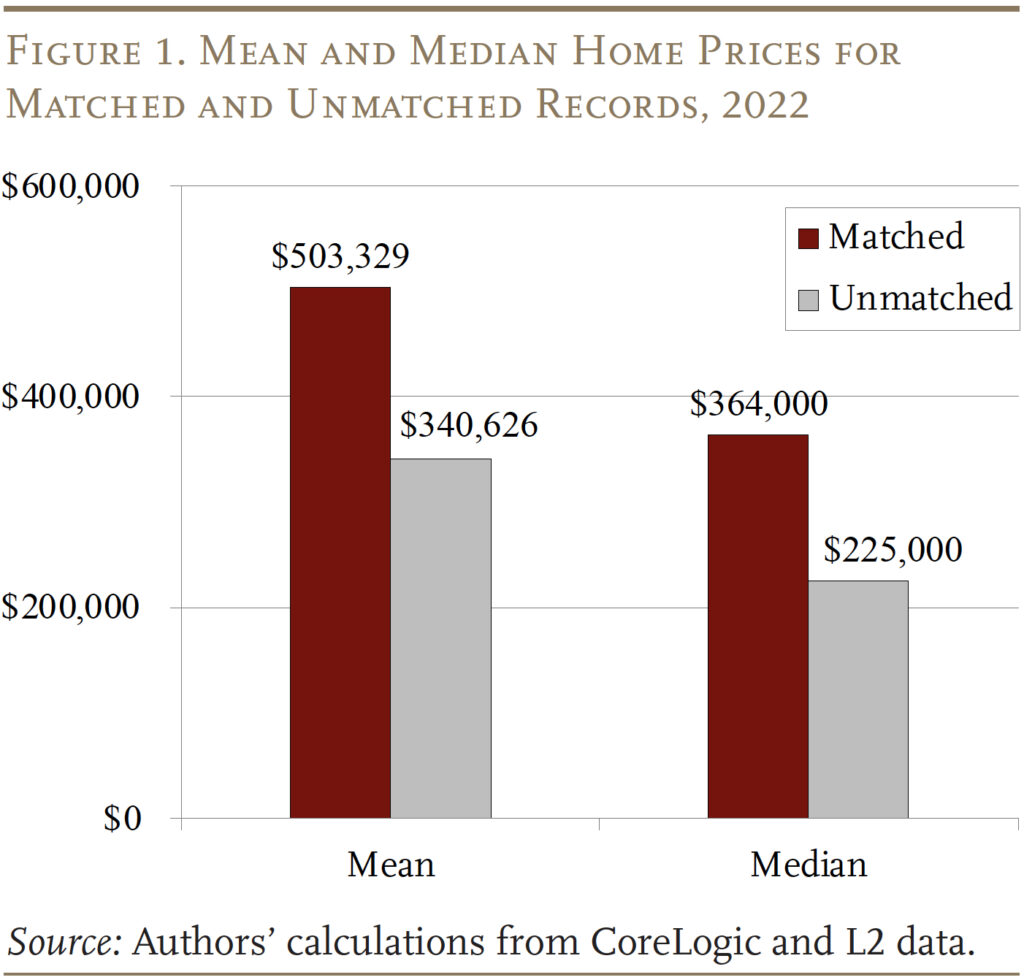
The home prices were somewhat higher for the matched than the unmatched sales (see Figure 1). These lower values may reflect that the unmatched sales include second- and investment-home properties, homes purchased by non-citizens, and homes owned by non-voters – all of which are likely to have lower prices. While home prices may differ somewhat, the age distribution of sellers in the newly-constructed dataset aligns nicely with estimates from the Zillow Seller Survey data.
The new linked database establishes the basis for examining the relationship between age and the nominal annual rate of return on homes.
The Basic Results
Before estimating any relationship between age and returns on home sales, the sample needs to be refined and the focus clarified. First, the sample is limited to observations where the first seller’s age is identified and when the transaction is arm’s length. In addition, both the buyer and seller must be older than 18; both the purchase and sale prices must exceed $10,000; the holding period must be three years or more – to filter out home flipping; and the transaction cannot involve a fiduciary deed, because the age of the seller does not reflect the age of the owner.3 Second, the analysis is limited to repeat sales so that both the purchase price and sale price can be known with certainty. After applying all adjustments, the final sample for the baseline regression analysis consists of about 10 million repeat sales.
The baseline regressions proceed in three steps: 1) regressing the average annual return on seller’s age; 2) introducing zip-code location, buy year, sell year, and their interactions; 3) adding seller’s race, ethnicity, gender, and marital status; and 4) finally adding the age of the structure on the property, the holding period, and cash sale indicator.
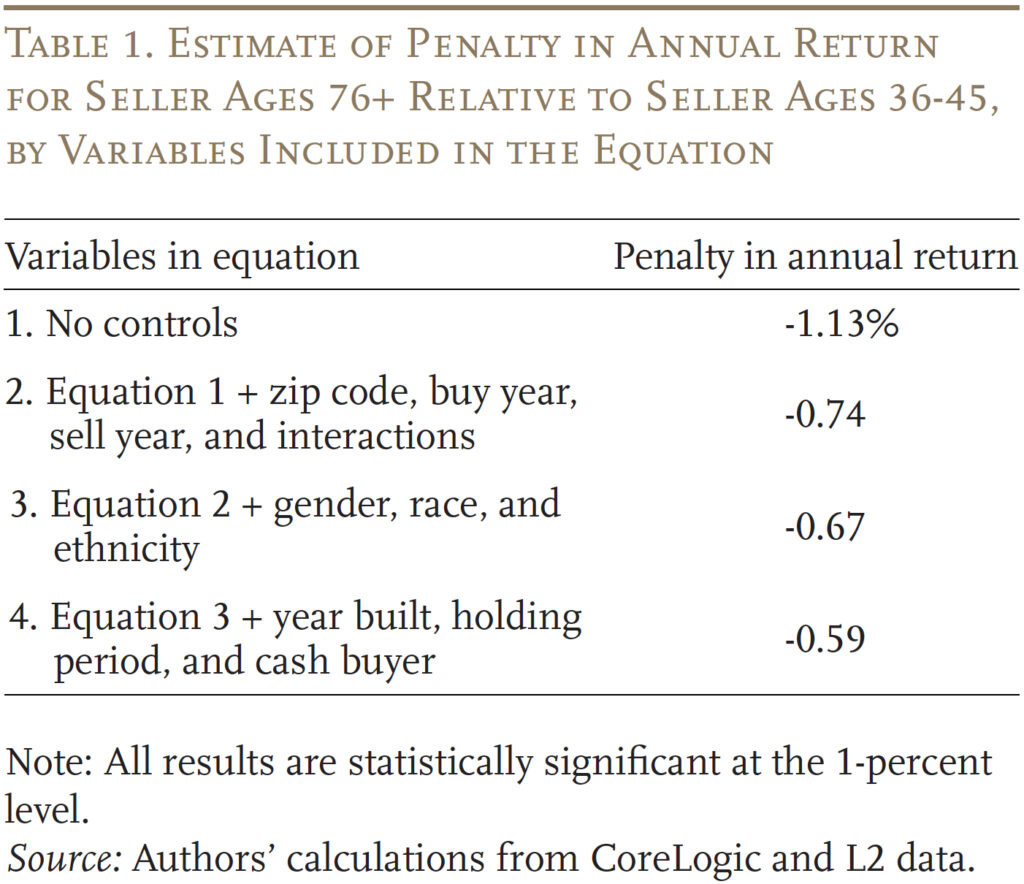
Table 1 shows the reduction in annual return for sellers ages 76+ relative to those ages 36-45, and how the impact of age emerges as more personal and property characteristics are added to the equation. With no control variables to “hold everything else constant,” the regression shows the penalty in annual returns is -1.13 percent. Adding zip code, buy year, sell year, and their interactions reduces the penalty to -0.74. Adding gender, race, and ethnicity further cuts the shortfall to -0.67. Incorporating an indicator for year built, holding period, and cash sales reduces the penalty to -0.59 lower returns per year.
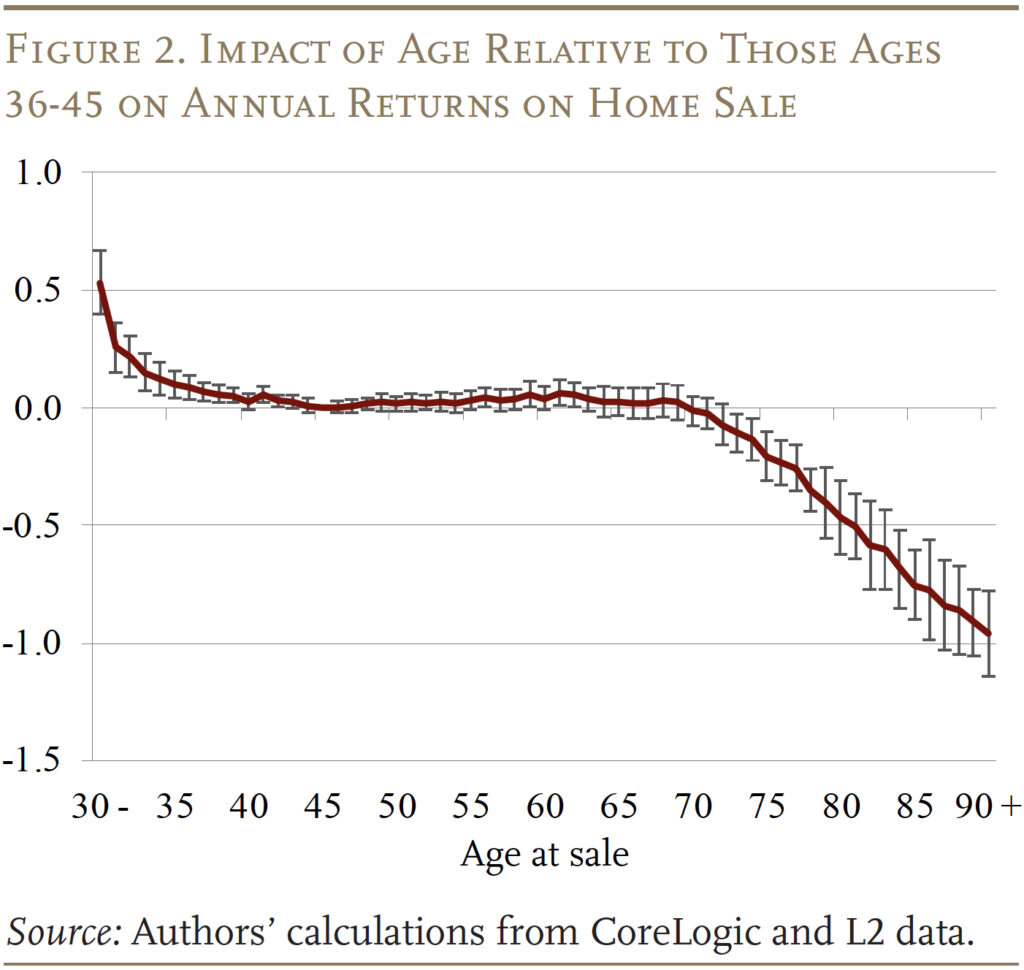
Using Equation 4 (with the most control variables), it is possible to plot the estimate of annualized returns by seller age relative to returns of those ages 36-45. As noted in the introduction, the decline begins at age 70 and then accelerates thereafter (see Figure 2).
Since a substantial differential remains even controlling for personal and timing information, the next step is to see whether the condition of the structure and the mechanism of the transaction affect the outcome.
Condition of the Structure
This exercise focuses on the sales offered through the MLS – where more details about the property are available – to test whether differences in renovations and/or maintenance help explain the age gap. Four new variables are created to capture renovation and home quality, based on keywords from the text description of each listing on the MLS. The assessment varies from “high positive” to “high negative.”
- High positive: text mentions major upgrades, such as a new roof, foundation repair, updated HVAC, or remodeled kitchen.
- Low positive: text mentions minor cosmetic updates, such as fresh paint or finishes.
- Neutral: text includes marketing terms, such as cozy, but no upgrades.
- High negative: text suggests poor condition with words like “fixer-upper” or “as-is.”
Beyond the textual analysis, the MLS sample identifies transactions associated with dual agency, whereby the same agent receives fees on both the sell-side and the buy-side.
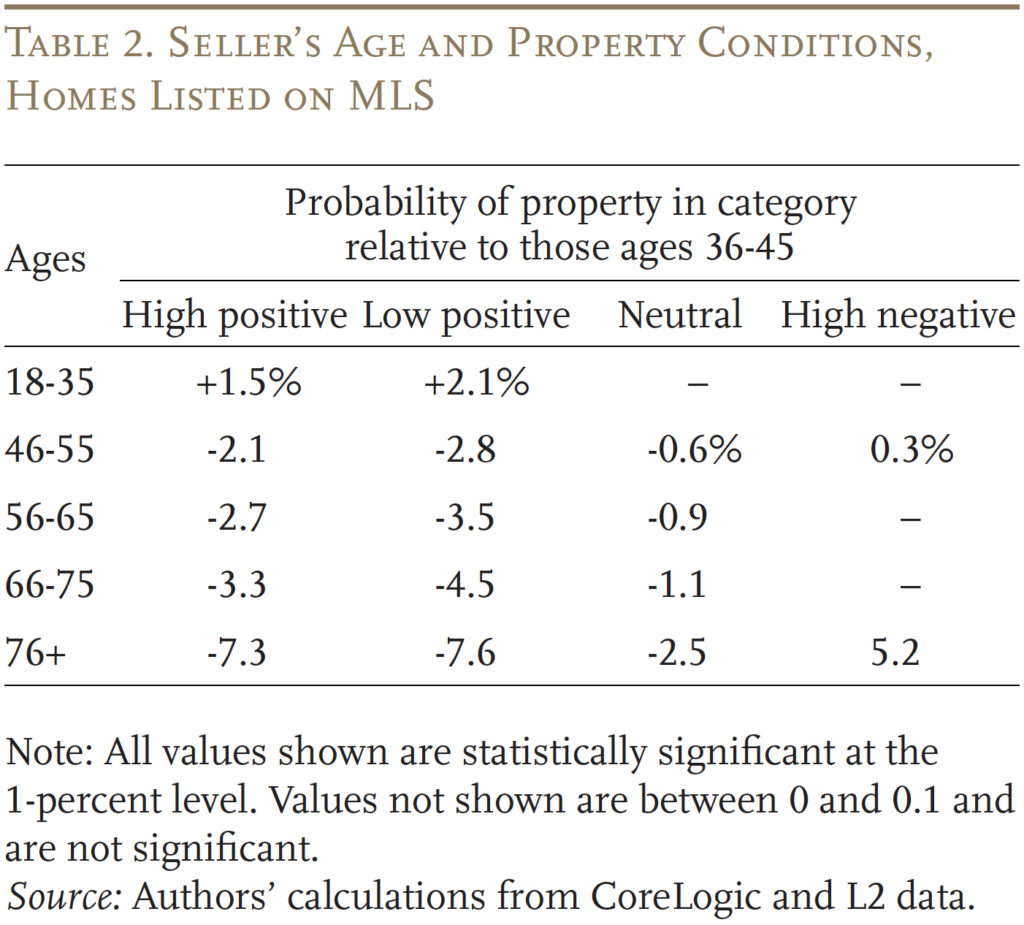
The likelihood of high positive, low positive, and neutral descriptions declines throughout the life cycle, with homes sold by the youngest people exhibiting the highest level of upkeep. Most strikingly, the high negative category increases sharply among the oldest sellers (see Table 2).
The question is how property quality and dual agency affect the relationship between seller age and returns. Answering this question involves focusing on the subsample of MLS sales and estimating a regression that relates sale price to the dual agency and house quality variables in addition to all the personal control variables described earlier.
The results show that both high positive and high negative ratings help explain returns, with the other three indicators having relatively little impact. Adding the quality indicators to the model reduces the age coefficient by about 10 percent because older sellers on average have properties with fewer major improvements and poorer maintenance. This finding is amplified by including interactions of dual agency, high positive, and high negative with the age indicators. In short, the condition of the property matters a lot.
Mechanism of the Transaction: MLS or Not
Properties sold via the MLS are advertised on a publicly available list; properties sold privately are typically advertised among the agent’s personal network. Some sellers may prefer a private sale to protect their privacy, and some agents may use off-MLS marketing to test market pricing for unique or luxury properties before committing to a public list price. But listing privately can negatively affect the final sale price. The most obvious reason is that fewer people will know that the property is for sale. Less obvious, sellers are exposed to some agents’ non-profit-maximizing actions, such as encouraging sales to professional investors or developers so that they can receive higher fees via dual agency.4 Therefore, if older sellers are more likely to sell off-MLS and/or to investors, this practice could help explain the large age gap.
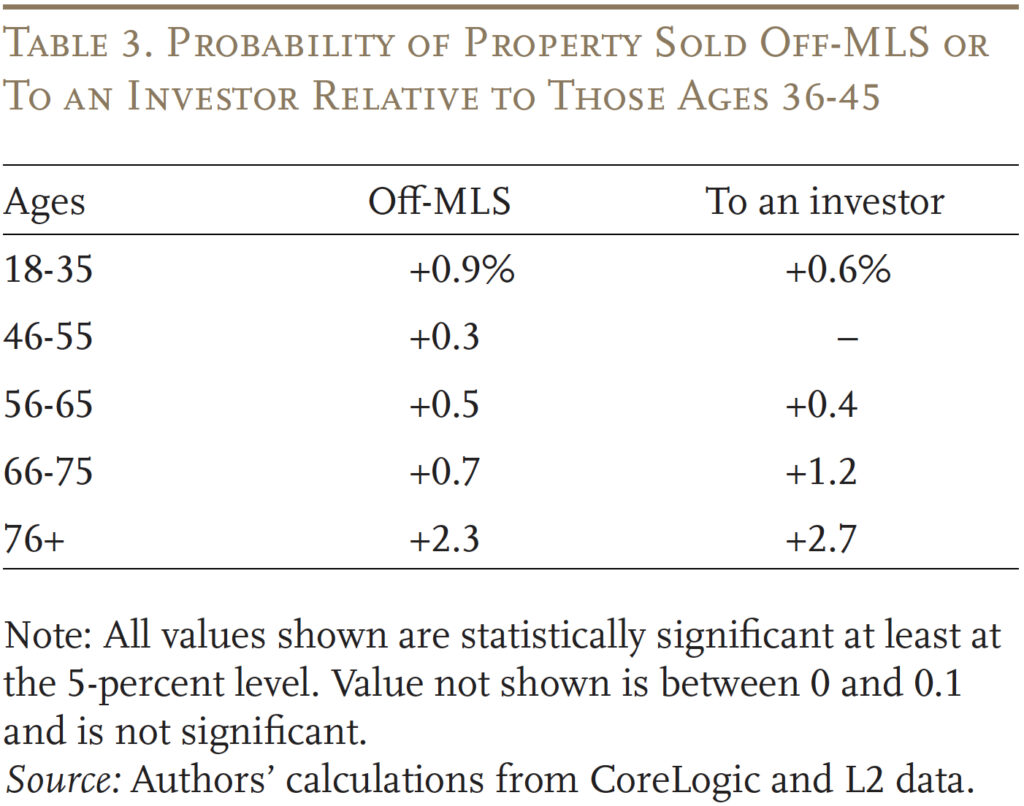
A simple regression shows that – conditioning on similar control variables and fixed effects as in prior regressions – the likelihood of private listings and sales to investors increases with age (see Table 3). More specifically, the oldest cohort is 2.3 percent more likely to sell off-MLS than sellers in the reference group and 2.7 percent more likely to sell to an investor. Further results show that sales to investors are more likely when transactions are off-MLS; and this effect is much larger for older sellers.
A final equation shows that sellers who market off-MLS or sell their properties to investors receive lower returns than sellers who go through the MLS. Moreover, these effects are much larger for older sellers. In all, an elderly seller who sells off-MLS or to an investor receives returns that are about 1 percent lower than a middle-aged seller; this penalty is cut in half if the elderly seller lists their property on the MLS platform and sells to a non-investor.
To explore whether listing privately actually causes lower returns, the researchers focused on a policy change by Midwest Real Estate Data (MRED), which operates the largest MLS platform in Illinois and one of the largest in the United States. In recognition of the growing use of and concerns associated with private listings, MRED launched an initiative to allow brokers to pre-market properties, while preserving enough transparency to protect sellers’ interest. This change led to fewer private listings across all sellers in Illinois. And, the return discount experienced by older sellers fell by half, from -0.8 percent before the policy change to -0.4 percent after the change. In short, by making private listings more transparent, the policy reduced the frequency with which agents act against the interest of their clients. And this change was most beneficial for older sellers, who had been most likely to suffer reduced returns from private listings before the change.
This analysis provides the first comprehensive evidence that older people receive lower returns when they sell their homes. The age gap emerges at age 70 and then increases with each additional year of seller age.
Conclusion
The results indicate that two mechanisms contribute to the results. First, homes sold by older people tend to have poorer upkeep. Second, older sellers are more likely to sell their homes off-MLS and sell to investors. Both of these factors are associated with lower returns, and their return effects are much larger for older sellers. Further, the link between the selling strategy and age-related return penalty can be viewed as causal: reforms introduced in Illinois to make private listings more transparent significantly reduced both the prevalence of private listings and the magnitude of the age gap.
References
Agarwal, Sumit, Jia He, Tien Foo Sing, and Changcheng Song. 2019. “Do Real Estate Agents Have Information Advantages in Housing Markets?” Journal of Financial Economics 134(3): 715-735.
Amornsiripanitch, Natee, Philip E. Strahan, and Song Zhang. 2025. “Aging and Housing Returns.” Working Paper 25-35. Philadelphia, PA: Federal Reserve Bank of Philadelphia.
CoreLogic Deeds Database. 2025. Irvine, CA.
Davidoff, Thomas. 2004. “Maintenance and the Home Equity of the Elderly.” Fisher Center Working Paper. Berkeley, CA: University of California, Berkeley, Haas School of Business.
Levitt, Steven D. and Chad Syverson. 2008. “Market Distortions When Agents Are Better Informed: The Value of Information in Real Estate Transactions.” Review of Economics and Statistics 90(4): 599-611.
L2 Voter Registration Records. 2025. Bothell, WA.
Rodda, David T. and Satyendra Patrabansh. 2007. “Homeowner Age and House Price Appreciation.” Cityscape 9(3): 123-151.
Endnotes
- Amornsiripanitch, Strahan, and Zhang (2025). ↩︎
- Davidoff (2004) and Rodda and Patrabansh (2007). ↩︎
- Finally, the sample excludes transactions from non-disclosure states – Alaska, Idaho, Kansas, Louisiana, Mississippi, Missouri, Montana, New Mexico, North Dakota, Texas, Utah, and Wyoming – where sale prices are often not part of the public record and may be based on CoreLogic’s imputation rather than actual transaction data. ↩︎
- Levitt and Syverson (2008) and Agarwal et al. (2019). ↩︎


Strahan, Philip E. and Song Zhang. 2026. "Why Do Older People Get Lower Returns on Their Homes?" Issue in Brief 26-2. Chestnut Hill, MA: Center for Retirement Research at Boston College.