
Has Pension Participation in the Private Sector Improved?

The brief’s key findings are:
- Many commentators contend that – at any given time – only 50 percent of private sector workers participate in an employer-sponsored retirement plan.
- The question is whether this situation has improved in recent years.
- The analysis compares the data from several major surveys, and the results confirm the “50 percent” number still holds.
- Of course, coverage rates are higher than participation rates, and some workers pick up coverage at some point over their worklife.
- But the lack of continuous participation in a plan remains a serious problem.
Introduction
For decades, we and other commentators have asserted that, at any given time, roughly 50 percent of private sector workers participate in an employer-sponsored retirement plan. It used to be easy to check out the “50 percent” number because the federal government’s Current Population Survey (CPS) produced data on coverage and participation for public and private sector workers. The CPS, however, no longer provides reliable information with regard to retirement plans. As a result, some commentators have turned to the government’s National Compensation Survey (NCS), which reports data provided by employers rather than workers. At the same time, they have shifted the focus from participation to coverage – suggesting a much rosier picture. The question is whether the situation in the private sector has improved over time.
To answer that question, this brief uses a wide range of datasets to look at worker participation in private sector plans. The first section reports on the strength and limitations of the annual data from the U.S. Bureau of Labor Statistics, both the employer-based NCS and the household-based CPS. The second section describes pension activity from three other household surveys – the Survey of Income and Program Participation (SIPP), the Survey of Consumer Finances (SCF), and the Panel Study of Income Dynamics (PSID). The third section summarizes recent efforts to adjust the CPS to derive more relevant figures on coverage and participation.
The final section concludes that the NCS, which shows 53 percent of private sector workers participating in a retirement plan, is roughly consistent with findings from the SIPP and PSID, which show 52 and 50 percent, respectively. Moreover, efforts to remedy problems in the CPS also produce a private sector participation estimate of 49 percent. The only outlier to these estimates is the most recent one from the SCF, which shows an increase from 54 to 58 percent participation from 2019 to 2022. Taking all the surveys and adjustments into account, our best estimate continues to be that, at any given point, roughly half of private sector workers participate in any employer-sponsored retirement plan, although a larger percentage have access to a plan.1
Coverage & Participation from the Bureau of Labor Statistics
The U.S. Bureau of Labor Statistics releases two reports that show the percentage of workers who are covered by, and participate in, employer-sponsored retirement plans – either defined benefit plans or 401(k)-like defined contribution plans. The Current Population Survey (CPS), which is produced jointly with the U.S. Census Bureau, has been interviewing households on a monthly basis for about 70 years, and, since 1980, the survey’s Annual March Social and Economic Supplement has provided data on pension coverage. In addition, the National Compensation Survey (NCS), which has been produced annually since 1996, currently interviews 11,500 private sector employers (covering 127 million workers) about whether they offer retirement plans and the extent to which their employees participate.2 The following describes the appeal and limitations of each of these surveys, starting with the NCS.
National Compensation Survey
The NCS provides comprehensive measures of occupational earnings, employment cost trends, benefit incidence, and detailed benefit provisions. The advantage of this survey is the large sample size and the relative reliability of the data. The drawback for those concerned about workers without a plan is that the NCS includes nothing beyond industry and earnings; it provides no information by age, marital status, ethnicity, education, gender, etc. for those with and without a workplace retirement plan. That said, the NCS is a good place to start.
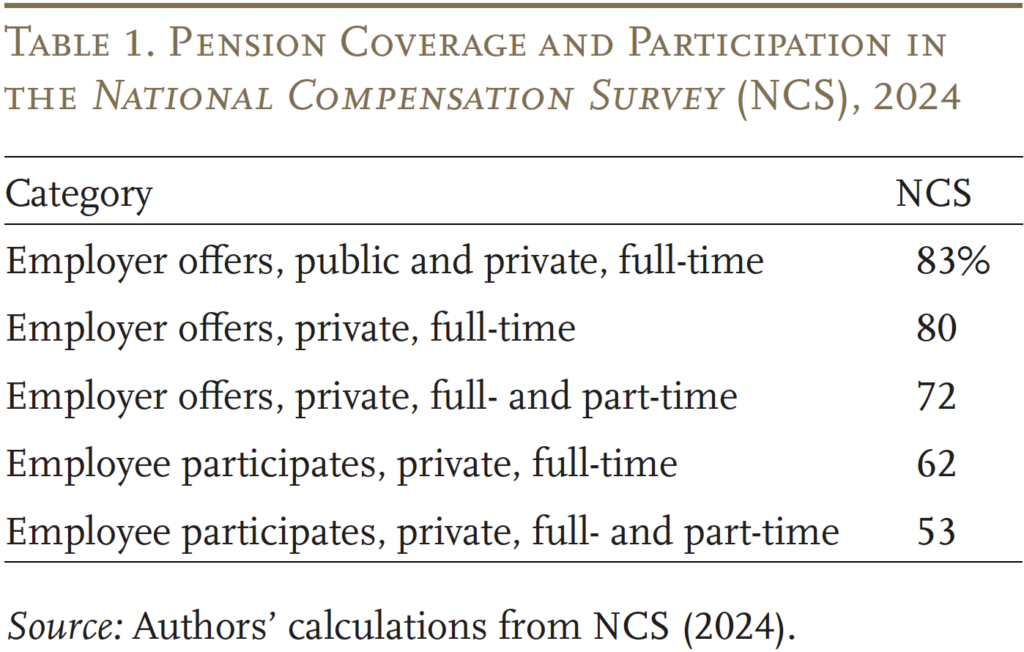
The NCS reports that, in 2024, 83 percent of full-time workers had an employer that sponsors a retirement plan (see Table 1). That number looks very different from the “50 percent” that we and other commentators commonly cite. Several adjustments make the two measures more comparable. First, the 83-percent figure refers to full-time workers in both the private sector and state and local governments. Virtually all full-time state and local workers are offered a pension, generally a defined benefit plan. Eliminate state and local employers and the coverage figure for full-time workers in the private sector drops to 80 percent. The second issue is full-time versus part-time. Add in part-time workers and the 80 percent drops to 72 percent. The third issue is participation versus access. Only about three-quarters of private sector workers who are offered a plan choose to participate. Thus, the NCS reports that only 53 percent of private sector workers (including both full-time and part-time) participate in a retirement plan.
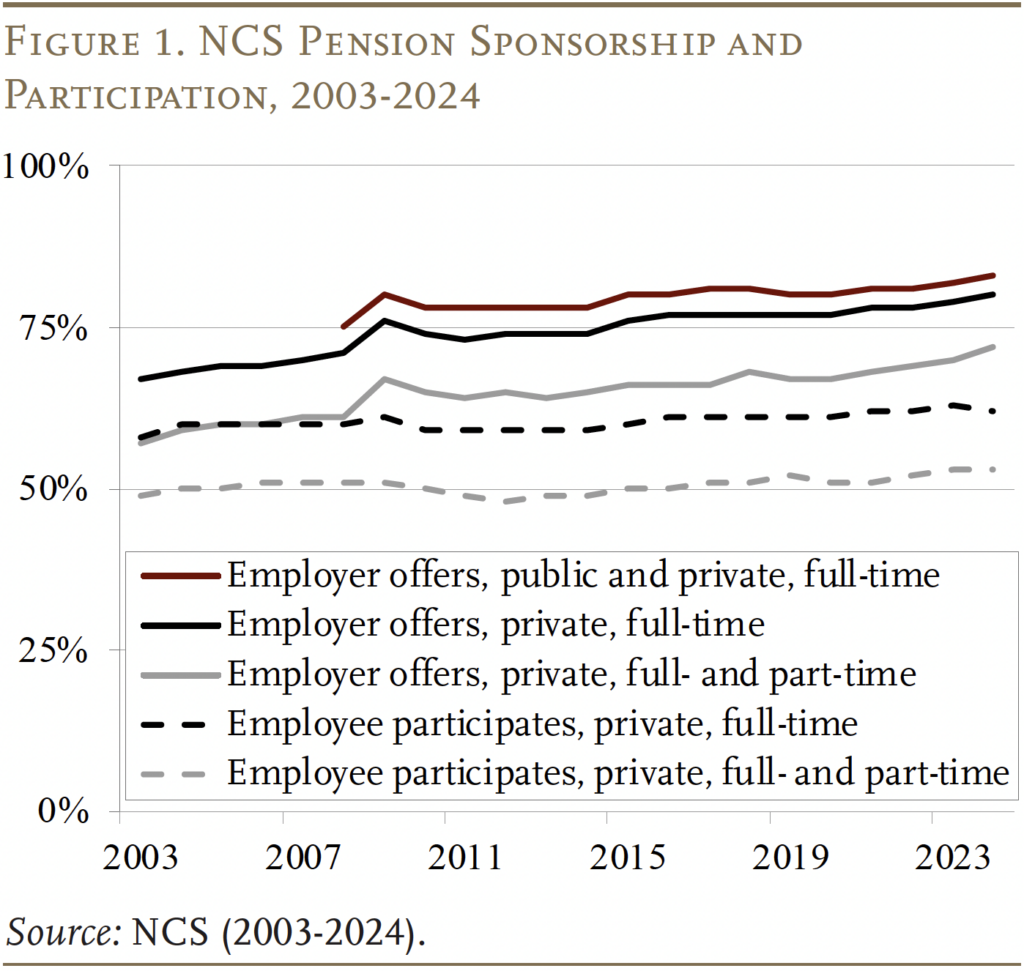
The NCS is also useful for assessing the extent to which coverage and participation have changed over the last 20 years (see Figure 1). At first glance, looking over the whole period since 2003, it appears that the percentage of private sector employers offering a plan has increased, but the percentage of workers participating has fluctuated around 50 percent. That pattern is not consistent with data reported by Vanguard showing the “take-up rate” rising over time as a result of the expansion of auto-enrollment in 401(k) plans.3 We would suggest focusing on the years 2009-2024, which show a basically stable pattern, with a slight uptick in both coverage and participation in the tight labor market that followed COVID. The bottom line is that the NCS is basically consistent with the “50-percent” participation story. How about the CPS?
Current Population Survey
In theory, the CPS is the perfect dataset for determining the extent of and trends in pension coverage. It provides all the demographic data one could want, it goes back four decades, and it has geographic detail. Since 1980 the CPS has consistently asked individuals two questions on retirement plans: 1) did the employer you worked for have a pension or other type of retirement plan for any of its employees? and 2) were you included in the plan?4
These questions produced reasonable results for decades. Importantly, until 2014 the CPS participation rates were only slightly lower than those from the IRS Statistics of Income for W-2 filings, which reports the percentage of total wage and salary workers who had either: 1) ticked a box saying they had coverage under an employer-sponsored retirement plan; or 2) contributed to a workplace retirement plan. These numbers serve as an important benchmark for judging the accuracy of the CPS coverage statistics (see Figure 2). (Note, the data in Figure 2 refer to all “civilian” workers, because the IRS does not separate private and public sector employees.)
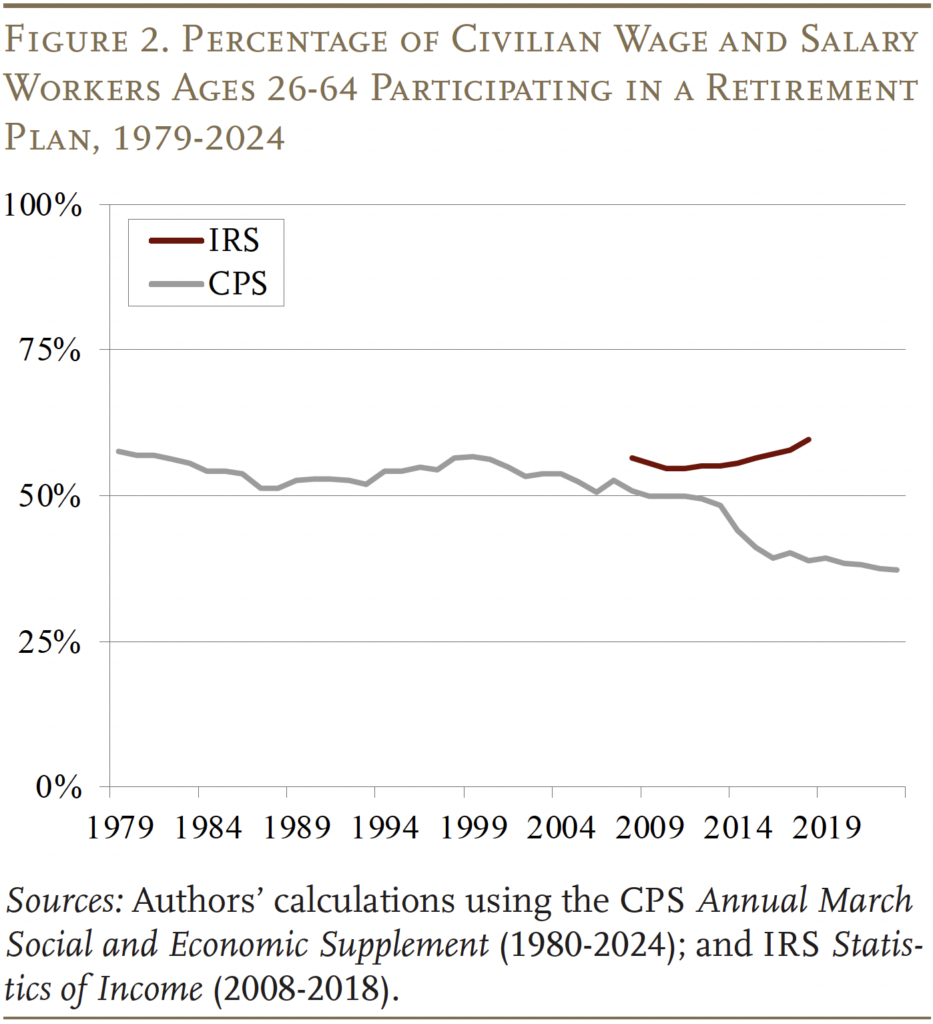
In 2014, however, the picture changed dramatically after a redesign of the CPS. Participation rates immediately fell well below the IRS numbers and have continued to decline to astonishing levels. No one believes that only 37 percent of U.S. civilian workers participate in a retirement plan.
What explains the collapse in the CPS pension participation numbers? No one knows for sure. Although the CPS coverage questions did not change in 2014, new questions were inserted before the coverage questions. The new questions – designed to get a better measure of income – asked about the existence of, and withdrawals from, retirement accounts and referred directly to several different types of accounts, including 401(k)s, 403(b)s, and various types of IRAs. One researcher suggests that when the existing coverage questions were asked at a later point in the survey, some respondents might have perceived that they were asking about additional retirement plans and therefore did not respond affirmatively.5 Whatever the reason, the CPS undercounts workers participating in a retirement plan and, sadly, is no longer a meaningful data source for pension participation. The question is whether useful information can be gleaned from other household surveys.
Pension Participation in Other Household Surveys
Three major household datasets – the Survey of Income and Program Participation (SIPP), the Panel Study of Income Dynamics (PSID), and the Survey of Consumer Finances (SCF)– explore pension coverage and participation.6 For researchers and policymakers, the advantage of these surveys is that they include extensive demographic and financial information about the household. The following describes each dataset in turn, beginning with the SIPP, which has the most complicated history with respect to its plan participation questions.
Survey of Income and Program Participation
The Demographic Surveys Division of the U.S. Census Bureau has conducted the SIPP since 1984, although the dataset underwent a considerable redesign in 2014. Prior to that redesign, a brand-new panel of individuals was started annually prior to 1993 and then every three to four years after that. The last pre-redesign panel occurred in 2008. Each panel of individuals was asked a series of core questions every four months for two and a half to five years. Questions on pension participation were not asked in this core set of questions, but instead at least once per panel as part of the topical module “Retirement Expectations and Pension Plan Coverage.” Within this module, individuals were asked whether they were offered a plan, whether they participated in a plan, and the type of plan for the primary and secondary plans. The design allowed for a biennial or triennial series beginning in 1985.
Starting in 2014, the SIPP was changed to an annual interview without topical modules. While the initial panel of this redesigned SIPP collected four waves of annual data, questions on current participation in retirement plans were only asked a single time, in a special “Social Security Supplement” in 2014. The questions in this supplement were similar to those in the old topical modules.
Following that supplement, the SIPP did not ask questions about participation in current employer-sponsored retirement plans again until the 2021 SIPP Questionnaire.7 Starting in January 2021 and continuing in 2022 and 2023, the SIPP began asking about participation in pension plans offered by the individual’s main employer in December of the prior year. Instead of asking about primary and secondary plans, individuals were asked three questions about whether their main employer provided: 1) an IRA; 2) a 401(k); and/or 3) a defined benefit/cash balance plan. Individuals were then asked questions about contributions to each of these plans. For purposes of this brief, workers are said to be participating in an offered IRA or 401(k) if they indicated that they were contributing. All people whose employers offered a defined benefit/cash balance plan were assumed to be participating.
Panel Study of Income Dynamics
The PSID is a longitudinal survey conducted by the Survey Research Center at the University of Michigan’s Institute for Social Research. Since 1969, the PSID has followed the same set of households (with minor exceptions) with low sample attrition rates, which creates an excellent source of data for a variety of research issues. However, until 1999, pension data from the PSID were somewhat limited, making the derivation of a consistent measurement of pension participation difficult. In 1999, a new section was added to the core questionnaire that introduced straightforward questions on participation in any employer-sponsored retirement plan for both the household’s designated PSID respondent and the spouse. Because these questions have not changed materially since 1999, this section of the PSID makes it possible to derive a biennial series on pension participation from 1999-2021, the most recent wave available.
Survey of Consumer Finances
The U.S. Board of Governors of the Federal Reserve System has conducted the SCF every three years since 1983. The survey samples about 5,000 households and, while it oversamples high-income households, is made nationally representative using survey weights. The SCF asks about inclusion in employer-sponsored plans and, for those included, about the type of plans involved. In addition, because the SCF is primarily focused on analyzing wealth, it also asks questions on the levels of investment that households have in retirement plans as well as future promised benefits. Like the other household surveys, the SCF allows breakdowns by demographic characteristics.
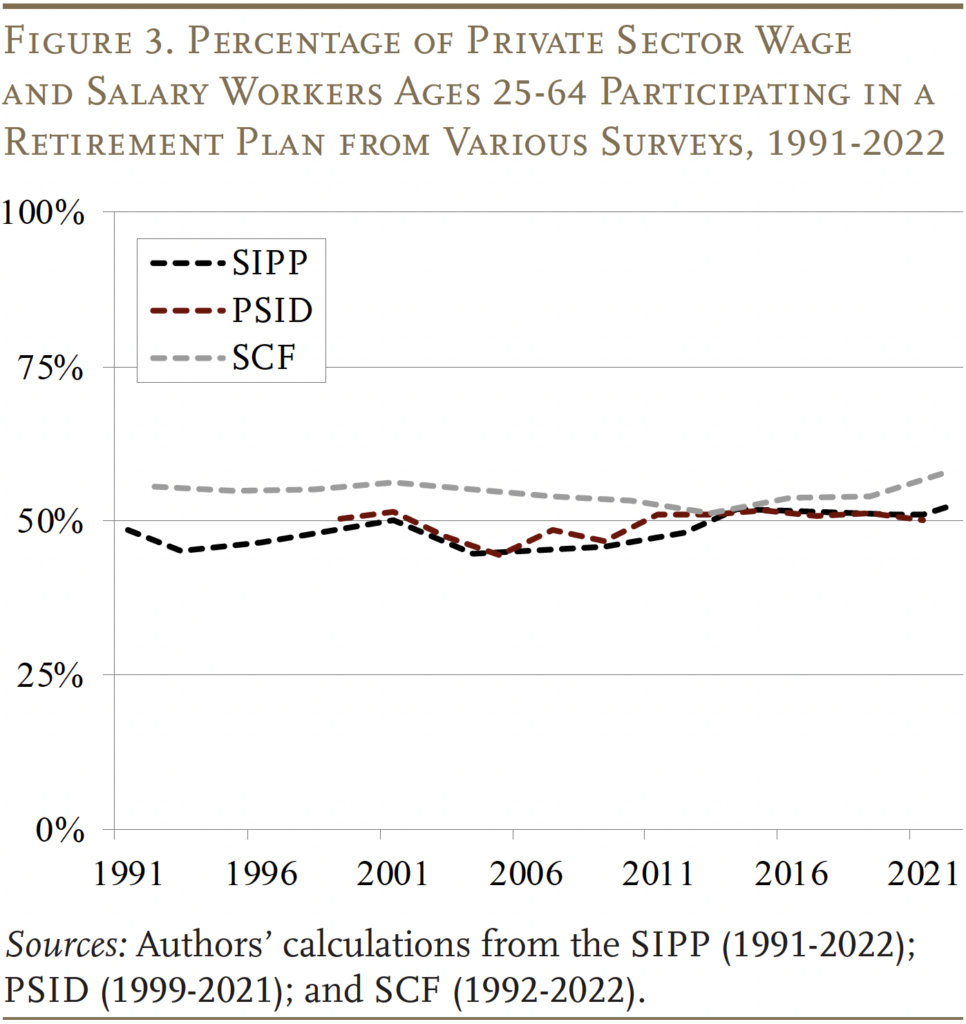
Figure 3 compares pension participation data from the three household surveys for 1991 to the present. The analysis focuses on private sector wage and salary workers ages 25-64, although, as indicated above, the years available and question wording vary from one survey to another. While pension participation has risen and fallen for short intervals, all three datasets show relatively stable participation rates over the period 1991-2022. The surveys suggest that, over the last three decades, between 44 and 58 percent of private sector employees are participating in some kind of pension plan in any given year. The most recent SIPP and PSID estimates fall in the middle of the historical range, at 52 and 50 percent respectively, while the most recent year of the SCF contains the upper-end estimate, perhaps because it likely includes some public sector workers.8
Efforts to Correct the CPS Data
While the household surveys provide useful information about participation in retirement plans, their limitations are significant. None of the datasets provide estimates every single year, and the SCF and PSID have small samples and thus little geographic detail. As a result, researchers continue to search for solutions to the undercounting problems in the CPS, which gets around these issues.
Several economists have suggested that the new questions from the CPS 2019 redesign might be helpful in getting a better measure of coverage.9 That is, a person providing an affirmative response to either the traditional coverage questions or to having earned interest from a retirement account would be considered participating. In a 2022 study, John Sabelhaus, who for years served as assistant director of Research and Statistics at the Federal Reserve, constructed an expanded dataset that added the “earned interest” response to establish coverage. The problem is that adding observed retirement accounts over-corrected for problems in the undercounting in the CPS. The likely issue is that some people with retirement accounts may no longer have retirement plan coverage through their current job. To solve that problem, Sabelhaus turned to the SCF to calculate the percentage of those with balances who also have coverage at their current job.
The results of the Sabelhaus study are not comparable to the other numbers in this review, since his focus was coverage – that is, access to a plan – rather than participation. To get comparable results, we applied his methodology to the participation rates, and the results are shown in Figure 4. Our estimates show that 49 percent of private sector workers participated in a retirement plan in 2023.

Conclusion
The conclusion from this review of existing datasets is that, except for a very recent uptick in coverage and participation after COVID in the SCF, participation in private sector retirement plans has not changed very much over the decades. So, it is reasonable to continue saying that – at any point in time – about 50 percent of private sector workers participate in a retirement plan.
Of course, coverage rates are higher than participation, and the picture looks better if government workers are included. And, a higher percentage will pick up coverage sometime over their worklife. But those workers who move in and out of coverage end up with inadequate retirement balances, and roughly one-third of households reach their 60s with no retirement plan at all.10 So, yes, the lack of continuous participation in an employer-sponsored retirement plan remains a serious problem.
References
Citro, Constance F. and Eric A. Hanushek, eds. 1997. Assessing Policies for Retirement Income. Needs for Data, Research, and Models. Washington, DC: National Research Council, National Academy Press.
Copeland, Craig. 2020. “Retirement Plan Participation and the Current Population Survey: The Impact of New Income Questions on These Estimates.” Issue Brief 499. Washington, DC: Employee Benefit Research Institute.
Internal Revenue Service. 2008-2018. SOI Tax Stats – Individual Information Return Form W-2 Statistics. Washington, DC.
Munnell, Alicia H., Anek Belbase, and Geoffrey T. Sanzenbacher. 2018. “An Analysis of Retirement Models to Improve Portability and Coverage.” Special Report. Chestnut Hill, MA: Center for Retirement Research at Boston College.
Munnell, Alicia H. and Dina Bleckman. 2014. “Is Pension Coverage a Problem in the Private Sector?” Issue in Brief 14-7. Chestnut Hill, MA: Center for Retirement Research at Boston College.
Sabelhaus, John. 2022. “The Current State of U.S. Workplace Retirement Plan Coverage.” Working Paper 726. Philadelphia, PA: Wharton Pension Research Council.
Sanzenbacher, Geoffrey. 2006. “Estimating Pension Coverage Using Different Data Sets.” Issue in Brief 6-51. Chestnut Hill, MA: Center for Retirement Research at Boston College.
University of Michigan, Institute for Social Research. Panel Study on Income Dynamics, 1999-2021. Ann Arbor, MI.
U.S. Department of Labor. National Compensation Survey, 2003-2024. Washington, DC.
U.S. Board of Governors of the Federal Reserve System. Survey of Consumer Finances, 1992-2022. Washington, DC.
U.S. Census Bureau. Current Population Survey, 1979-2024. Washington, DC.
U.S. Census Bureau. Survey of Income and Program Participation, 1991-2023. Washington, DC.
Vanguard. 2025. “A Q&A with the Author of How America Saves 2025.” Perspectives: DC Retirement (April 29). Malvern, PA.
Endnotes
- This analysis uses the latest available data from each survey, which varies from 2021-2024, as specified throughout the rest of the brief. Our prior work on this topic includes Munnell, Belbase, and Sanzenbacher (2018), Munnell and Bleckman (2014), and Sanzenbacher (2006). ↩︎
- The results of the first NCS were published in 1996 – the new survey merged the Occupational Compensation Survey, the Employer Costs for Employee Compensation Survey, the Employee Cost Index, and the Employee Benefits Survey. Benefit incidence was introduced in 1999. No benefit data are available in 2001 and 2002. In 2024, about 13,000 establishments (roughly 11,500 private sector establishments) were in the survey; they represent 7.4 million civilian (7.1 million private sector) establishments and 146.5 million civilian (126.7 million private sector) workers. ↩︎
- Vanguard (2025). ↩︎
- The survey does not gather any information on whether the plan was defined benefit or defined contribution. Such information is available for the years 1983, 1988, and 1993 from the employee benefit supplement, although experts found signs of significant misreporting of pension type. ↩︎
- Sabelhaus (2022). ↩︎
- The Health and Retirement Study is not discussed here because it focuses on a specific age cohort that is not conducive to calculating aggregate participation numbers. An excellent source of information on all relevant survey datasets is provided by Citro and Hanushek (1997). ↩︎
- Instead, the SIPP focused on ownership of 401(k)/IRA accounts or the availability of a defined benefit pension, but those may have been from a current or past employer. ↩︎
- In the SCF, public sector workers are eliminated based on industry codes that are obviously public, like “Public Administration.” However, because public workers also work in industries that include private workers, the SCF estimates here likely contain some public workers. ↩︎
- See, for example, Copeland (2020). ↩︎
- Munnell, Belbase, and Sanzenbacher (2018). ↩︎


Munnell, Alicia H., Geoffrey T. Sanzenbacher, and Nilufer Gok. 2025. "Has Pension Participation in the Private Sector Improved?" Issue in Brief 25-13. Chestnut Hill, MA: Center for Retirement Research at Boston College.